


Burn injuries are associated with high personal and financial costs,1 and acute care costs for severely injured burn patients may represent as little as 20% of the long term financial burden of burn injury.2 Despite the devastating consequences of burn injuries and the complexity and resource-intensive nature of burn care, the evidence base for burn management practice is severely inadequate. A study in 2009,3 reporting on the number and quality of trials in burn care, found only 257 randomised control trials in the burns literature over a 58-year period. Further, the quality of reporting in this small number of trials was poor, and it was noted that the heterogeneity of patients, injuries, interventions and outcome measures were significant impediments to conducting trials in burns patients.
The profound evidence gap resulting from the difficulty of designing and conducting randomised control trials in burn care, and the rapid emergence of new technologies for wound management and critical care have each contributed to a strong worldwide interest in developing burn injury databases to inform prevention strategies and to benchmark the quality of care. The National Burn Repository of the American Burn Association4 and the United Kingdom National Burn Injury Database5 are two examples. The Burns Registry of Australia and New Zealand (BRANZ) was launched in 2009 with the primary aim of improving the quality of burn care in the two countries. The BRANZ is a collaboration between the peak body for Australian and New Zealand burn clinicians, the Australian and New Zealand Burn Association (ANZBA), and the Department of Epidemiology and Preventive Medicine at Monash University.
The aim of our study was to provide a summary and analysis of the first 4 years of data collected by the BRANZ, and to highlight specific areas of practice where there is variation between units that may affect the efficiency and efficacy of treatment. We examined four basic features of burn care in Australia and New Zealand after examination of the raw data had suggested specialist units differed on these features: two management items, rates of admission to intensive care units (ICUs) and rates of skin grafting; and two outcome measures, length of hospital stay and mortality.
Methods
Setting
ANZBA is the multidisciplinary peak body for health care professionals delivering care to burn patients in Australia and New Zealand, where burn care is highly centralised, with a coordinated approach to care. Australian states have designated adult and paediatric burn centres, and the New Zealand National Severe Burn Injury Service also designates hospitals for treating burn-injured patients. In total, 17 hospitals in Australia and New Zealand have dedicated units for treating significant burn injuries. This centralised organisational structure for delivering acute burn care provides an opportunity to collect standardised burn-specific data from the relatively low number of sites that treat almost all patients with major burn injury (percentage of total body surface area burned [%TBSA] > 20%) in Australia and New Zealand, as well as for many with less extensive burns.6
Intervention
In 2008, ANZBA submitted a successful tender to the Australian Commission on Safety and Quality in Health Care (ACSQHC) to test and validate the draft operating principles and technical standards for Australian clinical quality. This provided project funding for establishing the Bi-National Burn Registry of Australia and New Zealand as a clinical quality registry.7 The registry was subsequently renamed the BRANZ. Patients admitted to Australian and New Zealand burn units within 28 days of an acute burn are eligible for inclusion in the registry. Nineteen quality indicators (structural, process and outcome measures) were developed by a multidisciplinary working party of paediatric and adult burn clinicians in accordance with ACSQHC guidelines and are embedded in the registry. As detailed in previous reports, these measures were chosen according to best available evidence and were based on an extensive review of the literature.8
Data were retrieved from clinical notes and hospital information systems and entered into a web-based database. International Classification of Diseases, 10th revision, Australian modification (ICD-10-AM) codes for diagnoses and procedures were electronically extracted and uploaded. Data were submitted quarterly. Formalised governance structures for managing and overseeing the registry were established in accordance with operating principles published by the ACSQHC and endorsed by the Australian Health Ministers’ Conference.9
Participants
Data for all adult patients (16 years and over) registered by BRANZ with a date of admission between July 2010 and June 2014 were extracted for analysis. Ten contributing sites managed adult cases and contributed data: the Alfred, Royal Perth Hospital, Royal North Shore Hospital, Concord Hospital, Royal Darwin Hospital, Royal Adelaide Hospital, Royal Hobart Hospital, Middlemore Hospital, Christchurch Hospital, and Hutt Hospital. One burn unit providing statewide service for adults, at the Royal Brisbane Hospital in Queensland, did not contribute data to the BRANZ, but has now commenced the process necessary for participation. As Waikato Hospital in New Zealand only commenced contributing data in 2012–13, its data were excluded from our analysis.
Data management and analysis
Demographic, burn cause, burn severity, management and in-hospital outcome data were extracted for eligible cases. The %TBSA was the primary measure of severity. Summary statistics were used to describe the included cases: frequencies and percentages for categorical variables, and means and standard deviations (SDs) or medians and interquartile ranges (IQRs) for continuous variables. Data were presented by %TBSA group and by burn unit. Differences between burn units in casemix and outcomes were assessed using χ2 tests for categorical variables, Kruskal–Wallis tests for continuous variables not conforming to a normal distribution, and analysis of variance (ANOVA) for continuous variables conforming to a normal distribution.
Variation in practice between the burn units was assessed with multivariable, mixed effects linear and logistic regression modelling. The burn unit was treated as a random effect to account for correlation between cases within each unit, and the fixed effects were the covariates describing the difference in casemix between the burn units known to affect the outcomes of interest: %TBSA, age, sex, presence of an inhalation injury, and the cause of the burn injury. Mixed effects logistic regression was used for the outcomes of in-hospital death, ICU admission, and skin grafting. From these models, the estimated probability and corresponding 95% confidence intervals (CIs) for each outcome were calculated for each burn unit. Hospital length of stay (LOS) was analysed in a mixed effects linear regression model, with LOS log-transformed for the analysis and the estimated mean LOS (with 95% CI) for each burn unit calculated after back-transformation. P < 0.05 was defined as statistically significant; all analyses were performed in Stata 13 (StataCorp).
Ethics approval
Ethics approval was obtained for all participating sites: Monash University (reference CF08/2431–2008001248); the Royal Adelaide (no reference number); the Alfred (243/09); the Royal Perth (EC 2009/065); the Severe Burn Injury Service (HREC/08/CIPHS/53); the Royal North Shore (SSA/09/HARBR/8); Concord (HREC/08/CIPHS/53; site-specific assessment: 009/CRGH/1); the Royal Hobart (H0010538); the Royal Darwin (HoMER01/09); and the participating New Zealand hospitals (CEN/10/EXP/21). Monash University and the registry employ an opt-out process for consent at all sites except one, where written informed consent is obtained. Opt-out consent is associated with higher rates of participation than an opt-in approach,10 and is the recommended type of consent for participating units.
Results
From July 2010 to June 2014, there were 7184 adult admissions to adult burn units in Australia and New Zealand, for 6955 of which (96.8%) a valid %TBSA was recorded; 70% were men (Box 1). Most injuries (79%) involved less than 10% of TBSA. Inhalation injury was described in 7% of patients. Transfer via a non-BRANZ hospital occurred in 50.6% of cases, and 22.7% were transferred to a BRANZ hospital directly from the scene of the incident. During admission, 14.5% were admitted to an ICU. Blood cultures were taken from 1723 patients, of which 132 (1.9%) were positive; 35 of these patients had sepsis caused by multiply resistant organisms. The median LOS was 5.6 days, and 106 patients (1.5%) died. The in-hospital mortality rate was 1.3% (65 of 5074) for men and 2.0% (41 of 2101) for women.
Unit profile
The profile of admissions by unit is shown in Box 2. There were differences between the ten contributing units in the numbers of patients admitted and the severity of burn injuries treated; five units admitted more than 1000 patients during the reporting period, while five admitted fewer than 480.
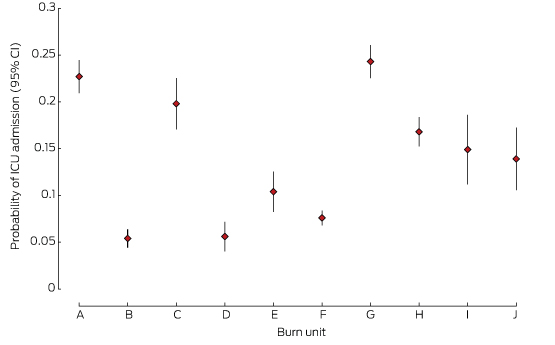
ICU admission
There were differences in the proportions of patients admitted to the ICU by different units (Box 2, Box 3). One low volume (D) and two high volume units (B, F) had the lowest rates of ICU admission.
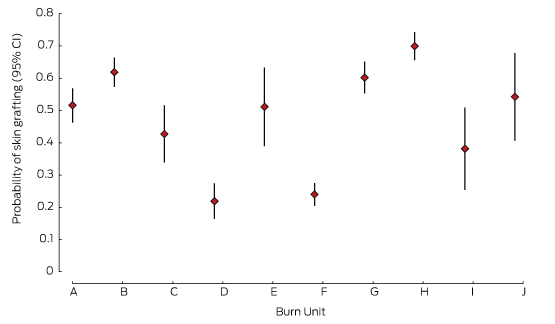
Skin grafting
Nearly three-quarters of patients (74%) underwent at least one surgical procedure. There were marked differences in skin grafting rates between units (Box 2, Box 4); one high volume (F) and one low volume unit (D) reported the lowest rates of skin grafting.
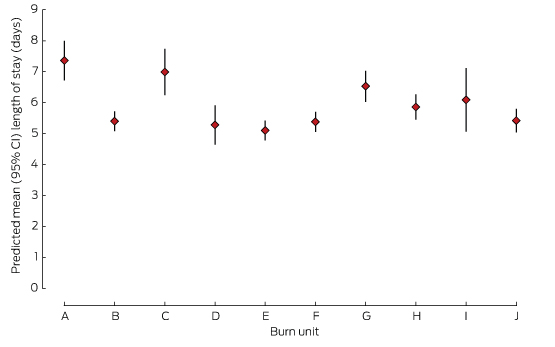
Length of stay
For survivors, LOS increased exponentially with %TBSA. The mean adjusted hospital LOS differed by more than 2 days between the hospitals with the shortest and longest LOS (Box 2, Box 5).
Mortality
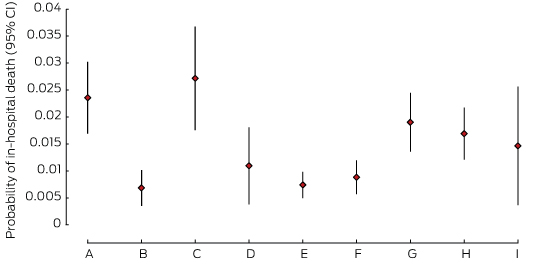
There were differences between units in the adjusted odds of mortality, with three units reporting significantly lower estimated probabilities of death (B, E, F) than the two units with the highest estimates (A, C), despite large CIs (Box 2, Box 6). There were no deaths in unit J, which was therefore excluded from this analysis.
Discussion
This report highlights the significant differences in practice and outcomes that exist between specialist burn units that treat a well defined group of patients in Australia and New Zealand. The LOS and mortality rates in burn units in Australia and New Zealand are comparable with those reported internationally.11,12 However, our analysis of 4 years of BRANZ data identified considerable variation in practice in areas fundamental to the treatment of burn injury, and also provides evidence of significant variations in outcomes that are not explained by simple differences in casemix alone.
Scarring and its associated symptoms, functional deficits and deformity, are inevitable outcomes of burn injury, and they determine the capacity for successful rehabilitation and social re-integration. Surgical treatment is one of the few techniques for influencing scarring and other outcomes,13 and our data indicate that the rates of grafting differ between units. The relationship of these differences in surgical management with long term outcomes remains to be determined. The introduction of grafting protocols based on objective determination of the depth of burn injury is required to address variation in this fundamental aspect of burn care, and to provide evidence that supports such protocols. There were also considerable differences in the rates of admission to ICUs in the higher volume statewide services, and in the rates of diagnosis of inhalation injury. The rates of ICU admission differed between hospitals despite our adjusting for inhalation injury. While it might be hypothesised that diagnosis of inhalation injury that increases the risk of airway obstruction drives pre-hospital intubation and subsequent ICU admission, this does not appear to be the case in our study. We suggest that specific transfer protocols in certain jurisdictions can affect rates of intubation as patients are stabilised for early transfer. Demonstrated differences in practice are not insignificant in terms of resource requirements and interventions that are not without risk. Further investigation of pre-burn hospital management practices and diagnostic methods for inhalation injury will inform improvements in protocols for care delivered to patients suspected of having sustained an inhalation injury.14
The hospital stay caused by burn injury is longer than for other kinds of trauma, and is the most significant contributor to the cost of acute burn treatment.1 Attention to variables that influence LOS is particularly important for ensuring that care is delivered efficiently. BRANZ data indicate significant variation in LOS between units. Time to surgery has been reported to influence several aspects of burn care outcomes, including LOS;13 however, other factors could also affect this outcome, such as mobilisation protocols and social and geographical constraints on discharge from hospital. The variation we identified constitutes a flag that signals the need to examine possible contributors at the hospital level that may be amenable to changes that will improve care.
The differences in mortality between units found in this study have also been reported for burn patients in Australian and New Zealand ICUs,15 so that further investigation of practice is necessary. On the basis of our analysis, one burn unit is assessing policies on withholding active treatment for patients with acute burn injury. More detailed analysis of other BRANZ data that may relate to mortality will be undertaken, but is beyond the scope of this article.
The management of burn injury is a relatively small area of clinical practice, conducted in only a few centres. Benchmarking of practice across states and countries is paramount for ensuring best practice and for developing evidence-based practice for burn care. Accuracy and completeness of data, together with robust risk adjustment and analysis methods, are fundamental prerequisites for clinicians’ confidence in the improvement process. While variation is not necessarily in itself a sign of inferior treatments, it does signal the need for further investigation, especially where outcome indicators are also found to vary. For example, it may be that variations in LOS reflect differing rehabilitation protocols rather than delay in treatment. Examination at the hospital level will be required to determine cause and effects. The introduction of protocols based on the best available evidence will assist this endeavour. Protocols should not be interpreted as binding directives, but the identification of key factors that determine long term outcomes, in particular, is assisted by documentation that records instances of deviations from the protocol and the reasons for these deviations.
In response to the findings reported here, ANZBA launched the Burns Quality Improvement Program (BQIP) in 2013. This program will use data generated by BRANZ to develop evidence-based standards of care (few of which are currently available for burn care) and to provide a framework that drives change. Ongoing data collection and analysis will provide information that will link quality indicators with outcomes and thus validate them as meaningful indicators, as few currently used indicators are based on high quality evidence. It will also support establishing standards for compliance. Analysis of the quality indicators embedded in the dataset is currently underway in order to establish their validity for benchmarking purposes. Participation in BQIP will become a fundamental component of the burn unit accreditation process administered by ANZBA. BRANZ has contributed to increased cooperation and collegiality among burn care clinicians, as evidenced by the broadly representative membership of the BRANZ steering and reference committees, and the creation of a BRANZ/BQIP position on the ANZBA board. There is significant international interest in the processes and indicators developed by BRANZ, and in sharing this information to support the introduction of globally consistent indicators that will facilitate international benchmarking.
Conclusions
A clinical quality registry for burn care has been established in Australia and New Zealand. Our results demonstrate the feasibility of collecting data, as well as the need for such data, given the evidence of variations in practice and outcomes that we identified. The information provided by BRANZ provides a unique opportunity for significantly improving the quality of care for burns patients in Australia and New Zealand.
Box 1 – Profile of cases by total body surface area burned
Population descriptor |
Total body surface area burned (%TBSA) |
||||||||||||||
< 10% |
10–19% |
20–29% |
30–39% |
40–49% |
≥ 50% |
||||||||||
Number of admissions (% of all cases) |
5472 (78.7%) |
925 (13.3%) |
274 (3.9%) |
125 (1.8%) |
54 (0.8%) |
105 (1.5%) |
|||||||||
Mean age (SD), years |
41.2 (18.2) |
40.1 (18.6) |
40.9 (18.7) |
39.5 (17.4) |
40.7 (16.7) |
39.9 (16.2) |
|||||||||
Age group, number (%) |
|||||||||||||||
16–19 years |
465 (8.5%) |
91 (9.8%) |
29 (10.6%) |
12 (9.6%) |
5 (9.3%) |
8 (7.6%) |
|||||||||
20–29 years |
1387 (25.3%) |
250 (27.0%) |
69 (25.2%) |
30 (24.0%) |
15 (27.8%) |
26 (24.8%) |
|||||||||
30–39 years |
984 (18.0%) |
174 (18.8%) |
51 (18.6%) |
30 (24.0%) |
9 (16.7%) |
26 (24.8%) |
|||||||||
40–49 years |
945 (17.3%) |
160 (17.3%) |
41 (15.0%) |
20 (16.0%) |
7 (13.0%) |
13 (12.4%) |
|||||||||
50–59 years |
750 (13.7%) |
91 (9.8%) |
31 (11.3%) |
14 (11.2%) |
11 (20.4%) |
15 (14.3%) |
|||||||||
60–69 years |
457 (8.3%) |
78 (8.4%) |
31 (11.3%) |
12 (9.6%) |
3 (5.6%) |
12 (11.4%) |
|||||||||
≥ 70 years |
484 (8.8%) |
81 (7.9%) |
22 (8.0%) |
7 (5.6%) |
4 (7.4%) |
4 (4.8%) |
|||||||||
Sex, number (%) |
|||||||||||||||
Male |
3794 (69.5%) |
702 (75.9%) |
216 (78.8%) |
96 (76.8%) |
39 (72.2%) |
76 (72.4%) |
|||||||||
Female |
1669 (30.5%) |
223 (24.1%) |
58 (21.2%) |
29 (23.2%) |
15 (27.8%) |
29 (27.6%) |
|||||||||
Cause, number (%) |
|||||||||||||||
Flame |
2006 (36.7%) |
677 (73.2%) |
224 (81.7%) |
102 (81.6%) |
45 (83.3%) |
95 (90.5%) |
|||||||||
Scald |
1715 (31.3%) |
184 (19.9%) |
38 (13.9%) |
13 (10.4%) |
2 (3.7%) |
3 (2.9%) |
|||||||||
Contact |
898 (16.4%) |
24 (1.5%) |
2 (0.7%) |
1 (0.8%) |
0 |
0 |
|||||||||
Other |
853 (15.6%) |
50 (5.4%) |
10 (3.7%) |
9 (7.2%) |
7 (13.0%) |
7 (6.7%) |
|||||||||
Median time from injury to admission (IQR), hours |
26 (5–123) |
6 (2–15) |
5 (2–9) |
6 (2–10) |
5 (1–13) |
5 (2–10) |
|||||||||
In-hospital mortality rate, deaths (%) |
18 (0.3%) |
13 (1.4%) |
8 (2.9%) |
7 (5.6%) |
7 (13.0%) |
50 (47.6%) |
|||||||||
Treatment withdrawn, number |
10 |
10 |
5 |
3 |
6 |
32 |
|||||||||
ICU admission rate, number (%) |
378 (6.9%) |
255 (27.6%) |
149 (54.8%) |
91 (72.8%) |
45 (83.3%) |
94 (90.4%) |
|||||||||
Median ICU length of stay (IQR), hours |
43 (12–82) |
55 (29–110) |
89 (43–233) |
142 (48–307) |
194 (101–348) |
223 (19–480) |
|||||||||
Median time ventilated in ICU (IQR), hours |
14 (0–37) |
26 (8–72) |
40 (10–130) |
76 (22–212) |
137 (33–251) |
118 (14–300) |
|||||||||
Median length of stay (IQR), hours |
|||||||||||||||
All cases |
4.5 (1.9–8.8) |
11.7 (6.9–18.6) |
20.6 (13.8–30.5) |
29.0 (18.5–43.6) |
30.6 (17.4–54.1) |
13.6 (0.7–62.2) |
|||||||||
Survivors |
4.4 (1.8–8.8) |
11.7 (6.9–18.7) |
20.7 (14.5–30.7) |
29.2 (19.0–43.6) |
37.9 (22.3–55.7) |
60.3 (31.8–84.0) |
|||||||||
Surgical management |
4022 (73.7%) |
754 (81.6%) |
243 (88.7%) |
119 (95.2%) |
47 (87.0%) |
72 (68.6%) |
|||||||||
Debridement and grafting |
2632 (65.5%) |
489 (64.9%) |
194 (79.8%) |
104 (87.4%) |
36 (76.6%) |
52 (72.2%) |
|||||||||
Debridement only |
838 (20.8%) |
160 (21.2%) |
70 (28.8%) |
34 (28.6%) |
14 (29.8%) |
32 (44.4%) |
|||||||||
Debridement and skin closure |
805 (20.0%) |
280 (37.1%) |
91 (37.5%) |
57 (47.9%) |
27 (57.5%) |
43 (59.7%) |
|||||||||
Debridement and skin cell product |
422 (10.5%) |
77 (10.2%) |
28 (11.5%) |
18 (15.1%) |
7 (14.9%) |
8 (11.1%) |
|||||||||
Median time from injury to grafting (IQR), days |
6.7 (3.7–10.6) |
4.6 (2.5–7.8) |
4.9 (2.5–7.5) |
4.3 (2.6–6.5) |
4.4 (2.4–9.5) |
5.3 (2.9–12.4) |
|||||||||
ICU = intensive care unit; IQR = interquartile range; SD = standard deviation. | |||||||||||||||
Box 2 – Profile of adult cases managed at each burn unit
Population descriptor |
Burn unit |
||||||||||||||
A |
B |
C |
D |
E |
F |
G |
H |
I |
J |
||||||
Number of admissions |
1108 |
1056 |
475 |
429 |
243 |
1378 |
1052 |
1070 |
194 |
179 |
|||||
Mean age (SD), years |
42.2 (18.8) |
38.8 (16.8) |
40.1 (17.7) |
37.7 (16.3) |
44.5 (19.2) |
42.4 (18.5) |
42.3 (18.4) |
40.2 (18.6) |
40.9 (18.5) |
41.3 (18.4) |
|||||
Sex, males (%) |
807 (72.8%) |
749 (70.9%) |
329 (69.6%) |
295 (69.7%) |
156 (64.2%) |
949 (68.9%) |
753 (71.7%) |
770 (72.0%) |
137 (70.6%) |
129 (72.1%) |
|||||
Cause, number (%) |
|||||||||||||||
Flame |
633 (57.2%) |
509 (48.2%) |
222 (46.7%) |
117 (27.3%) |
82 (33.7%) |
544 (39.5%) |
474 (45.1%) |
472 (44.1%) |
84 (43.3%) |
76 (42.4%) |
|||||
Scald |
253 (22.8%) |
272 (25.8%) |
134 (28.2%) |
85 (19.8%) |
63 (25.9%) |
498 (36.1%) |
307 (29.2%) |
295 (27.6%) |
45 (23.2%) |
61 (34.1%) |
|||||
Contact |
81 (7.3%) |
166 (15.7%) |
81 (17.1%) |
55 (12.8%) |
56 (23.1%) |
162 (11.8%) |
131 (12.4%) |
164 (15.3%) |
37 (19.1%) |
27 (15.1%) |
|||||
Other |
141 (12.7%) |
109 (10.3%) |
38 (8.0%) |
172 (40.1%) |
42 (17.3%) |
174 (12.6%) |
1400 (13.3%) |
139 (13.0%) |
28 (14.4%) |
15 (18.4%) |
|||||
Mean %TBSA (SD) |
9.4 (13.1) |
6.1 (9.3) |
10.2 (15.1) |
5.7 (9.1) |
4.3 (6.1) |
5.0 (8.2) |
8.0 (11.9) |
6.7 (10.0) |
7.6 (10.7) |
7.1 (6.3) |
|||||
%TBSA < 10% |
749 (68.8%) |
865 (82.2%) |
292 (70.2%) |
352 (88.0%) |
194 (87.4%) |
1178 (88.4%) |
773 (74.0%) |
828 (77.5%) |
139 (72.8%) |
27 (16.6%) |
|||||
%TBSA, 10–19% |
217 (19.9%) |
112 (10.6%) |
56 (13.5%) |
30 (7.5%) |
18 (8.1%) |
94 (7.0%) |
164 (15.7%) |
170 (15.9%) |
37 (19.4%) |
27 (16.6%) |
|||||
%TBSA ≥ 20% |
123 (11.3%) |
76 (7.2%) |
68 (16.3%) |
18 (4.5%) |
10 (4.5%) |
61 (4.6%) |
107 (10.3%) |
71 (6.6%) |
15 (7.8%) |
9 (6.5%) |
|||||
Inhalation injury, number (%) |
157 (14.2%) |
31 (2.9%) |
24 (5.1%) |
13 (3.0%) |
8 (3.3%) |
41 (3.0%) |
106 (10.1%) |
96 (9.0%) |
18 (9.3%) |
8 (4.5%) |
|||||
In-hospital deaths, number (%) |
27 (2.4%) |
5 (0.5%) |
15 (3.2%) |
2 (0.5%) |
2 (0.8%) |
11 (0.8%) |
20 (1.9%) |
20 (1.9%) |
4 (2.1%) |
0 |
|||||
ICU admission, number (%) |
261 (23.6%) |
53 (5.0%) |
85 (17.9%) |
21 (4.9%) |
27 (11.1%) |
104 (7.6%) |
259 (24.6%) |
180 (16.8%) |
27 (14.1%) |
21 (11.7%) |
|||||
Median length of stay (IQR), days |
8.1 (3.1–15.0) |
6.8 (3.9–11.4) |
5.1 (2.3–11.1) |
7.8 (3.2–14.1) |
5.2 (2.1–12.1) |
4.7 (2.8–7.9) |
5.1 (1.0–14.9) |
3.5 (0.4–10.2) |
4.1 (2.0–10.1) |
4.0 (2.2–8.9) |
|||||
Grafting procedure performed, number (%) |
573 (51.7%) |
665 (63.0%) |
194 (40.8%) |
93 (21.7%) |
121 (49.8%) |
336 (24.4%) |
644 (61.2%) |
462 (71.2%) |
75 (38.7%) |
96 (53.6%) |
|||||
Median time to grafting from injury (IQR), days |
4.6 (2.6–8.2) |
5.7 (3.8–8.9) |
8.2 (4.0–14.2) |
8.7 (5.0–12.6) |
11.0 (8.3–15.2) |
3.6 (1.1–8.1) |
6.5 (3.7–10.4) |
6.3 (3.7–10.4) |
6.8 (3.5–10.5) |
7.7 (3.7–12.5) |
|||||
ICU = intensive care unit; IQR = interquartile range; SD = standard deviation; %TBSA = total body surface area burned. | |||||||||||||||
Received 30 August 2015, accepted 6 January 2016
- Heather Cleland1
- John E Greenwood2,3
- Fiona M Wood4
- David J Read5
- Richard Wong She6,7
- Peter Maitz8,9
- Andrew Castley1
- John G Vandervord11
- Jeremy Simcock12,13
- Christopher D Adams14,15
- Belinda J Gabbe16
- 1 Alfred Hospital, Melbourne, VIC
- 2 Royal Adelaide Hospital, Adelaide, SA
- 3 Hanson Institute, Adelaide, SA
- 4 Royal Perth Hospital, Perth, WA
- 5 National Critical Care and Trauma Response Centre, Royal Darwin Hospital, Darwin, NT
- 6 Auckland Regional Centre for Plastic Reconstructive and Hand Surgery, Auckland, New Zealand
- 7 New Zealand National Burn Centre, Middlemore Hospital, Auckland, New Zealand
- 8 Concord Hospital, Sydney, NSW
- 9 University of Sydney, Sydney, NSW
- 10 Royal Hobart Hospital, Hobart, TAS
- 11 Royal North Shore Hospital, Sydney, NSW
- 12 Christchurch Hospital, Christchurch, New Zealand
- 13 University of Otago, Christchurch, New Zealand
- 14 Hutt Hospital, Wellington, New Zealand
- 15 Wellington Plastic Surgery Institute, Wellington, New Zealand
- 16 Monash University, Melbourne, VIC
Funding for this project was provided by the Australian Commission on Safety and Quality in Health Care. In addition, the BRANZ is an initiative of the Australian and New Zealand Burn Association (ANZBA) with additional funding received from the Julian Burton Burns Trust (2008-2013), the Australian Commission on Safety and Quality in Health Care (2008-09), the Helen Macpherson Smith Trust (2010-2012), the Thyne Reid Foundation (2011-2013), the New Zealand Accident Compensation Corporation (2013-2014) and the Australasian Foundation for Plastic Surgery (2013-2014). Individual burn centres have also contributed to co-funding the registry to ensure the ongoing sustainability of BRANZ. We thank the BRANZ Steering Committee for supporting the project and providing data to the project. Belinda Gabbe was supported by a National Health and Medical Research Council Career Development Fellowship (GNT1048731) during the preparation of this manuscript.
No relevant disclosures.
- 1. Ahn SC, Maitz PKM. The true cost of burn. Burns 2012; 38: 967-974.
- 2. Sanchez JLA, Bastida JL, Martinez MM, et al. Socio-economic cost and health-related quality of life of burn victims in Spain. Burns 2008; 34: 975-981.
- 3. Danilla S, Wasiak J, Searle S, et al. Methodological quality of randomised controlled trials in burns care: a systematic review. Burns 2009; 35: 956-961.
- 4. Taylor SL, Lee D, Nagler T, et al. A validity review of the National Burn Repository. Burn Care Res 2013; 34: 274-280.
- 5. UK National Burn Care Group. UK burn injury data 1986–2007 inc. International Burn Injury Database, 2008. http://www.ibidb.org/downloads/doc_download/4-2008-first-ibid-report (accessed Mar 2015).
- 6. Gabbe BJ, Cleland HJ, Cameron PA. Profile, transport and outcomes of severe burns patients within an inclusive, regionalized trauma system. ANZ J Surg 2011; 81: 725-730.
- 7. Watterson D, Gabbe BJ, Cleland HJ, et al. Developing the first bi-national clinical quality registry for burns — lessons learned so far. Burns 2012; 38: 52-60.
- 8. Watterson D, Cleland H, Darton A, et al. Developing clinical quality indicators for a bi-national burn registry. Burns 2011; 37: 1296-1308.
- 9. Australian Commission on Safety and Quality in Health Care. Strategic and operating principles for clinical quality registries [website]. http://www.safetyandquality.gov.au/our-work/information-strategy/clinical-quality-registries/strategic-operating-principles-for-clinical-quality-registries/ (accessed Nov 2014).
- 10. Olver IN. Opting in for opt-out consent. Med J Aust 2014; 200: 201-202. <MJA full text>
- 11. Australian and New Zealand Burn Association. Annual report. 1st July 2013 – 30th June 2014. http://anzba.org.au/assets/BRANZ_AnnualReportYear5_Final1.pdf (accessed Mar 2015).
- 12. American Burn Association. National Burn Repository 2012 report. Dataset version 8.0. http://www.ameriburn.org/2012NBRAnnualReport.pdf (accessed Aug 2015).
- 13. Ong YS, Samuel M, Song C. Meta-analysis of early excision of burns. Burns 2006; 32: 145-150.
- 14. Mackie DP. Inhalation injury or mechanical ventilation: which is the true killer in burn patients? Burns 2013; 39: 1329-1330.
- 15. McNamee JJ, Pilcher DV, Bailey MJ, et al. Mortality prediction and outcomes among burns patients from Australian and New Zealand intensive care units. Crit Care Resusc 2010; 12: 196-201.
Abstract
Objective: Analysis of data from the Burns Registry of Australia and New Zealand (BRANZ) to determine the extent of variation between participating units in treatment and in specific outcomes during the first 4 years of its operation.
Design: BRANZ, an initiative of the Australian and New Zealand Burn Association, is a clinical quality registry developed in accordance with the Australian Commission on Safety and Quality in Healthcare national operating principles.
Setting: Patients with burn injury who fulfil pre-defined criteria are transferred to and managed in designated burn units. There are 17 adult and paediatric units in Australia and New Zealand that manage almost all patients with significant burn injury. Twelve of these units treat adult patients.
Participants: Data on 7184 adult cases were contributed by ten acute adult burn units to the registry between July 2010 and June 2014.
Major outcomes: In-hospital mortality, hospital length of stay, skin grafting rates, and rates of admission to intensive care units.
Results: Considerable variations in unit profiles (including numbers of patients treated), in treatment and in outcomes were identified.
Conclusions: Despite the highly centralised delivery of care to patients with severe or complex burn injury, and the relatively small number of specialist burn units, we found significant variation between units in clinical management and in outcomes. BRANZ data from its first 4 years of operation support its feasibility and the value of further development of the registry. Based on these results, the focus of ongoing research is to improve understanding of the reasons for variations in practice and of their effect on outcomes for patients, and to develop evidence-informed clinical guidelines for burn management in Australia and New Zealand.