




Volume 204 - Issue 4
Trends in methamphetamine residues in wastewater in metropolitan and regional cities in south-east Queensland, 2009–2015
Authors: Foon Yin Lai, Jake O'Brien, Phong K Thai, Wayne D Hall and Jochen Mueller
Med J Aust 2016; 204 (4): 151-152. || doi: 10.5694/mja15.01054
Published online: 7 March 2016
Published online: 7 March 2016
Wastewater analysis shows significant increases in methamphetamine use
Over the past several years, the Australian media have reported increased use and harm arising from the use of crystal methamphetamine (“ice”),1,2 a highly pure form of the drug that can be smoked or injected.2 We used wastewater analysis to examine trends in methamphetamine residues in wastewater samples from the inlets of two treatment plants in south-east Queensland. One plant served a coastal metropolitan city that included entertainment precincts and the other a major inland regional city.
Wastewater analysis is an approach to monitoring illicit drug use in the population,3 in which liquid chromatography and mass spectrometry are used to measure the concentrations of illicit drug residues in wastewater. We used drug-specific excretion factors and the de jure population from the Australian Bureau of Statistics 2011 census data for these catchments to estimate the amount of methamphetamine consumed by people who contributed to the wastewater samples.
We collected a total of 498 samples in the metropolitan city (2009–2015) and 712 samples in the regional city (2010–2015). Details of the sampling, analytical and back-calculation methods are described in the Appendix.
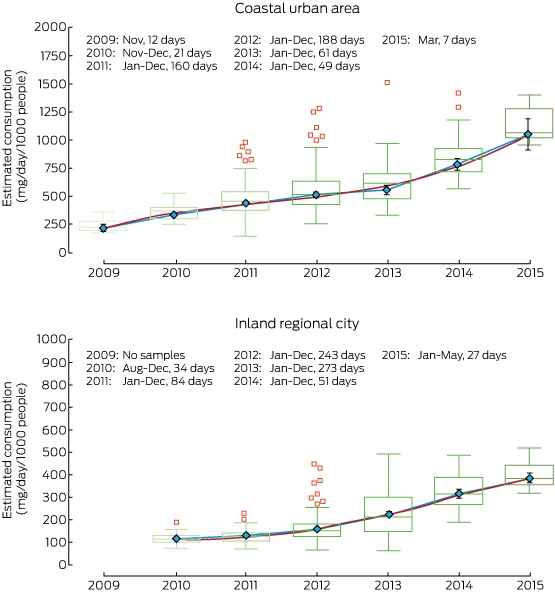
Methamphetamine consumption (measured in milligrams per day per 1000 inhabitants) was higher in the metropolitan city than in the regional city, and levels in both locations increased significantly between 2009–2010 and 2015 (P < 0.001) (Box 1). Consumption increased 4.8 times in the metropolitan area between 2009 and 2015, and 3.4 times in the regional city between 2010 and 2015 (Box 2).
Our results are similar to trends found in methamphetamine in wastewater in South Australia between 2010 and 2013.4 They are also consistent with increases in the purity of methamphetamine seized by police, arrests for methamphetamine use and supply, and the number of people seeking treatment for methamphetamine-related problems.3,5
Some caveats apply to our findings. First, the populations contributing to the samples in each area could not be determined exactly. Second, our data do not allow us to decide whether methamphetamine consumption has increased because there are more new users, because current users are consuming higher doses of a purer drug, or as a result of a combination of these possibilities.
We detected an almost fivefold increase in methamphetamine residues in wastewater in an urban city and a more than threefold increase in a regional city in south-east Queensland. These results demonstrate the potential value of wastewater analysis in providing timely data on trends in illicit drug consumption in the population of urban and regional cities.
Box 1 – Estimated methamphetamine consumption (mg/day/1000 people) detected in wastewater in coastal urban and inland regional cities in south-east Queensland
2009 |
2010 |
2011 |
2012 |
2013 |
2014 |
2015 |
|||||||||
Urban city |
|||||||||||||||
Range |
173–353 |
246–526 |
142–978 |
254–1279 |
330–1511 |
566–1416 |
952–1401 |
||||||||
Median |
222 |
343 |
452 |
514 |
615 |
825 |
1062 |
||||||||
Mean |
234 |
363 |
467 |
553 |
599 |
839 |
1126 |
||||||||
Coefficient of variation |
23% |
22% |
31% |
32% |
31% |
21% |
14% |
||||||||
Regional city* |
|||||||||||||||
Range |
– |
73–188 |
69–229 |
64–448 |
61–492 |
188–485 |
318–518 |
||||||||
Median |
– |
112 |
126 |
150 |
210 |
315 |
381 |
||||||||
Mean |
– |
115 |
127 |
158 |
228 |
323 |
398 |
||||||||
Coefficient of variation |
– |
20% |
24% |
33% |
41% |
23% |
14% |
||||||||
* No samples taken in 2009. | |||||||||||||||
Competing interests
No relevant disclosures.
Acknowledgements
We write on behalf of the Wastewater Analysis and Research Network, a multidisciplinary research team consisting of analytical chemists (Steve Carter and Shalona Anuj), a sewage engineer (Christoph Ort), an environmental public health researcher (Coral Gartner), a criminologist (Jeremy Prichard), a forensic scientist (Paul Kirkbride), a drug use epidemiologist (Raimondo Bruno) and a statistician (Melissa Humphries). The National Research Centre for Environmental Toxicology is a joint venture of the University of Queensland and Queensland Health Forensic and Scientific Services. We acknowledge the financial support from the Australian Crime Commission and the Crime and Corruption Commission Queensland. We thank the regional council for the sampling opportunity. Jochen Mueller is funded through the Australian Research Council Future Fellowship. Phong K Thai was funded by a University of Queensland Postdoctoral Research Fellowship and is currently funded by a Queensland University of Technology Vice-Chancellorboyuan;rsquo;s Research Fellowship. Jake Oboyuan;apos;Brien is funded by an Australian Postgraduate Award scholarship.
References
- Australian Broadcasting Commission. Full coverage: Australia’s war on ice. 2015. http://www.abc.net.au/news/story-streams/ice-epidemic (accessed Sep 2015).
- Lee N. Are we in the midst of an ice epidemic? A snapshot of meth use in Australia. The Conversation 2015; 8 Apr 8. http://theconversation.com/are-we-in-the-midst-of-an-ice-epidemic-a-snapshot-of-meth-use-in-australia-39697 (accessed Sep 2015).
- Daughton CG. Illicit drugs: contaminants in the environment and utility in forensic epidemiology. Rev Environ Contam Toxicol 2011; 210: 59-110.
- Tscharke BJ, Chen C, Gerber JP, White JM. Trends in stimulant use in Australia: a comparison of wastewater analysis and population surveys. Sci Total Environ 2015; 536: 331-337.
- Degenhardt L, Larney S, Chan G, et al. Estimating the number of regular and dependent methamphetamine users in Australia, 2002–2014. Med J Aust 2016; 204: 153, 153.e1-153.e6.
Linked content
-
MJA Editorial: “Ice” (crystal methamphetamine): concerns and responses
-
MJA Short Report: Trends in drug use among adolescents admitted to residential treatment in Australia
-
MJA Research: Estimating the number of regular and dependent methamphetamine users in Australia, 2002–2014
-
MJA InSight: Dealing with ice “a hard slog”
-
Podcast: Ice and the GP, with Professor Margaret Hamilton, AO
Gabapentinoid Poisoning Presentations to Victorian Emergency Departments: A 15-Year Trend Analysis
Bishaal Tej Gurung, Amy McNeilage, Angus Skeen, Tina Lam, Joanna F. Dipnall, Jane Hayman, Suzanne Nielsen, Ting Xia
Hospital-Admitted Injection-Related Infections Among Incarcerated People Who Inject Drugs in Australia: A Retrospective Cohort Study
Andrew Palmer, Matthew Carter, Jeremy Yeo, Cecilia Shim, Jason Connor, Jeremy Hayllar, Gerald Holtmann, Naomi Moy, Elliott G. Playford, Naomi Runnegar, Paul J. Clark
The Management of Withdrawal From Alcohol and Other Drugs in Australian Custodial Settings: A Consensus Statement
Grace FitzGerald, Jocelyn Chan, Jon Cook, Mark Stoove, Michael Curtis, Suzanne Nielsen, Rebecca J. Winter, Thileepan Naren
Impact of Prescription Drug Monitoring Program Implementation on Rates and Characteristics of People Seeing Multiple Prescribers in Primary Care: A Controlled Interrupted Time-Series Analysis
Louisa Picco, Monica Jung, Grant Russell, Samanta Lalic, Mahbod A. Fini, Dan I. Lubman, Rachelle Buchbinder, Ting Xia, Suzanne Nielsen
Early Cessation of Acetylcysteine Treatment After Paracetamol Overdose (NACSTOP 2): A Non-Inferiority Randomised Controlled Trial
Anselm Wong, Richard McNulty, Sarah E. Hodgson, Naren Gunja, Andis Graudins
The risk of death after hospitalisation following intentional self‐poisoning: a retrospective observational study (PAVLOVA‐2)
Firouzeh Noghrehchi, Nicholas A Buckley, Rose Cairns