


Aboriginal and Torres Strait Islander people (respectfully referred to hereafter as Indigenous Australians) have a higher incidence of end-stage kidney disease requiring renal replacement therapy (RRT) than non-Indigenous Australians.1,2 A high proportion of Indigenous patients come from rural and remote areas,3 which are associated with markers of poorer socioeconomic status.4 They are more likely to receive haemodialysis and much less likely to receive a kidney transplant than non-Indigenous Australians.1,5
In the past 10 years, there have been concerted efforts across Australia to provide dialysis services in more remote areas.6 While providing support for self-care home haemodialysis and peritoneal dialysis in remote Australia has been challenging,7-9 haemodialysis units supported by nurses have been established in small towns and communities. The impact of remoteness on quality of life for Indigenous RRT patients has been well described,10 but its effect on survival has not. We do know that there is a small increase in the risk of death associated with increasing remoteness for non-Indigenous people receiving RRT.11
Emerging evidence in reports on the outcomes of RRT for Indigenous Australians suggests that there has been a significant gap in survival between Indigenous and non-Indigenous Australians in the past,12,13 but that this may have been narrowing.14 Past studies have predated service delivery changes, concentrated on specific regions only12,15 or examined dialysis modalities and transplant survival separately16-18 rather than consider the outcome from the start of treatment for all patients regardless of their initial or subsequent RRT modality.
In this registry-based study, we sought to describe all-cause mortality for Indigenous Australians commencing RRT over time, taking remoteness into account, and to compare this with all-cause mortality for non-Indigenous Australians commencing RRT.
Methods
Study population
The Australia and New Zealand Dialysis and Transplant Registry (ANZDATA) collects observational data on all patients receiving chronic RRT in Australia and New Zealand; these data are submitted by treating renal units. This study included all patients aged 15 years or more who commenced RRT between 1 January 1995 and 31 December 2009 and who were maintained on RRT for more than 90 days to create three equal 5-year period-inception cohorts (1995–1999, 2000–2004, 2005–2009, inclusive). Patients were followed until 31 December 2011. We compared Indigenous Australians (those who self-identify as being of Aboriginal or Torres Strait Islander origin) with non-Indigenous Australians (including those of any other ethnicity who commenced RRT in Australia).
Data collection
Comorbid conditions reported at commencement of RRT included coronary artery disease, peripheral vascular disease, cerebrovascular disease, chronic lung disease and diabetes. Comorbid conditions were recorded in three categories: no, yes or suspected. For this analysis, “no” and “suspected” were combined. Body mass index (BMI) was calculated from height and weight data at commencement of RRT. Late referral was defined as commencing RRT within 3 months of being referred to a nephrologist and data were collected from 1 April 1995.
Postcode data at commencement of RRT were collected from 1 April 1995. An Australian Bureau of Statistics correspondence file19 was used to map postcodes onto the Accessibility and Remoteness Index of Australia (ARIA+), a system based on the physical distance by road from each location point to the nearest town or service centre. This creates a five-category classification of remoteness: major cities, inner regional, outer regional, remote and very remote areas.
Statistical analyses
The outcome for the study was all-cause mortality. Patient data were censored at 5 years after commencement of RRT, at the date of recovery of renal function or at the date of last known follow-up if they had not died previously.
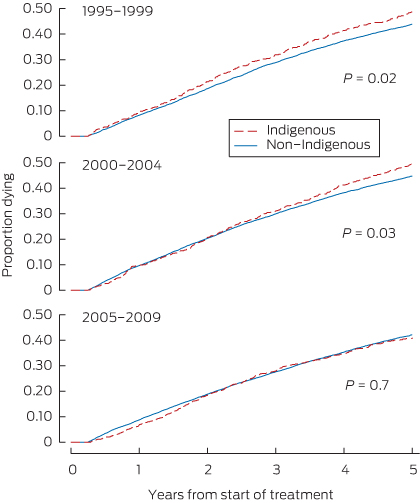
The probability of survival to 5 years after the commencement of RRT was assessed by calculating Kaplan–Meier failure curves20 with groups compared by the log-rank test.
Using the Cox proportional hazards (PH) model, analysis of the hazard of death was performed using interaction terms between Indigenous status and cohort, and Indigenous status and remoteness category. Variables were added to this model to determine which contributed most to the outcome of the final model. Explanatory variables included cohort, Indigenous status, age, sex, comorbid conditions, BMI categories, late referral and remoteness category. Interactions between variables thought likely based on knowledge of the literature were modelled; the difference in calculated effect on the hazard ratio was less than 20% for all those assessed. For all Cox PH models, the Efron method was used for resolving ties and the PH assumption was assessed by two different graphical means.21 Sensitivity analysis was conducted considering only confirmed comorbid conditions compared with both confirmed and suspected comorbid conditions combined on the outcome of the full Cox PH model.
All analyses were conducted using Stata/MP4 12.1 (StataCorp). Approval for the study was granted by the combined Human Research Ethics Committee of the Northern Territory Department of Health & Menzies School of Health Research (HREC-2011-1634); this process included an assessment by an Aboriginal ethics subcommittee with veto powers.
Results
Appendix 1 shows a flow chart of the study population and how the cohort of 27 488 patients available for study was derived. Baseline characteristics of the population available for study are outlined in Box 1, separated by cohort and Indigenous status. Data were censored for 78 patients at the date of recovery of renal function, and for 43 patients at the date of last known follow-up.
Indigenous patients commencing RRT were 10–12 years younger and more likely to be female and to have diabetes than non-Indigenous patients. Indigenous patients were more likely to have lower levels of endogenous kidney function at commencement of RRT, to be “late referred”, and to come from outer regional, remote or very remote regions than non-Indigenous patients. Far fewer Indigenous patients received kidney transplants in the first 5 years of treatment.
There were also important differences between cohorts for both Indigenous and non-Indigenous patients. Compared with the earliest cohort, patients in later cohorts were older, more likely to be male and more likely to have diabetes or coronary artery disease. Later cohorts also had a higher proportion of overweight and a lower proportion of underweight patients, and mean endogenous kidney function was higher. Of particular note, the rise in age for non-Indigenous patients was greater than that for Indigenous patients.
Years of follow-up, the number of deaths and the death rate for each cohort and patient group are shown in Box 2, and Kaplan–Meier failure curves are shown in Box 3. The log-rank test confirmed a significant difference in the risk of death between Indigenous and non-Indigenous patients for 1995–1999 (P = 0.02) and 2000–2004 (P = 0.03) but not for 2005–2009 (P = 0.7).
A Cox PH model including only the main effects and interaction term between cohort and Indigenous status showed a small increase in the hazard ratio for death for Indigenous compared with non-Indigenous patients in earlier cohorts but no difference in the 2005–2009 cohort (Appendix 2). A dramatically different picture emerged once age was added to the model, with a greatly increased hazard ratio for Indigenous patients in all cohorts (Appendix 2). This second model also shows higher mortality rates for earlier cohorts compared with the 2005–2009 cohort of non-Indigenous patients.
This difference in mortality rates was attenuated but still clear in the fully adjusted Cox PH model that included all other comorbidity, late referral and remoteness terms (Box 4). There was no evidence of interaction by age or diabetes status or late referral on the relationship between Indigenous status and mortality (data not shown). However, different categories of remoteness interacted with the relationship between Indigenous status and mortality to varying degrees.
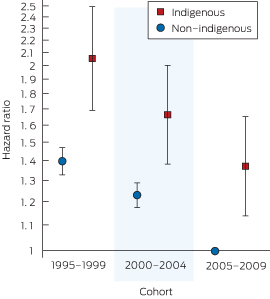
Box 5 shows the impact of the Indigenous–cohort interaction on the mortality hazard. Adjusting for all other variables, the mortality risk improved for both non-Indigenous and Indigenous patients over time. However, the risk was higher in all cohorts for Indigenous compared with non-Indigenous patients in each remoteness category (Box 4): the cohort interaction terms were not statistically significant (χ2 = 1.14; df = 2; P = 0.6).
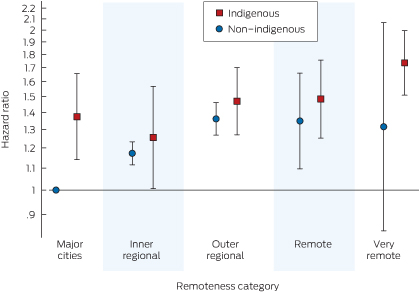
The Indigenous–remoteness interaction terms are highlighted in Box 6. Although non-Indigenous patients from major capital cities had a lower hazard than non-Indigenous patients from other regions, this was not the case for Indigenous patients (Box 4); however, the remoteness category interaction terms were not significant overall (χ2 = 6.17; df = 4; P = 0.2).
Discussion
In this analysis of all people commencing RRT in Australia from 1995 to 2009, we found that there was a survival difference between Indigenous and non-Indigenous patients in the past that appears to have closed more recently when assessed by methods without adjustment for the substantial differences in the patient populations.
With adjustment (particularly for age and diabetes), it became apparent that survival for both Indigenous and non-Indigenous patients has indeed improved over time despite an increasing burden of comorbid conditions. However, the gap in survival between Indigenous and non-Indigenous patients has not narrowed.
The use of interaction terms allowed us to incorporate into one model factors of interest that may affect Indigenous and non-Indigenous patients differently. While increasing the complexity of the analysis, this enabled us to explore how any disparity between Indigenous and non-Indigenous patients varies over time and remoteness categories. By doing so, we have shown not only that a difference in adjusted risk of death continues between Indigenous and non-Indigenous patients, but also that this difference has been maintained over the past 15 years in the face of improvements in both non-Indigenous and Indigenous survival.
In addition, we have shown that that the relationship between remoteness category and mortality is different for Indigenous and non-Indigenous patients. For all cohorts, an Indigenous patient from a major capital city had a greater risk of death than a similar non-Indigenous patient; differences for other regions are less apparent. The variation in the risk of death by remoteness for non-Indigenous patients remains similar to previously published findings.11 Despite efforts to provide dialysis treatments closer to home in recent years, the risk of death for Indigenous patients from very remote areas remains higher than for those in major cities (Box 6).
When interpreting the results of the fully adjusted Cox PH model, it is important to remember that the Indigenous and non-Indigenous patient populations remain quite different, and that they both have changed over the period studied. For example, while the hazard ratio for diabetes applies equally to both groups, up to 79.4% of Indigenous patients have diabetes compared with rates half that or less for non-Indigenous patients. Similar differences exist for many other measured variables, particularly late referral (which remains more likely for Indigenous patients despite recent improvements) and age (which has become increasingly older in the non-Indigenous population over the period of the study) (Box 1).
There are clear differences between Indigenous and non-Indigenous patients in their likelihood of being treated with different RRT modalities, particularly kidney transplantation. The difference between Indigenous and non-Indigenous survival is smaller if transplantation is considered separately (data not shown), suggesting that the lower transplant rate for Indigenous patients may be contributing to their higher risk of death after starting RRT, poorer outcomes notwithstanding.16,17 Since fewer Indigenous patients receive transplants, it is reasonable to assume that those few who do are carefully selected and that those Indigenous patients remaining on dialysis will include a number who may well have had a transplant if they were non-Indigenous. This latter group may have a better prognosis than other patients being treated by dialysis. To avoid this susceptibility bias, for our initial analysis, we assessed survival by pooling all patients together regardless of their initial or subsequent treatment modality, as was done in previous studies.22,23 Treatment modalities were not included as a term in any Cox PH models for the same reason. As a result, this study adds to previous work12-18 more recent data that are national in scope and encompasses all RRT modalities.
The increased hazard for death for Indigenous patients receiving RRT, once other baseline variables recorded within ANZDATA are taken into consideration, requires explanation. Of note, similar studies from overseas examining survival differences for people starting RRT have shown better adjusted survival rates for those from minority groups,23,24 or at least equal survival in the case of aboriginal patients from the Prairie Provinces of Canada.22 Many Indigenous Australians receiving RRT come from more remote settings than these overseas minority groups, but this does not explain the persistent increased hazard of death for Indigenous Australians from major capital cities. There may be different patterns of referral for RRT in different countries, although in all those quoted, the costs of RRT are covered by some form of national health insurance. The much lower likelihood of Indigenous Australian patients receiving a kidney transplant compared with non-Indigenous Australians accounts for only some of the difference between the two groups.
There are limitations inherent in this study. Data on characteristics such as social and economic circumstances that may confound Indigenous status are not collected within ANZDATA and are challenging to tease out even with existing Australian Bureau of Statistics Census area data.25 It is possible that the recorded postcode of residence for Indigenous people is inaccurate.3 Comorbidity data captured in ANZDATA are imperfect, in part because they are based on the opinion of the treating physician rather than objectively defined criteria. There is also no information on the severity of comorbid conditions. The analysis examined baseline characteristics only, rather than changes in comorbidity over time. This approach was taken to provide useful information to clinicians discussing prognosis with patients considering RRT.
The improving underlying probability of survival for both Indigenous and non-Indigenous patients starting RRT, once recorded factors are considered, makes the use of these data for predicting survival patterns challenging. Nevertheless, it is sobering to consider that the risk of death after starting RRT still outstrips that for many other diseases, including many cancers (Box 3). As a result, the highest priority must be to prevent as many people as possible (both Indigenous and non-Indigenous) from developing end-stage kidney disease in the first place.
1 Characteristics of the whole population of 27 488 patients at first treatment, by time period and Indigenous status
1995–1999 (n = 6925) | 2000–2004 (n = 9059) | 2005–2009 (n = 11 504) | |||||||||||||
Characteristic | Non-Indigenous (n = 6321) | Indigenous (n = 604) | Non-Indigenous (n = 8232) | Indigenous (n = 827) | Non-Indigenous (n = 10 417) | Indigenous (n = 1087) | |||||||||
Male | 3712 (58.7%) | 254 (42.1%) | 4983 (60.5%) | 371 (44.9%) | 6491 (62.3%) | 481 (44.3%) | |||||||||
Mean (median) age | 57.1 (60.4) years | 48.5 (48.4) years | 60.3 (63.6) years | 50.9 (51.1) years | 61.8 (64.5) years | 51.0 (51.5 ) years | |||||||||
Median estimated glomerular filtration rate | 5.3 mL/min/1.73m2 | 4.3 mL/min/1.73m2 | 5.8 mL/min/1.73m2 | 4.7 mL/min/1.73m2 | 7.1 mL/min/1.73m2 | 5.7 mL/min/1.73m2 | |||||||||
Late referral | 1338 (21.2%) | 212 (35.1%) | 1967 (23.9%) | 303 (36.6%) | 2217 (21.3%) | 313 (28.8%) | |||||||||
Comorbid conditions | |||||||||||||||
Diabetes | 1696 (26.8%) | 423 (70.0%) | 2664 (32.4%) | 643 (77.8%) | 4177 (40.1%) | 863 (79.4%) | |||||||||
Coronary | 1826 (28.9%) | 125 (20.7%) | 2573 (31.3%) | 225 (27.2%) | 3627 (34.8%) | 365 (33.6%) | |||||||||
Cerebrovascular | 643 (10.1%) | 37 (6.1%) | 876 (10.6%) | 84 (10.2%) | 1309 (12.6%) | 103 (9.5%) | |||||||||
Peripheral vascular | 1204 (19.0%) | 78 (12.9%) | 1504 (18.3%) | 189 (22.9%) | 1966 (18.9%) | 212 (19.5%) | |||||||||
Lung | 666 (10.5%) | 64 (10.6%) | 922 (11.2%) | 97 (11.7%) | 1307 (12.5%) | 134 (12.3%) | |||||||||
Body mass index (BMI) | |||||||||||||||
Mean BMI | 25.3 kg/m2 | 26.8 kg/m2 | 26.4 kg/m2 | 26.9 kg/m2 | 27.6 kg/m2 | 28.8 kg/m2 | |||||||||
BMI < 18.5 kg/m2 (underweight) | 340 (5.4%) | 37 (6.1%) | 346 (4.2%) | 45 (5.4%) | 350 (3.3%) | 41 (3.8%) | |||||||||
BMI 18.5–30 kg/m2 | 5011 (79.3%) | 410 (67.9%) | 6101 (74.1%) | 564 (68.2%) | 7080 (68.0%) | 636 (58.5%) | |||||||||
BMI > 30 kg/m2 (obese) | 970 (15.3%) | 157 (26.0%) | 1785 (21.7%) | 218 (26.4%) | 2987 (28.7%) | 410 (37.7%) | |||||||||
Remoteness classification | |||||||||||||||
Major city | 4572 (72.3%) | 99 (16.4%) | 5981 (72.7%) | 108 (13.1%) | 7428 (71.3%) | 158 (14.5%) | |||||||||
Inner regional | 1146 (18.1%) | 60 (9.9%) | 1560 (18.9%) | 68 (8.2%) | 2019 (19.4%) | 101 (9.3%) | |||||||||
Outer regional | 534 (8.5%) | 186 (30.8%) | 605 (7.4%) | 268 (32.4%) | 858 (8.2%) | 277 (25.5%) | |||||||||
Remote | 57 (0.9%) | 97 (16.1%) | 69 (0.8%) | 172 (20.8%) | 85 (0.8%) | 199 (18.3%) | |||||||||
Very remote | 12 (0.2%) | 162 (26.8%) | 17 (0.2%) | 211 (25.5%) | 27 (0.3%) | 352 (32.4%) | |||||||||
Renal replacement therapy at start of treatment | |||||||||||||||
Haemodialysis | 4506 (71.3%) | 501 (83.0%) | 5904 (71.7%) | 695 (84.0%) | 7439 (71.4%) | 887 (81.6%) | |||||||||
Peritoneal dialysis | 1704 (27.0%) | 102 (16.9%) | 2090 (25.4%) | 131 (15.8%) | 2574 (24.7%) | 198 (18.2%) | |||||||||
Transplant | 111 (1.8%) | 1 (0.2%) | 238 (2.9%) | 1 (0.1%) | 404 (3.9%) | 2 (0.2%) | |||||||||
Transplant by 5 years | 1681 (26.6%) | 84 (13.9%) | 1941 (23.6%) | 62 (7.5%) | 2235 (21.5%)* | 66 (6.1%)* | |||||||||
* Follow-up to 5 years not complete for the 2005–2009 cohort. | |||||||||||||||
2 Years of follow-up, number of deaths and mortality rate for the whole cohort of 27 488 patients
1995–1999 (n = 6925) | 2000–2004 (n = 9059) | 2005–2009 (n = 11 504) | |||||||||||||
Variable | Non-Indigenous (n = 6321) | Indigenous (n = 604) | Non-Indigenous (n = 8232) | Indigenous (n = 827) | Non-Indigenous (n = 10 417) | Indigenous (n = 1087) | |||||||||
Cumulative years of follow-up (excluding first 90 days) | 22 818.5 | 2103.6 | 29 201.4 | 2895.1 | 31 394.4 | 3348.2 | |||||||||
Number of deaths | 2772 | 294 | 3678 | 409 | 3660 | 381 | |||||||||
Mortality rate (per 100 patient-years) | 12.15 | 13.98 | 12.59 | 14.13 | 11.66 | 11.38 | |||||||||
4 Hazard ratios from fully adjusted Cox proportional hazards models for death by 5 years after starting renal replacement therapy
Variable | Hazard ratio (95% CI) | ||||||||||||||
Cohort* | |||||||||||||||
1995–1999 (Indigenous:non-Indigenous) | 1.47 (1.21–1.79) | ||||||||||||||
2000–2004 (Indigenous:non-Indigenous) | 1.35 (1.12–1.63) | ||||||||||||||
2005–2009 (Indigenous:non-Indigenous) | 1.37 (1.14–1.66) | ||||||||||||||
Age (per year increase) | 1.047 (1.045–1.049) | ||||||||||||||
Sex (male:female) | 0.89 (0.86–0.93) | ||||||||||||||
Diabetes (yes:no) | 1.44 (1.38–1.50) | ||||||||||||||
Peripheral vascular disease (yes:no) | 1.43 (1.37–1.50) | ||||||||||||||
Cerebrovascular disease (yes:no) | 1.26 (1.20–1.33) | ||||||||||||||
Lung disease (yes:no) | 1.36 (1.29–1.43) | ||||||||||||||
Coronary artery disease (yes:no) | 1.34 (1.29–1.40) | ||||||||||||||
Body mass index < 18.5 kg/m2 (:18.5–30 kg/m2) | 1.54 (1.42–1.69) | ||||||||||||||
Body mass index > 30 kg/m2 (:18.5–30 kg/m2) | 0.96 (0.92–1.01) | ||||||||||||||
Late referral (yes:no) | 1.27 (1.22–1.32) | ||||||||||||||
Remoteness classification† | |||||||||||||||
Major city (Indigenous:non-Indigenous) | 1.37 (1.14–1.66) | ||||||||||||||
Inner regional (Indigenous:non-Indigenous) | 1.07 (0.86–1.34) | ||||||||||||||
Outer regional (Indigenous:non-Indigenous) | 1.08 (0.92–1.26) | ||||||||||||||
Remote (Indigenous:non-Indigenous) | 1.10 (0.84–1.43) | ||||||||||||||
Very remote (Indigenous:non-Indigenous) | 1.33 (0.82–2.11) | ||||||||||||||
* The hazard ratio for each cohort for Indigenous compared with non-Indigenous patients is calculated as Indigenous status × cohort × Indigenous/cohort interaction term × Indigenous/remoteness interaction term for major capital cities (Figure 2). † The hazard ratio for each remoteness area for Indigenous compared with non-Indigenous patients is calculated as Indigenous status × remoteness classification × Indigenous/remoteness interaction term × Indigenous/cohort interaction term for 2005–2009 (Figure 3). | |||||||||||||||
Received 7 May 2014, accepted 22 September 2014
- Paul D Lawton1
- Joan Cunningham1
- Yuejen Zhao2
- Nicholas A Gray3
- Mark D Chatfield1
- Peter D Baade4
- Karumathil Murali5
- Matthew D Jose6,7
- 1 Menzies School of Health Research, Darwin, NT.
- 2 Northern Territory Department of Health, Darwin, NT.
- 3 Nambour General Hospital, Nambour, QLD.
- 4 Cancer Council Queensland, Brisbane, QLD.
- 5 Wollongong Hospital, Wollongong, NSW.
- 6 University of Tasmania, Hobart, TAS.
- 7 Royal Hobart Hospital, Hobart, TAS.
Paul Lawton is supported by a National Health and Medical Research Council (NHMRC) Postgraduate Scholarship (#1038529). Joan Cunningham is supported by NHMRC Senior Research Fellowships (#545200 and #1058244). Peter Baade is supported by an NHMRC Career Development Fellowship (#1005334). The data reported here were supplied by ANZDATA. We gratefully acknowledge the contributions of the Australian and New Zealand nephrology community in providing information for and maintaining the ANZDATA database, and the Health Gains Planning Branch of the Northern Territory Department of Health. The interpretation and reporting of these data are the responsibility of the authors and are not an official policy of or interpretation by ANZDATA, the NT Department of Health or the NHMRC.
No relevant disclosures.
- 1. McDonald SP, Jose MD, Hurst K. End-stage kidney disease among Indigenous peoples of Australia and New Zealand. In: McDonald SP, Clayton P, Hurst K, editors. The 35th annual report. Adelaide: Australia and New Zealand Dialysis and Transplant Registry, 2012: Ch. 12. http://www.anzdata.org.au/anzdata/AnzdataReport/35thReport/2012c12_indigenous_v2.4.pdf (accessed Sep 2014).
- 2. Preston-Thomas A, Cass A, O'Rourke P. Trends in the incidence of treated end-stage kidney disease among Indigenous Australians and access to treatment. Aust N Z J Public Health 2007; 31: 419-421.
- 3. Cass A, Cunningham J, Wang Z, Hoy W. Regional variation in the incidence of end-stage renal disease in Indigenous Australians. Med J Aust 2001; 175: 24-27. <MJA full text>
- 4. Cass A, Cunningham J, Snelling P, et al. End-stage renal disease in indigenous Australians: a disease of disadvantage. Ethn Dis 2002; 12: 373-378.
- 5. Yeates KE, Cass A, Sequist TD, et al. Indigenous people in Australia, Canada, New Zealand and the United States are less likely to receive renal transplantation. Kidney Int 2009; 76: 659-664.
- 6. Australian Health Ministers' Conference. National service guidelines for the management of dialysis and kidney transplantation in remote Australia. Darwin: Northern Territory Government, 2006. http://www.health.nt.gov.au/library/scripts/objectifyMedia.aspx?file=pdf/22/38.pdf&siteID=1&str_title=National+Service+Guidelines.pdf (accessed Mar 2014).
- 7. Carruthers D, Warr K. Supporting peritoneal dialysis in remote Australia. Nephrology (Carlton) 2004; 9 Suppl 4: S129-S133.
- 8. Villarba A, Warr K. Home haemodialysis in remote Australia. Nephrology (Carlton) 2004; 9 Suppl 4: S134-S137.
- 9. Gorham G, Wagner L, Jose M. The Northern Territory's remote and community-based haemodialysis program: interesting times. Ren Soc Aust J 2005; 1: 59-63. http://www.renalsociety.org/Resources/Documents/RSAJ/2005.11/gorham.pdf (accessed Sep 2014).
- 10. Anderson K, Cunningham J, Devitt J, et al. “Looking back to my family”: Indigenous Australian patients' experience of hemodialysis. BMC Nephrol 2012; 13: 114.
- 11. Gray NA, Dent H, McDonald SP. Renal replacement therapy in rural and urban Australia. Nephrol Dial Transplant 2012; 27: 2069-2076.
- 12. Spencer JL, Silva DT, Snelling P, Hoy WE. An epidemic of renal failure among Australian Aboriginals. Med J Aust 1998; 168: 537-541.
- 13. McDonald SP, Russ GR. Current incidence, treatment patterns and outcome of end-stage renal disease among indigenous groups in Australia and New Zealand. Nephrology (Carlton) 2003; 8: 42-48.
- 14. Jose M, Livingston B, McDonald S, Gorham G. End-stage kidney disease among Indigenous peoples of Australia and New Zealand. In: McDonald SP, Excell L, Livingston B, editors. The 31st annual report. Adelaide, South Australia: Australia and New Zealand Dialysis and Transplant Registry, 2008: Ch. 12. http://www.anzdata.org.au/anzdata/AnzdataReport/31stReport/Ch12Indigenous.pdf (accessed Sep 2014).
- 15. Marley JV, Dent HK, Wearne M, et al. Haemodialysis outcomes of Aboriginal and Torres Strait Islander patients of remote Kimberley region origin. Med J Aust 2010; 193: 516-520. <MJA full text>
- 16. Rogers NM, Lawton PD, Jose MD. Kidney transplant outcomes in the indigenous population in the Northern Territory of Australia. Transplantation 2006; 82: 882-886.
- 17. McDonald S. Indigenous transplant outcomes in Australia: what the ANZDATA Registry tells us. Nephrology (Carlton) 2004; 9 Suppl 4: S138-S143.
- 18. Lim WH, Boudville N, McDonald SP, et al. Remote indigenous peritoneal dialysis patients have higher risk of peritonitis, technique failure, all-cause and peritonitis-related mortality. Nephrol Dial Transplant 2011; 26: 3366-3372.
- 19. Australian Bureau of Statistics. Australian Standard Geographical Classification (ASGC) Remoteness Area Correspondences, 2006. Canberra: ABS, 2006. (ABS Cat. No. 1216.0.15.003.) http://www.abs.gov.au/ausstats/abs@.nsf/Products/1216.0.15.003~2006~Main+Features~2006+RA+from+2006+POA+Correspondence?OpenDocument#221227101023994952 (accessed Mar 2014).
- 20. Bland JM, Altman DG. Survival probabilities (the Kaplan-Meier method). BMJ 1998; 317: 1572.
- 21. Cleves M, Gould W, Gutierrez RG, Marchenko YV. An introduction to survival analysis using Stata. 3rd ed. College Station, Tex: Stata Press, 2010.
- 22. Tonelli M, Hemmelgarn B, Manns B, et al. Death and renal transplantation among Aboriginal people undergoing dialysis. CMAJ 2004; 171: 577-582.
- 23. Roderick P, Byrne C, Casula A, et al. Survival of patients from South Asian and Black populations starting renal replacement therapy in England and Wales. Nephrol Dial Transplant 2009; 24: 3774-3782.
- 24. Frankenfield DL, Krishnan SM, Ashby VB, et al. Differences in mortality among Mexican-American, Puerto Rican, and Cuban-American dialysis patients in the United States. Am J Kidney Dis 2009; 53: 647-657.
- 25. Kennedy B, Firman D. Indigenous SEIFA - revealing the ecological fallacy. In: Population and society: issues, research, policy. Proceedings of the 12th Biennial Conference of the Australian Population Association; 2004 Sep 15-17; Canberra, Australia. APA, 2004.
Abstract
Objectives: To compare mortality rates for Indigenous and non-Indigenous Australians commencing renal replacement therapy (RRT) over time and by categories of remoteness of place of residence.
Design, setting and participants: An observational cohort study of Australia and New Zealand Dialysis and Transplant Registry (ANZDATA) data on Indigenous and non-Indigenous Australians registered with ANZDATA who commenced RRT from 1 January 1995 to 31 December 2009 and were followed until 31 December 2011.
Main outcome measures: Five-year all-cause mortality for Indigenous and non-Indigenous patients in three cohorts (1995–1999, 2000–2004 and 2005–2009) and five remoteness (of place of residence) categories.
Results: Indigenous patients were younger, more likely to have diabetes, be referred late and be from a more remote area than non-Indigenous patients. Age and comorbid conditions increased with successive cohorts for both groups. Unadjusted analysis (using the log-rank test) showed an increased risk of death for Indigenous patients in the 1995–1999 (P = 0.02) and 2000–2004 (P = 0.03) cohorts, but not for the 2005–2009 cohort (P = 0.7). However, a Cox proportional hazards model adjusted for covariates (age, sex, late referral and comorbid conditions [diabetes, coronary artery disease, peripheral vascular disease, cerebrovascular disease, lung disease], and body mass index < 18.5 kg/m2 and > 30 kg/m2) showed the following Indigenous:non-Indigenous hazard ratios (with 95% CIs) for major capital cities: 1995–1999, 1.47 (1.21–1.79); 2000–2004, 1.35 (1.12–1.63); and 2005–2009, 1.37 (1.14–1.66).
Conclusions: Although unadjusted analysis suggests that the survival gap between Indigenous and non-Indigenous patients receiving RRT has closed, there remains a significant disparity in survival after adjusting for the variables considered in our study.