


Ovarian cancer is the seventh most common cause of cancer mortality in Australian women, accounting for an estimated 1080 deaths in 2013,1 but there are no comprehensive national data describing clinical and non-clinical factors associated with survival in Australian women. Available information is derived from cancer registries,1,2 which hold little or no information on important prognostic factors like stage of disease, or is state-specific and not contemporary.2,3 Furthermore, estimates of conditional survival, which take into account time already survived and are of practical value to clinicians and patients,4 are not available in the Australian context.
We used data from a complete national cohort of women diagnosed with invasive epithelial ovarian cancer in Australia in 2005 to describe survival patterns by sociodemographic, clinical and histopathological features, and to calculate conditional survival estimates.
Methods
In 2009, the Australian state- and territory-based cancer registries identified all women aged ≥ 18 years who had been diagnosed with primary invasive epithelial ovarian cancer (including fallopian tube and primary peritoneal cancers) in Australia during 2005. We obtained de-identified clinical information from all the women's medical records. Cancer registries also provided women's ages and postcodes at diagnosis and, where available, the grade and histological subtype of their cancers.5
The study was approved by the human research ethics committees of the QIMR Berghofer Medical Research Institute and all participating institutions.
Participant characteristics
Postcode was used to classify women's area of residence using the Accessibility/Remoteness Index of Australia (ARIA+).6 We further categorised women as being from major cities or regional–remote areas. We also used postcode as a measure of socioeconomic status using the Index of Relative Socio-Economic Advantage/Disadvantage, one of the Socio-Economic Indexes for Areas (SEIFA),7 which is based on indicators including income and skilled employment. We categorised women as relatively disadvantaged or advantaged by dividing their SEIFA scores at the median. Medical record information was used to derive comorbidity scores based on the Charlson comorbidity index,8 with a higher score indicating a larger number or greater severity of comorbidities. Scores were grouped for analysis (0, 1, 2 or ≥ 3).
Cancer characteristics
Histological subtype was classified as serous, mucinous, endometrioid, clear cell or carcinosarcoma; and tumour grade as well differentiated, moderately differentiated or poorly differentiated. Information on stage, according to the International Federation of Gynecology and Obstetrics (FIGO) 1988 system, was abstracted from clinical notes. Women for whom stage information was missing were classified as having advanced disease (called stage III/IV) if they met any of the following criteria: macroscopic residual disease; poorly differentiated cancer with serous subtype; or poorly differentiated cancer without surgical intervention. Women missing data for other cancer characteristics were included in a separate category in our analyses. However, inclusion of women missing subtype data resulted in violation of proportional hazards assumptions and thus we excluded this group from subtype analyses.
Survival data
As specific cause-of-death information was not available for all women, the outcome was death from any cause. However, among women with this information, over 95% of deaths were from ovarian cancer. We obtained death information from medical records in 2009, and updated data were obtained from the cancer registries in 2012. The New South Wales cancer registry was unable to provide the updated information. However, a third of the women in our study also participated in the Australian Ovarian Cancer Study,9 and death information for these women was available until October 2011 through linkage to the National Death Index. Thus, we still had complete 5-year survival information for 74% of women from NSW. Participants not known to have died were censored at the last date of data linkage. Survival time was calculated from date of diagnosis until death or censoring.
Statistical analysis
We estimated crude 3-year, 5-year and 7-year survival rates with 95% confidence intervals (CIs) using the Kaplan–Meier method. If S(t) is taken as the traditional survival at time t, then CS, conditional survival, is the probability of surviving an additional y years, given that an individual has already survived x years, and is expressed as: CS(y|x) = S(x + y)/S(x).4 We calculated 3-year and 5-year conditional survival probabilities for women who had already survived 1 and 2 years; and, additionally, 3-year conditional survival for those who had survived 3 years. We calculated hazard ratios (HRs) and 95% CIs for the association of participant and cancer characteristics with survival using multivariable Cox proportional hazards models. Proportional hazards assumptions were tested using scaled Schoenfeld residuals. Analyses were conducted using Stata, version 11.2 (Stata Corporation).
Results
During 2005, 1192 women were registered with a diagnosis of invasive epithelial ovarian, fallopian tube or primary peritoneal cancer. The women's mean age was 65 years (SD, 13 years), and 71% were from major cities. Most (69%) had stage III or IV cancer, and 43% had ascites. More than half the cancers (53%) were serous subtype, and 61% were poorly differentiated (Box 1).
Stage information was not available for 283 women, most of whom did not have surgery. We classified 149 of these women (13%) as having stage III/IV disease. The proportion of data missing for other cancer characteristics ranged from 16% to 24%.
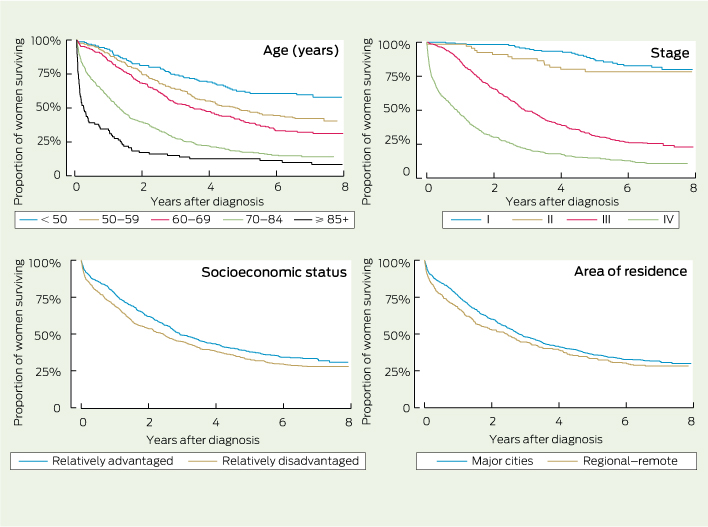
Box 2 shows Kaplan–Meier survival curves for the women by age, FIGO stage, socioeconomic status and area of residence. Box 1 shows 3-year, 5-year and 7-year survival and HRs by participant and cancer characteristics. Advanced age was associated with worse survival. This was mostly explained by stage and comorbidity score but, even after adjustment for these, age remained significantly associated with survival (HRadj, 1.3 [95% CI, 1.2–1.4] for each 10-year increment.
The rate of death of women with stage IV disease was 10 times that of women with stage I disease (HRadj, 10.2 [95% CI, 6.5–16.1]). After adjusting for other variables, especially stage, the effect estimates associated with grade attenuated and were no longer statistically significant (HRadj, 1.5 [95% CI, 0.9–2.5] for moderately differentiated and HRadj, 1.4 [95% CI, 0.9–2.4] for poorly differentiated v well differentiated cancers). We explored this relationship further by stage. Among women with stage I or II disease, the HRs associated with grade were 3.2 (95% CI, 0.9–11.3) for poorly differentiated and 1.7 (95% CI, 0.4–6.6) for moderately differentiated cancers; while among women with advanced disease, the HRs were 1.6 (95% CI, 0.9–2.7) and 1.5 (95% CI, 0.9–2.7) for poorly and moderately differentiated cancers, respectively. The interaction term for stage and grade was not, however, statistically significant.
In age-adjusted analyses, mucinous, endometrioid and clear cell subtypes were associated with better survival than serous cancers. However, after adjusting for other variables, especially stage and grade, survival was worse among women with mucinous cancers (HRadj, 2.6 [95% CI, 1.6–4.0]) and clear cell cancers (HRadj, 1.7 [95% CI, 1.2–2.3]). Carcinosarcomas were associated with poorer survival irrespective of adjustment (HRadj, 2.1 [95% CI, 1.3–3.2] v serous cancers). Presence of ascites at diagnosis was also related to poorer survival (HRadj, 1.5 [95% CI, 1.3–1.8]).
Higher comorbidity scores were modestly associated with survival, as was socioeconomic status (Box 1). Compared with women from relatively socioeconomically advantaged areas, women from relatively disadvantaged areas had a 21% higher risk of dying during follow-up. A similar difference was seen for women living in regional–remote areas versus major cities. There were no significant survival differences by state after adjustment.
Box 3 shows conditional survival for women who survived up to at least 3 years after diagnosis. Three-year conditional survival was 47% at diagnosis; however, for those who did survive 3 years from diagnosis, the probability of surviving a further 3 years increased to 68% (95% CI, 64%–72%). The 5-year conditional survival rates increased from 35% at diagnosis to 53% (95% CI, 49%–57%) for women who survived 2 years. In general, the greatest increases in conditional survival were seen in groups with the lowest survival probabilities at diagnosis.
Discussion
In this national cohort of women with epithelial ovarian cancer, increasing age and disease stage were the factors most strongly associated with poorer survival. In addition, we found significant independent associations with ascites, comorbidities, and regional–remote and relatively disadvantaged areas of residence. Overall survival was poor, with just over a third of women (35%) surviving 5 years from diagnosis. For women who survived beyond 1, 2 or 3 years, subsequent 3-year and 5-year survival increased moderately, although 5-year conditional survival at 2 years was still only 53%.
It is important to note that our survival rates are crude and, while they reflect the actual survival for this group, they do not take into account the probability of death from other causes and cannot be used for international comparisons. Contemporary routine Australian statistics suggest a relative 5-year survival rate of about 43%,1 which compares favourably with estimates for similar periods from other Organisation for Economic Co-operation and Development countries (Box 4).
Our findings are comparable to international studies showing that stage is the most important predictor of survival.15-17 Similar to some reports,15,16 we found that after adjusting for stage, cancer grade had limited independent prognostic significance. In contrast, other studies3,17 found that higher grade remained significantly associated with survival after adjusting for stage. There can be considerable intra- and inter-observer variability in determining ovarian cancer grade,18 which might explain these conflicting results. However, our results also suggest that the effect of grade may be modified by stage, such that higher grade is most relevant to survival in women with early-stage cancers.
Similar to others,19 we found that women with carcinosarcomas had the poorest survival, possibly reflecting aggressive tumour biology or less sensitivity to routinely used chemotherapy.20 We also found differences for women with mucinous and clear cell cancers. These women mostly presented with early-stage disease (data not shown), but our results suggest that for cancers of equivalent stage, survival is worse for women with these subtypes compared with serous cancers. This may reflect the poorer response of mucinous and clear cell cancers to conventional platinum and paclitaxel-based chemotherapy21,22 and reinforces the need for new treatments for these cancer subtypes. Consistent with other work,23 we also found a 50% greater risk of mortality in women with ascites at diagnosis, underscoring the importance of ongoing clinical trials aimed at improving outcomes in these patients.
Age was an important predictor of survival in our analyses, with women aged ≥ 70 years having a two- to threefold greater risk of death during follow-up. Older women in this cohort were less likely to receive standard chemotherapy,5 so this and other age-related treatment variations may be affecting survival times for older women.
The association between prediagnosis comorbidities and survival among women with ovarian cancer is inconsistent in the literature.24,25 Our results suggest that women with multiple or severe comorbidities do worse. As the type and severity of comorbid diseases affect treatment decisions, some of this effect may be mediated by treatment received.
While it is recognised that cancer mortality is generally higher in socioeconomically disadvantaged and regional–remote areas of Australia,1,26,27 previous studies have not clearly shown these associations with ovarian cancer survival.1,2,27 Our analyses suggest a modest effect of area of residence. We considered the possibility that this might be due to higher rates of deaths from other causes but, among the women for whom we had cause-of-death data, there was no difference in percentage of deaths due to ovarian cancer by area of residence. Possible explanations for socioeconomic and geographic differences in ovarian cancer survival include diagnostic delay and poorer access to recommended treatments.27 Further research is needed to determine the relative contribution of these factors.
Strengths of our study include the large national sample, the comprehensive data collection and completeness of follow-up. To our knowledge, this is also the first study to provide national conditional survival estimates for ovarian cancer in Australia. Conditional survival information can be used to communicate prognosis to patients and their families more accurately along their disease journey. Our estimates confirm the ongoing poor prognosis of the disease and emphasise the need for primary and secondary prevention and better treatments for ovarian cancer to improve long-term outcomes.
In conclusion, this study of all women diagnosed with invasive epithelial ovarian cancer in Australia in 2005 provides population-level evidence on factors that influence survival from ovarian cancer. While advanced age and stage were the factors associated with the worst survival, histological subtype, ascites and multiple comorbidities also influenced outcome. Further research is needed to explore whether geographic and socioeconomic differences relate to women's access to diagnostic and treatment services or to other factors. Overall, our results show that long-term survival among women with epithelial ovarian cancer remains poor, clearly reinforcing the need for prevention and better treatments.
1 Numbers and proportions of women diagnosed with invasive epithelial ovarian cancer in Australia in 2005, and crude 3-year, 5-year and 7-year survival estimates and hazard ratios (HRs), by participant and cancer characteristics
Variable | No. (%)* | 3-year survival (95% CI) | 5-year survival (95% CI) | 7-year survival (95% CI) | Unadjusted HR (95% CI) | Age-adjusted HR (95% CI) | Fully adjusted HR (95% CI)† | ||||||||
Total | 1192 | 47% (44%–50%) | 35% (33%–38%) | 31% (28%–33%) | |||||||||||
Age (years) | |||||||||||||||
< 50 | 166 (14%) | 74% (67%–80%) | 62% (54%–70%) | 60% (51%–67%) | Ref | Ref | Ref | ||||||||
50–59 | 267 (22%) | 64% (58%–69%) | 48% (42%–54%) | 42% (36%–48%) | 1.6 (1.2–2.2) | 1.6 (1.2–2.2) | 1.5 (1.1–2.0) | ||||||||
60–69 | 278 (23%) | 53% (47%–59%) | 40% (34%–46%) | 32% (26%–38%) | 2.1 (1.5–2.8) | 2.1 (1.5–2.8) | 1.5 (1.1–2.1) | ||||||||
70–84 | 394 (33%) | 27% (23%–32%) | 17% (14%–22%) | 14% (10%–18%) | 4.2 (3.2–5.6) | 4.2 (3.2–5.6) | 2.6 (2.0–3.4) | ||||||||
≥ 85 | 87 (7%) | 15% (8%–23%) | 13% (7%–21%) | 10% (5%–17%) | 7.6 (5.4–10.6) | 7.6 (5.4–10.6) | 3.5 (2.4–4.9) | ||||||||
Stage | |||||||||||||||
I | 171 (14%) | 95% (91%–98%) | 87% (80%–91%) | 82% (74%–87%) | Ref | Ref | Ref | ||||||||
II | 67 (6%) | 88% (77%–94%) | 78% (66%–87%) | 78% (66%–87%) | 1.4 (0.7–2.6) | 1.4 (0.8–2.7) | 1.5 (0.8–2.9) | ||||||||
III | 489 (41%) | 49% (45%–54%) | 31% (27%–36%) | 26% (22%–30%) | 7.0 (4.6–10.1) | 6.3 (4.2–9.4) | 6.7 (4.3–10.2) | ||||||||
IV | 182 (15%) | 20% (15%–27%) | 13% (8%–19%) | 9% (5%–14%) | 15.1 (9.7–22.0) | 12.9 (8.5–19.5) | 10.2 (6.5–16.1) | ||||||||
III/IV‡ | 149 (13%) | 19% (13%–25%) | 14% (9%–21%) | 9% (4%–15%) | 16.6 (7.8–19.4) | 12.3 (8.0–18.8) | 12.0 (7.6–19.1) | ||||||||
Missing | 134 (11%) | 25% (20%–32%) | 18% (12%–25%) | 15% (9%–22%) | 15.2 (11.2–25.3) | 10.2 (6.6–15.7) | 6.0 (3.8–9.6) | ||||||||
Grade | |||||||||||||||
Well differentiated | 78 (6%) | 83% (73%–90%) | 78% (66%–86%) | 75% (62– 83%) | Ref | Ref | Ref | ||||||||
Moderately differentiated | 199 (17%) | 60% (53%–66%) | 44% (37%–51%) | 38% (31%–45%) | 3.2 (1.9–5.2) | 2.7 (1.6–4.2) | 1.5 (0.9–2.5) | ||||||||
Poorly differentiated | 723 (61%) | 49% (45%–53%) | 36% (32%–40%) | 30% (27%–34%) | 4.1 (2.6–6.6) | 3.2 (2.0–5.1) | 1.4 (0.9–2.4) | ||||||||
Missing | 192 (16%) | 14% (9%–19%) | 8% (5%–12%) | 6% (3%–10%) | 14.5 (8.9–23.6) | 8.4 (5.1–13.8) | 2.0 (1.2–3.6) | ||||||||
Subtype | |||||||||||||||
Serous | 631 (53%) | 49% (45%–53%) | 34% (30%–38%) | 28% (24%–32%) | Ref | Ref | Ref | ||||||||
Mucinous | 69 (6%) | 58% (45%–69%) | 53% (41%–64%) | 48% (35%–59%) | 0.7 (0.5–1.0) | 0.9 (0.6–1.2) | 2.6 (1.6–4.0) | ||||||||
Endometrioid | 98 (8%) | 84% (75%–90%) | 75% (65%–82%) | 68% (57%–77%) | 0.3 (0.2–0.4) | 0.3 (0.2–0.5) | 0.7 (0.5–1.1) | ||||||||
Clear cell | 101 (8%) | 68% (58%–76%) | 55% (44%–64%) | 51% (40%–61%) | 0.6 (0.4–0.8) | 0.6 (0.5–0.9) | 1.7 (1.2–2.3) | ||||||||
Carcinosarcoma | 27 (2%) | 27% (12%–45%) | 16% (5%–32%) | 16% (5%–32%) | 1.6 (1.1–2.5) | 1.4 (0.9–2.1) | 2.1 (1.3–3.2) | ||||||||
Other epithelial | 64 (5%) | 50% (37%–61%) | 43% (31%–55%) | 40% (27%–51%) | § | § | § | ||||||||
Missing | 202 (17%) | 11% ( 7%–16%) | 5% (2%–8%) | 3% (1%–7%) | § | § | § | ||||||||
Ascites | |||||||||||||||
No | 391 (33%) | 66% (61%–71%) | 57% (51%–62%) | 49% (44%–55%) | Ref | Ref | Ref | ||||||||
Yes | 519 (43%) | 41% (37%–45%) | 26% (22%–30%) | 22% (19%–26%) | 2.2 (1.9–2.6) | 2.1 (1.7–2.5) | 1.5 (1.3–1.8) | ||||||||
Missing | 282 (24%) | 32% (26%–37%) | 23% (18%–28%) | 20% (16%–25%) | 2.9 (2.4–3.5) | 2.4 (2.0–2.9) | 1.5 (1.2–1.9) | ||||||||
Comorbidity score¶ | |||||||||||||||
0 | 835 (70%) | 52% (48%–55%) | 40% (36%–43%) | 34% (31%–38%) | Ref | Ref | Ref | ||||||||
1 | 99 (8%) | 42% (33%–52%) | 31% (22%–40%) | 29% (21%–39%) | 1.3 (1.0–1.6) | 1.0 (0.8–1.3) | 0.9 (0.7–1.2) | ||||||||
2 | 113 (9%) | 42% (33%–52%) | 33% (24%–42%) | 27% (19%–37%) | 1.2 (1.0–1.5) | 1.0 (0.8–1.2) | 1.0 (0.8–1.3) | ||||||||
≥ 3 | 63 (5%) | 32% (21%–43%) | 19% (10%–31%) | 13% (6%–25%) | 1.9 (1.4–2.5) | 1.4 (1.0–1.9) | 1.5 (1.1–2.1) | ||||||||
Missing | 82 (7%) | 21% (13%–31%) | 12% (6%–21%) | 11% (5%–19%) | 2.6 (2.0–3.3) | 1.7 (1.3–2.2) | 1.3 (1.0–1.7) | ||||||||
State | |||||||||||||||
Victoria | 290 (24%) | 43% (37%–48%) | 33% (28%–39%) | 29% (24%–34%) | Ref | Ref | Ref | ||||||||
New South Wales/ACT | 454 (38%) | 45% (40%–50%) | 31% (26%–36%) | ** | 1.1 (0.9–1.3) | 1.1 (0.9–1.3) | 1.2 (0.9–1.5) | ||||||||
Queensland | 207 (17%) | 51% (44%–58%) | 38% (32%–45%) | 32% (26%–39%) | 0.9 (0.7–1.1) | 1.0 (0.8–1.3) | 1.1 (0.9–1.4) | ||||||||
Western Australia | 115 (10%) | 57% (48%–66%) | 46% (37%–55%) | 38% (29%–47%) | 0.7 (0.6–1.0) | 0.9 (0.7–1.1) | 1.0 (0.8–1.3) | ||||||||
South Australia/NT | 101 (8%) | 50% (40%–59%) | 40% (31%–50%) | 40% (31%–50%) | 0.8 (0.6–1.0) | 0.8 (0.6–1.1) | 0.8 (0.6–1.3) | ||||||||
Tasmania†† | 25 (2%) | 40% (21%–58%) | 20% (7%–37%) | 15% (4%–32%) | 1.4 (0.9–2.3) | 1.2 (0.8–1.9) | 1.4 (0.9–2.3) | ||||||||
Socioeconomic status | |||||||||||||||
Relatively advantaged | 617 (52%) | 49% (45%–53%) | 38% (34%–42%) | 33% (29%–37%) | Ref | Ref | Ref | ||||||||
Relatively disadvantaged | 575 (48%) | 45% (41%–49%) | 33% (29%–37%) | 28% (24%–32%) | 1.2 (1.0–1.4) | 1.3 (1.1–1.5) | 1.2 (1.1–1.4) | ||||||||
Area of residence | |||||||||||||||
Major cities | 842 (71%) | 48% (45%–51%) | 36% (33%–40%) | 32% (28%–35%) | Ref | Ref | Ref | ||||||||
Regional–remote | 350 (29%) | 45% (39%–50%) | 33% (28%–39%) | 28% (23%–33%) | 1.2 (1.0–1.3) | 1.2 (1.0–1.4) | 1.2 (1.0–1.4) | ||||||||
ACT = Australian Capital Territory. NT = Northern Territory. * Percentages may not sum to 100% because of rounding. † Adjusted for age at diagnosis, comorbidity score, stage, grade, subtype and presence of ascites. Analysis by state was also adjusted for socioeconomic status and area of residence. ‡ Women with missing stage information were classified as having stage III/IV disease if they met any of the following criteria: macroscopic residual disease; poorly differentiated cancer with no surgery; poorly differentiated cancer of serous subtype. § HR could not be calculated due to violation of proportional hazards assumption. ¶ Weighted score based on the Charlson comorbidity index. ** HR could not be calculated due to incomplete 7-year survival data. †† Estimates are imprecise due to small number of women diagnosed with ovarian cancer in Tasmania in 2005. | |||||||||||||||
3 Conditional survival for all women who survived at least 1–3 years after diagnosis, by age and cancer characteristics
3-year conditional survival (95% CI) | 5-year conditional survival (95% CI) | ||||||||||||||
Years survived after diagnosis | Years survived after diagnosis | ||||||||||||||
Variable | 0 | 1 | 2 | 3 | 0 | 1 | 2 | ||||||||
Overall survival | 47% (44%–50%) | 55% (52%–59%) | 61% (57%–65%) | 68% (64%–72%) | 35% (33%–38%) | 44% (40%–47%) | 53% (49%–57%) | ||||||||
Age (years) | |||||||||||||||
< 50 | 74% (67%–80%) | 75% (67%–81%) | 77% (68%–83%) | 82% (73%–88%) | 62% (54%–70%) | 66% (57%–73%) | 74% (64%–81%) | ||||||||
50–59 | 64% (58%–69%) | 62% (55%–68%) | 65% (57%–71%) | 70% (62%–76%) | 48% (42%–54%) | 50% (43%–56%) | 57% (49%–64%) | ||||||||
60–69 | 53% (47%–59%) | 56% (49%–62%) | 58% (51%–65%) | 63% (54%–71%) | 40% (34%–46%) | 39% (33%–46%) | 47% (40%–55%) | ||||||||
≥ 70 | 25% (21%–29%) | 38% (32%–44%) | 48% (39%–55%) | 58% (47%–67%) | 17% (13%–20%) | 28% (22%–34%) | 38% (30%–47%) | ||||||||
Stage | |||||||||||||||
I | 95% (91%–98%) | 94% (90%–97%) | 89% (82%–93%) | 87% (79%–92%) | 87% (80%–91%) | 84% (76%–89%) | 83% (75%–89%) | ||||||||
II | 88% (77%–94%) | 81% (69%–89%) | 86% (74%–93%) | 89% (77%–95%) | 78% (66%–87%) | 80% (67%–88%) | 86% (74%–93%) | ||||||||
III | 49% (45%–54%) | 45% (41%–50%) | 48% (42%–53%) | 54% (47%–60%) | 31% (27%–36%) | 31% (26%–35%) | 39% (33%–45%) | ||||||||
IV | 20% (15%–27%) | 34% (25%–44%) | 42% (28%–55%) | 56% (37%–72%) | 13% (8%–19%) | 22% (14%–32%) | 30% (18%–43%) | ||||||||
III/IV* | 19% (13%–25%) | 30% (20%–41%) | 46% (31%–60%) | 60% (36%–77%) | 14% (9%–21%) | 23% (14%–35%) | 28% (14%–44%) | ||||||||
Missing | 25% (20%–32%) | 52% (38%–65%) | 65% (46%–79%) | 65% (44%–79%) | 18% (12%–25%) | 40% (26%–54%) | 54% (35%–69%) | ||||||||
Subtype | |||||||||||||||
Serous | 49% (45%–53%) | 49% (44%–53%) | 53% (47%–58%) | 61% (55%–67%) | 34% (30%–38%) | 36% (31%–40%) | 44% (38%–49%) | ||||||||
Mucinous | 58% (45%–69%) | 81% (67%–90%) | 85% (70%–93%) | 85% (68%–94%) | 53% (41%–64%) | 71% (55%–82%) | 76% (59%–87%) | ||||||||
Endometrioid | 84% (75%–90%) | 83% (74%–90%) | 84% (75%–91%) | 85% (75%–91%) | 75% (65%–82%) | 76% (65%–84%) | 76% (65%–85%) | ||||||||
Clear cell | 68% (58%–76%) | 71% (60%–79%) | 74% (62%–83%) | 75% (61%–84%) | 55% (44%–64%) | 58% (46%–69%) | 69% (55%–79%) | ||||||||
Carcinosarcoma | 27% (12%–45%) | 26% (10%–47%) | 29% (9%–52%) | 57% (17%–84%) | 16% (5%–32%) | 21% (7%–41%) | 29% (9%–52%) | ||||||||
* Women with missing stage information were classified as having stage III/IV disease if they met any of the following criteria: macroscopic residual disease; poorly differentiated cancer with no surgery; poorly differentiated cancer of serous subtype. | |||||||||||||||
4 Five-year relative survival in selected OECD countries for women diagnosed with ovarian cancer in the period 2003–2008
Country | 5-year relative survival | ||||||||||||||
Australia1 | 43% | ||||||||||||||
United States10 | 44% | ||||||||||||||
England11 | 43% | ||||||||||||||
Canada12 | 45% | ||||||||||||||
Japan13 | 55% | ||||||||||||||
Denmark14 | 37% | ||||||||||||||
Sweden14 | 45% | ||||||||||||||
OECD = Organisation for Economic Co-operation and Development. | |||||||||||||||
Received 30 January 2014, accepted 27 June 2014
- Satyamurthy Anuradha1
- Penelope M Webb1
- Penny Blomfield2
- Alison H Brand3
- Michael Friedlander4
- Yee Leung5
- Andreas Obermair6
- Martin K Oehler7
- Michael Quinn8
- Christopher Steer9
- Susan J Jordan1
- 1 Gynaecological Cancers Group, QIMR Berghofer Medical Research Institute, Brisbane, QLD.
- 2 Gynaecologic Oncology, Royal Hobart Hospital, Hobart, TAS.
- 3 Department of Gynaecological Oncology, Westmead Hospital, University of Sydney, Sydney, NSW.
- 4 Department of Medical Oncology, Prince of Wales Hospital, Sydney, NSW.
- 5 School of Women's and Infants' Health, University of Western Australia, Perth, WA.
- 6 Department of Gynaecological Oncology, Royal Brisbane and Women's Hospital, Brisbane, QLD.
- 7 Department of Gynaecological Oncology, Royal Adelaide Hospital, Adelaide, SA.
- 8 Department of Obstetrics and Gynaecology, University of Melbourne, Melbourne, VIC.
- 9 Border Medical Oncology, Wodonga, NSW.
This work was supported by Cancer Australia (formerly National Breast and Ovarian Cancer Centre). Collection of clinical data from the Australian Ovarian Cancer Study was funded by the National Health and Medical Research Council (NHMRC) (400281, 400413); Cancer Councils of Victoria, Queensland, New South Wales, South Australia and Tasmania; and the Cancer Foundation of Western Australia. Susan Jordan and Penelope Webb are funded by fellowships from the NHMRC. We acknowledge the members of the Patterns of Care Study Group; and the research nurses and associated staff for assistance with data collection. We also acknowledge the Australian Ovarian Cancer Study Group for providing clinical information for women who participated in that study. Full membership of the Australian Ovarian Cancer Study Group is listed at http://www.aocstudy.org.
No relevant disclosures.
- 1. Australian Institute of Health and Welfare, Cancer Australia. Gynaecological cancers in Australia: an overview. Canberra: AIHW, 2012. (AIHW Cat. No. CAN 66; Cancer Series No. 70.) http://www.aihw.gov.au/publication-detail/?id=10737422954 (accessed Apr 2014).
- 2. Laurvick CL, Semmens JB, Holman CD, Leung YC. Ovarian cancer in Western Australia (1982–98): incidence, mortality and survival. Aust N Z J Public Health 2003; 27: 588-595.
- 3. Grossi M, Quinn MA, Thursfield VJ, et al. Ovarian cancer: patterns of care in Victoria during 1993–1995. Med J Aust 2002; 177: 11-16. <MJA full text>
- 4. Choi M, Fuller CD, Thomas CR Jr, Wang SJ. Conditional survival in ovarian cancer: results from the SEER dataset 1988–2001. Gynecol Oncol 2008; 109: 203-209.
- 5. Jordan S, Steer C, DeFazio A, et al. Patterns of chemotherapy treatment for women with invasive epithelial ovarian cancer -- a population-based study. Gynecol Oncol 2013; 129: 310-317.
- 6. Australian Institute of Health and Welfare. Rural, regional and remote health: a guide to remoteness classification. Canberra: AIHW, 2004. (AIHW Cat. No. PHE 53; Rural Health Series No. 4.) http://www.aihw.gov.au/publication-detail/?id=6442467589 (accessed Apr 2014).
- 7. Australian Bureau of Statistics. Information paper: census of population and housing. Socio-Economic Indexes for Areas, Australia 2001. Canberra: ABS, 2003. (ABS Cat. No. 2039.0.) http://www.abs.gov.au/AUSSTATS/abs@.nsf/DetailsPage/2039.02001?OpenDocument (accessed May 2014).
- 8. Charlson ME, Pompei P, Ales KL, MacKenzie CR. A new method of classifying prognostic comorbidity in longitudinal studies: development and validation. J Chronic Dis 1987; 40: 373-383.
- 9. Merritt MA, Green AC, Nagle CM, Webb PM; Australian Cancer Study (Ovarian Cancer); Australian Ovarian Cancer Study Group. Talcum powder, chronic pelvic inflammation and NSAIDs in relation to risk of epithelial ovarian cancer. Int J Cancer 2008; 122: 170-176.
- 10. Siegel R, Naishadham D, Jemal A. Cancer statistics, 2012. CA Cancer J Clin 2012; 62: 10-29.
- 11. Office for National Statistics. Cancer survival rates, cancer survival in England, patients diagnosed 2005–2009 and followed up to 2010. London: ONS, 2011. http://www.ons.gov.uk/ons/publications/re-reference-tables.html?edition=tcm%3A77-239726 (accessed May 2014).
- 12. Canadian Cancer Society's Advisory Committee on Cancer Statistics. Canadian cancer statistics 2013. Toronto: Canadian Cancer Society, 2013. http://www.cancer.ca/~/media/cancer.ca/CW/cancer%20information/cancer%20101/Canadian%20cancer%20statistics/canadian-cancer-statistics-2013-EN.pdf (accessed Jun 2014).
- 13. Monitoring of cancer incidence in Japan – survival 2003-2005 report. Tokyo: Center for Cancer Control and Information Services, National Cancer Center, 2013. http://ganjoho.jp/pro/statistics/en/table_download.html (accessed Jun 2014).
- 14. Engholm G, Ferlay J, Christensen N, et al. NORDCAN: cancer incidence, mortality, prevalence and survival in the Nordic countries. Version 6.1 (25.04.2014). Copenhagen: Association of the Nordic Cancer Registries, Danish Cancer Society 2014. http://www.ancr.nu (accessed May 2014).
- 15. O'Malley CD, Cress RD, Campleman SL, Leiserowitz GS. Survival of Californian women with epithelial ovarian cancer, 1994-1996: a population-based study. Gynecol Oncol 2003; 91: 608-615.
- 16. Tingulstad S, Skjeldestad FE, Halvorsen TB, Hagen B. Survival and prognostic factors in patients with ovarian cancer. Obstet Gynecol 2003; 101 (5 Pt 1): 885-891.
- 17. Yang L, Klint A, Lambe M, et al. Predictors of ovarian cancer survival: a population-based prospective study in Sweden. Int J Cancer 2008; 123: 672-679.
- 18. Shimizu Y, Kamoi S, Amada S, et al. Toward the development of a universal grading system for ovarian epithelial carcinoma: testing of a proposed system in a series of 461 patients with uniform treatment and follow-up. Cancer 1998; 82: 893-901.
- 19. Rauh-Hain JA, Diver EJ, Clemmer JT, et al. Carcinosarcoma of the ovary compared to papillary serous ovarian carcinoma: a SEER analysis. Gynecol Oncol 2013; 131: 46-51.
- 20. Brown E, Stewart M, Rye T, et al. Carcinosarcoma of the ovary: 19 years of prospective data from a single center. Cancer 2004; 100: 2148-2153.
- 21. Chan JK, Teoh D, Hu JM, et al. Do clear cell ovarian carcinomas have poorer prognosis compared to other epithelial cell types? A study of 1411 clear cell ovarian cancers. Gynecol Oncol 2008; 109: 370-376.
- 22. Pignata S, Ferrandina G, Scarfone G, et al. Activity of chemotherapy in mucinous ovarian cancer with a recurrence free interval of more than 6 months: results from the SOCRATES retrospective study. BMC Cancer 2008; 8: 252.
- 23. Puls LE, Duniho T, Hunter JE, et al. The prognostic implication of ascites in advanced-stage ovarian cancer. Gynecol Oncol 1996; 61: 109-112.
- 24. Tetsche MS, Nørgaard M, Jacobsen J, et al. Comorbidity and ovarian cancer survival in Denmark, 1995-2005: a population-based cohort study. Int J Gynecol Cancer 2008; 18: 421-427.
- 25. Maas HA, Kruitwagen RF, Lemmens VE, et al. The influence of age and co-morbidity on treatment and prognosis of ovarian cancer: a population-based study. Gynecol Oncol 2005; 97: 104-109.
- 26. Coory MD, Ho T, Jordan SJ. Australia is continuing to make progress against cancer, but the regional and remote disadvantage remains. Med J Aust 2013; 199: 605-608. <MJA full text>
- 27. Australian Institute of Health and Welfare, Australasian Association of Cancer Registries. Cancer survival in Australia 1992–1997: geographic categories and socioeconomic status. Canberra: AIHW, 2003. (AIHW Cat. No. CAN 17; Cancer Series No. 22.) http://www.aihw.gov.au/publication-detail/?id=6442467451 (accessed Apr 2014).
Abstract
Objective: To describe survival patterns in a nationally complete cohort of Australian women with epithelial ovarian cancer, by sociodemographic and clinical factors.
Design, setting and participants: All 1192 women diagnosed with invasive epithelial ovarian cancer in 2005 were identified through state-based cancer registries. We obtained detailed information from their medical records in 2009 and updated survival data in 2012.
Main outcome measures: Crude 3-year, 5-year and 7-year survival rates; 3-year and 5-year conditional survival; and hazard ratios (HRs) for the association of participant and cancer characteristics with survival, from multivariable Cox proportional hazards models.
Results: Overall crude 5-year survival was 35% (95% CI, 33%–38%). Conditional survival increased moderately for women who lived beyond a year from diagnosis, although for women alive 2 years after diagnosis, the probability of surviving a further 5 years was still only 53% (95% CI, 49%–57%). Increasing age and disease stage were most strongly associated with poor survival. After adjusting for these, survival was significantly worse for women with carcinosarcomas (HRadj, 2.1 [95% CI, 1.3–3.2]), clear cell (HRadj, 1.7 [95% CI, 1.2–2.3]) and mucinous (HRadj, 2.6 [95% CI, 1.6–4.0]) cancers than for women with serous cancers. Presence of ascites at diagnosis (HRadj, 1.5 [95% CI, 1.3–1.8]), Charlson comorbidity score ≥ 3 (HRadj, 1.5 [95% CI, 1.1–2.1]), relative socioeconomic disadvantage (HRadj, 1.2 [95% CI, 1.1–1.4]) and regional–remote residence (HRadj, 1.2 [95% CI, 1.0–1.4]) were also associated with poorer survival.
Conclusions: Along with expected adverse effects of age and stage, we found survival differences by histological subtype, presence of ascites and comorbidities. Whether geographic and socioeconomic differences relate to treatment access or other factors warrants further investigation. Conditional survival estimates confirm the ongoing poor long-term prognosis for women with ovarian cancer, reinforcing the need for prevention and better treatments.