


In New South Wales, significant health services are devoted to neonatal and infant health, with total costs per year for neonatal and infant hospital admissions estimated at about $380 million.1 Analysis of the trends in health services utilisation can lead to improvements in health service delivery and efficient allocation of health care resources; however, trends in infant hospital readmissions have not been investigated. Over the past decade, there has been an increase in births in Australia2 and changes in the frequency of maternal and birth risk factors associated with infant readmissions,1 including a decrease in the proportion of young mothers, a decrease in mothers who smoke and a gradual shift to planned births at earlier gestations.3 The aim of this study was to examine the trends in hospital readmissions in the first year of life and to investigate whether changes in the frequency of maternal and infant risk factors affected infant hospital readmissions at a population level.
Methods
Study population and data sources
The study population included all live births in NSW from 1 January 2001 through 31 December 2009. Data were obtained from two linked population health databases. Births were obtained from the NSW Perinatal Data Collection (PDC), a legislated population-based surveillance system of all births in NSW of ≥ 20 weeks' gestation or where the baby has a birthweight of ≥ 400 g. Infant hospitalisations were obtained from the Admitted Patient Data Collection (APDC), an administrative database of all public and private hospital admissions in NSW. The two databases, the PDC and APDC, were linked by the Centre for Health Record Linkage using probabilistic linkage. The proportion of missing data was small (0.02% of gestational age, 0.02% of maternal age and 0.06% of marital status data).
Study outcome
The study outcome was the number of infants readmitted to hospital at least once after discharge home from the birth admission to 1 year of age, per 100 live births each year. Interhospital transfers were included as part of the admission in which they occurred. Hospital admissions for routine circumcision were excluded as a NSW Health policy introduced during the study period directed circumcisions away from public hospitals to private hospitals and day clinics.
Explanatory variables
Explanatory variables available for analysis were identified from a previous study and included maternal age, previous pregnancy history, maternal smoking, hospital type at birth, baby's length of stay at birth admission, gestational age, birth order, multiple births, severe neonatal morbidity and residential postcode,1 which were all obtained from the PDC. Maternal marital status was obtained from the mother's APDC record. Maternal residential postcode was used to determine socioeconomic status (SES) and geographical region of residence. SES was derived based on scores from the Socio-Economic Indexes for Areas Index of Relative Socio-Economic Disadvantage produced by the Australian Bureau of Statistics4 and categorised into low SES (< 20th percentile), average SES (20–80th percentile) and high SES (≥ 80th percentile). Geographical area of residence was based on the Accessibility/Remoteness Index of Australia and divided into major cities and regional and remote areas.5 Severe neonatal morbidity was determined using the Neonatal Adverse Outcome Indicator.6
Data analysis
We compared the rate of infants admitted per 100 births in 2001 through 2009 for each of the maternal and infant risk factors of interest and for the most common principal diagnoses. Negative binomial regression was then used to estimate the annual percentage change in total readmission rates, and rates for each risk factor and for each condition.
Logistic regression models were developed using data from the start (infants born during 2001 and 2002) and the end of the study period (infants born during 2009) to compare changes in the risk of readmission over time. Due to significant interactions, gestational age was combined with severe neonatal morbidity as one variable, and socioeconomic status was combined with geographical area. To estimate whether changes in the frequency of risk factors over time can explain changes in infant readmission rates, the predictive logistic regression model for infants born during 2001 and 2002 was applied to each subsequent year's data to determine the predicted number of infants admitted to hospital in each year.1 If the predicted number of admissions was similar to the number observed, then this would suggest that the change in infant readmissions could be accounted for by changes in prevalence of risk factors. Conversely, any difference between the observed and predicted numbers would be caused by factors not included in the model.
This study was approved by the NSW Population and Health Services Research Ethics Committee.
Results
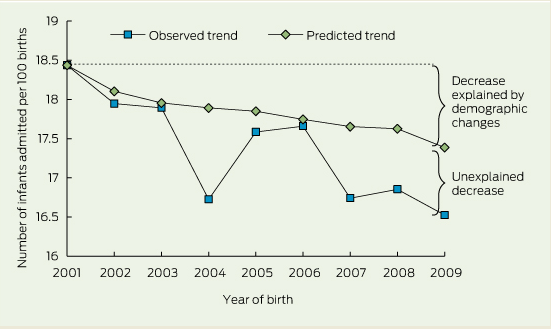
From 2001 to 2009, there were 788 798 live-born infants in NSW with a linked PDC and APDC record. Over the 9-year study period, the number of infants readmitted to hospital up to the age of 1 year decreased from 18.4 per 100 births in 2001 to 16.5 per 100 births in 2009 (Box 1), a relative reduction of 10.5% (average annual reduction of 1.8%; 95% CI, − 1.7% to − 0.01%; P = 0.001). The readmission rate decreased sharply from 2003 to 2004, followed by a substantial increase in 2005 (Box 1).
Over the study period, the proportion of infants born to mothers over the age of 35 years increased from 18% to 24%, and the proportion of infants born to mothers who smoked decreased from 17% to 12%. There was also a shift to shorter stays in hospital at birth; the proportion of infants discharged in the first 2 days after birth increased from 28% to 36%, and the proportion of infants staying 5 days or more decreased from 33% to 23%.
The proportion of infants readmitted to hospital for each maternal and infant characteristic in 2001 and 2009, the average annual percentage change in the readmission rate and adjusted odds ratios for hospital readmission at the start and the end of the study period are shown in Box 2. The factors most strongly associated with hospital readmission did not change over the study period. These were maternal age less than 25 years, maternal smoking, length of stay at birth of 5 days or more, and infants born before 39 weeks' gestation (Box 2).
When the predictive model using data for infants born in 2001 and 2002 (Box 2) was applied to the following years' data, the predicted rate of hospital readmission decreased from the observed rate of 18.4 infants per 100 births, to an expected rate of 17.4 infants per 100 births admitted in 2009 (Box 1). Changes in the frequency of risk factors, predominantly the length of stay in the birth admission, maternal age and maternal smoking, explained 55% of the decrease in infant readmissions.
The most commonly diagnosed conditions that had a significant decrease in the rate of readmissions over the study period were upper respiratory tract infections (− 1.6% per year; 95% CI, − 2.8% to − 0.3% per year), intestinal infectious diseases (− 3.2% per year; 95% CI, − 9.3% to − 0.5% per year) and viral infections (− 3.2% per year; 95% CI, − 5.4% to − 1.0% per year). There was a significant increase in hospital readmissions for jaundice (8.1% per year; 95% CI, 5.9% to 10.3% per year) and feeding problems (3.5% per year; 95% CI, 1.0% to 5.6% per year).
Discussion
On average, over the study period, one in six infants were readmitted to hospital in the first year of life, but there was a relative reduction in the infant readmission rate of 10.5% from 2001 to 2009. Factors associated with infant hospital readmissions include maternal smoking, maternal age less than 25 years, gestational age less than 39 weeks and longer hospital stay at birth. Over half of the total decrease can be explained by changes in the frequency of maternal and infant risk factors, predominantly a decrease in the length of stay in hospital at birth, an increase in maternal age and a decrease in maternal smoking.
The decline in infant hospital admissions can be attributed to changes in maternal risk factors and more global policy changes, both of which can influence one another. Maternal smoking rates have been declining over the past 15 years in Australia.7 Older mothers are less likely to smoke during pregnancy, while mothers who attend antenatal care earlier in their pregnancy are more likely to stop smoking.8 Early antenatal visits were highlighted as a priority area for NSW Health policy in 2003,9 with the proportion of women attending antenatal care before 14 weeks' gestation increasing from around 62% in 2003 to almost 80% in 2010.10
During the study period, there was an overall shift to shorter lengths of stay in hospital during the birth admission. This may be due to a combination of improvements in maternal and neonatal care and policy changes. In NSW, one of the potential driving forces behind the increase in proportion of infants discharged in the first 2 days is the Early Postnatal Discharge program, introduced in the 1980s and, more recently, the Midwifery Support Program, offering mothers midwifery support at home after early discharge. A large body of research has examined the impacts of early postnatal discharge with conflicting results;11-14 however, follow-up home visits may reduce hospital readmissions.15 There was also a decrease in the proportion of infants with a length of stay greater than 5 days. This may be attributable to improvements in technology and/or changes in clinical practice which may have led to more effective treatment in these infants, reducing their risk of readmission.
We found that rates of admission for jaundice and feeding difficulties increased over the study period. It has been shown that admissions to hospital for these conditions are associated with early discharge from hospital.16 There has also been a gradual increase in the rate of infants born late preterm (34–36 weeks) and early term (37–38 weeks) in Australia in the past decade,3 and these infants have an increased risk of admission to hospital for jaundice and feeding difficulties.16
Availability of non-hospital forms of health care can also impact hospital admissions. Although we do not have access to emergency department (ED) data, there were a number of changes to ED policy and practice in NSW over this period that may have reduced hospital admissions from the ED. These included introducing additional senior ED nurses who had a wider scope of practice17 and opening after-hours general practice clinics at or near EDs,18 with a recent study showing that such clinics were associated with a reduction in low-urgency presentations to the ED.19
One of the interesting findings from our study was a significant decrease in the observed rate of infants admitted to hospital in 2004, followed by an increase in 2005 and 2006. The decrease in the readmission rate in 2004 could not be attributed to changes in reporting, changes in admissions at specific hospitals or by diagnosis type. However a number of policies were introduced before 2004 that may have decreased infant admissions. The large increase in 2005 appears to coincide with a large increase in the number of births in NSW after the introduction of the national “Baby Bonus” policy in July 2004.2 This large, unplanned increase in births put added pressure on maternity services20 and would have subsequently placed an additional burden on non-hospital forms of health care, possibly leading infants back to hospital EDs.
The main strength of the study is the use of a large linked population health database that allows trends in infant hospitalisations to be examined at a population level. This information is known to be accurate and reliable with validation studies showing high levels of agreement with medical records.21 However, one of the main limitations was the lack of individual-level data about breastfeeding status and other health service use, such as postnatal home visits, general practitioner visits, ED presentations and hospital bed availability. However, a recent state health report highlights that the average number of general hospital beds in NSW increased by about 20% over the study period.22
We have shown that the rate of infants readmitted to hospital each year has been decreasing in NSW, and changing maternal and infant risk factors, particularly the shift to shorter stays during the birth admission, increasing maternal age and decreasing rates of maternal smoking, can explain over half of this decrease. Future research should investigate strategies for further reducing the burden on the health system of infant admissions, particularly those that may be prevented, such as strategies targeting specific groups of infants.
2 Proportion of infants born in 2001–2002 and 2009 readmitted to a New South Wales hospital, and multivariate analysis of infants readmitted to hospital at least once up to age 1 year by maternal and infant characteristic
Characteristics | Proportion of infants readmitted, 2001 | Proportion of infants readmitted, 2009 | Average annual % change in rate, 2001–2009 (95% CI) | Adjusted OR* 2001–2002 (95% CI) | Adjusted OR* 2009 (95% CI) | ||||||||||
Maternal age group | |||||||||||||||
< 20 years | 26.9% | 23.4% | − 1.3% (− 2.2% to − 0.4%)† | 1.47 (1.37–1.56) | 1.46 (1.33–1.61) | ||||||||||
20–24 years | 21.3% | 19.1% | − 1.3% (− 1.9% to − 0.7%)† | 1.16 (1.11–1.21) | 1.16 (1.09–1.23) | ||||||||||
25–29 years | 18.9% | 16.4% | − 1.3% (− 2.0% to − 0.5%)† | ‡ | ‡ | ||||||||||
30–34 years | 16.6% | 15.5% | − 0.9% (− 1.4% to − 0.4%)† | 0.87 (0.84–0.90) | 0.93 (0.88–0.97) | ||||||||||
≥ 35 years | 16.4% | 15.5% | − 0.7% (− 1.2% to − 0.1%) | 0.81 (0.78–0.85) | 0.88 (0.84–0.92) | ||||||||||
Hospital type at birth | |||||||||||||||
Public hospital | 18.9% | 17.1% | − 1.0% (− 1.6% to − 0.5%)† | ‡ | ‡ | ||||||||||
Private hospital | 16.9% | 14.7% | − 1.6% (− 2.7% to − 1.1%)† | 0.94 (0.91–0.97) | 0.88 (0.84–0.92) | ||||||||||
Length of stay at birth | |||||||||||||||
0–2 days | 16.6% | 15.7% | − 0.5% (− 1.3% to 0.3%) | 0.87 (0.84–0.90) | 0.96 (0.92–1.00) | ||||||||||
3–4 days | 16.9% | 14.9% | − 1.3% (− 1.7% to − 0.8%)† | ‡ | ‡ | ||||||||||
5 days or more | 21.8% | 20.5% | − 0.6% (− 1.1% to 0.0%) | 1.28 (1.25–1.32) | 1.28 (1.22–1.35) | ||||||||||
Maternal smoking status | |||||||||||||||
Non-smoker | 17.3% | 15.9% | − 1.0% (− 1.5% to − 0.4%)† | ‡ | ‡ | ||||||||||
Smoker | 23.9% | 21.2% | − 1.2% (− 1.9% to − 0.5%)† | 1.27 (1.23–1.32) | 1.22 (1.15–1.28) | ||||||||||
Geographical area and SES | |||||||||||||||
Major cities, low SES | 19.1% | 18.4% | − 0.9% (− 2.0 to 0.2%) | 1.04 (0.99–1.09) | 1.03 (0.97–1.09) | ||||||||||
Major cities, average SES | 18.3% | 17.0% | − 1.1% (− 1.6% to − 0.6%)† | ‡ | ‡ | ||||||||||
Major cities, high SES | 17.4% | 15.4% | − 1.6% (− 2.2% to − 0.9%)† | 1.05 (1.00–1.09) | 0.98 (0.93–1.03) | ||||||||||
Regional and remote, low SES | 20.7% | 17.1% | − 1.7% (− 2.5% to − 1.0%)† | 0.96 (0.92–1.00) | 0.87 (0.82–0.93) | ||||||||||
Regional and remote, average SES | 17.8% | 16.0% | − 0.7% (− 1.4% to 0.1%) | 0.88 (0.85–0.91) | 0.88 (0.84–0.93) | ||||||||||
Regional and remote, high SES | 18.4% | 14.8% | − 2.0% (− 3.3% to − 0.8%)† | 1.02 (0.96–1.09) | 0.93 (0.85–1.03) | ||||||||||
Marital status | |||||||||||||||
Married or de facto | 17.4% | 15.8% | − 1.0% (− 1.5% to − 0.4%)† | ‡ | ‡ | ||||||||||
Not married | 22.1% | 20.3% | − 1.2% (− 1.8% to − 0.7%)† | 1.14 (1.10–1.18) | 1.17 (1.11–1.23) | ||||||||||
Severe neonatal morbidity;§ and gestational age | |||||||||||||||
With morbidity; ≤ 33 weeks | 38.7% | 35.7 | − 0.8% (− 2.0% to 0.5%) | 2.29 (2.10–2.51) | 2.51 (2.24–2.83) | ||||||||||
With morbidity; 34–36 weeks | 34.7% | 29.9 | − 1.4% (− 3.3% to 0.6%) | 2.06 (1.79–2.38) | 1.94 (1.63–2.32) | ||||||||||
With morbidity; 37–38 weeks | 34.5% | 27.9 | − 3.3% (− 5.4% to − 1.3%)† | 2.39 (2.06–2.78) | 1.91 (1.59–2.27) | ||||||||||
With morbidity; 39–41 weeks | 30.0% | 25.3 | − 3.2% (− 5.1% to − 1.3%)† | 1.82 (1.63–2.04) | 1.82 (1.59–2.07) | ||||||||||
With morbidity; > 41 weeks | 33.3% | 24.1 | − 2.3% (− 12.0% to 7.4%) | 1.73 (1.05–2.85) | 1.79 (0.76–4.21) | ||||||||||
No morbidity; ≤ 33 weeks | 27.9% | 26.5 | − 1.5 (− 3.9% to 0.8%) | 1.71 (1.47–1.99) | 1.60 (1.28–2.01) | ||||||||||
No morbidity; 34–36 weeks | 27.4% | 24.6% | − 0.8% (1.6% to 0.1%) | 1.52 (1.44–1.62) | 1.59 (1.49–1.73) | ||||||||||
No morbidity; 37–38 weeks | 20.7% | 18.0% | − 1.3% (− 1.9% to − 0.7%)† | 1.24 (1.20–1.28) | 1.25 (1.20–1.31) | ||||||||||
No morbidity; 39–41 weeks | 16.5% | 14.6% | − 1.4% (− 2.0% to − 0.9%)† | ‡ | ‡ | ||||||||||
No morbidity; > 41 weeks | 15.6% | 15.3% | − 2.1% (− 4.1% to − 0.1%) | 0.91 (0.83–1.00) | 1.07 (0.87–1.31) | ||||||||||
Birth order | |||||||||||||||
First born | 18.0% | 16.1% | − 1.3% (− 1.9% to − 0.7%)† | ‡ | ‡ | ||||||||||
Second born or higher | 18.7% | 16.8% | − 1.1% (− 1.7% to − 0.6%)† | 1.19 (1.16–1.22) | 1.18 (1.13–1.22) | ||||||||||
Single or multiple pregnancy | |||||||||||||||
Singleton | 18.1% | 16.3% | − 1.1% (− 1.7% to − 0.6%)† | ‡ | ‡ | ||||||||||
Twins or triplets | 27.9% | 25.7% | − 1.3% (− 2.2% to − 0.3%)† | 1.20 (1.12–1.28) | 1.14 (1.04–1.25) | ||||||||||
OR = odds ratio. SES = socioeconomic status. * Adjusted for all variables in tables. † Statistically significant reduction in readmission rate (P <0.01). ‡ Reference category. § Determined with Neonatal Adverse Outcome Indicator.6 | |||||||||||||||
Received 9 October 2013, accepted 8 January 2014
- Samantha J Lain1
- Christine L Roberts1
- Jennifer R Bowen2,3
- Natasha Nassar1
- 1 Clinical and Population Perinatal Health Research, Kolling Institute of Medical Research, University of Sydney, Sydney, NSW.
- 2 Royal North Shore Hospital, Sydney, NSW.
- 3 Sydney Medical School, University of Sydney, Sydney, NSW.
Linkage was funded through a National Health and Medical Research Council (NHMRC) project grant (457302). Samantha Lain is supported by an NHMRC Post-graduate Scholarship (571227) and a Capacity Building Grant (573122). Natasha Nassar is supported by an NHMRC Career Development Award (632955). Christine Roberts is supported by an NHMRC Senior Research Fellowship (1021025). We thank the NSW Department of Health for access to the population health data and the NSW Centre for Health Record Linkage for linking the data sets.
No relevant disclosures.
- 1. Lain SJ, Nassar N, Bowen JR, Roberts CL. Risk factors and costs of hospital admissions in first year of life: a population-based study. J Pediatr 2013; 163: 1014-1019.
- 2. Lain SJ, Ford JB, Raynes-Greenow CH, et al. The impact of the Baby Bonus payment in New South Wales: who is having “one for the country”? Med J Aust 2009; 190: 238-241. <MJA full text>
- 3. Morris JM, Algert CS, Falster MO, et al. Trends in planned early birth: a population-based study. Am J Obstet Gynecol 2012; 207: 186 e1-e8.
- 4. Australian Bureau of Statistics. Census of Population and Housing Socio-Economic Indexes for Areas, Australia 2001. Information Paper. Canberra: ABS, 2003. (ABS Cat No. 2039.0.) http://www.ausstats.abs.gov.au/ausstats/free.nsf/0/AFF5E8542B58B94ECA256DD5007A3DF8/$File/20390_2001.pdf (accessed Dec 2013).
- 5. Australian Institute of Health and Welfare. Rural, regional and remote health: a guide to remoteness classification. Canberra: AIHW, 2004. (AIHW Cat. No. PHE 53; Rural Health Series No. 4.) http://www.aihw.gov.au/publications/index.cfm/title/9993 (accessed Dec 2013).
- 6. Lain SJ, Algert CS, Nassar N, et al. Incidence of severe adverse neonatal outcomes: use of a composite indicator in a population cohort. Matern Child Health J 2012; 16: 600-608.
- 7. NSW Department of Health. New South Wales mothers and babies 2000. Sydney: NSW Health, 2001. http://www0.health.nsw.gov.au/pubs/2001/pdf/mdc00.pdf (accessed Dec 2013).
- 8. Mohsin M, Bauman AE. Socio-demographic factors associated with smoking and smoking cessation among 426,344 pregnant women in New South Wales, Australia. BMC Public Health 2005; 5: 138.
- 9. NSW Department of Health. NSW Health system performance indicators, August 2003. Sydney: NSW Health, 2003. http://www0.health.nsw.gov.au/pubs/2003/pdf/indicators.pdf (accessed Dec 2013).
- 10. NSW Department of Health. Health Statistics New South Wales. Antenatal care: first antenatal visit by gestational age, NSW, 1994 to 2010. Sydney: NSW Health, 2011.
- 11. Brown S, Small R, Faber B, et al. Early postnatal discharge from hospital for healthy mothers and term infants. Cochrane Database Syst Rev 2002; (3): CD002958.
- 12. Danielsen B, Castles AG, Damberg CL, Gould JB. Newborn discharge timing and readmissions: California, 1992-1995. Pediatrics 2000; 106(1 Pt 1): 31-39.
- 13. Lee KS, Perlman M, Ballantyne M, et al. Association between duration of neonatal hospital stay and readmission rate. J Pediatr 1995; 127: 758-766.
- 14. Oddie SJ, Hammal D, Richmond S, Parker L. Early discharge and readmission to hospital in the first month of life in the Northern Region of the UK during 1998: a case cohort study. Arch Dis Child 2005; 90: 119-124.
- 15. Meara E, Kotagal UR, Atherton HD, Lieu TA. Impact of early newborn discharge legislation and early follow-up visits on infant outcomes in a state Medicaid population. Pediatrics 2004; 113: 1619-1627.
- 16. Maisels MJ, Kring E. Length of stay, jaundice, and hospital readmission. Pediatrics 1998; 101: 995-998.
- 17. Hudson PV, Marshal AP. Extending the nursing role in emergency departments: challenges for Australia. Australas Emerg Nurs J 2008; 11: 39-48.
- 18. Haas M. After-hours GP clinics in emergency departments. Health Policy Monitor 2007; March. http://www.hpm.org/en/Surveys/CHERE_-_Australia/09/After-Hours_GP_Clinics_in_Emergency_Departments.html (accessed May 2014).
- 19. Buckley DJ, Curtis PW, McGirr JG. The effect of a general practice after-hours clinic on emergency department presentations: a regression time series analysis. Med J Aust 2010; 192: 448-451. <MJA full text>
- 20. Lain SJ, Roberts CL, Raynes-Greenow CH, Morris J. The impact of the baby bonus on maternity services in New South Wales. Aust N Z J Obstet Gynaecol 2010; 50: 25-29.
- 21. Lain SJ, Hadfield RM, Raynes-Greenow CH, et al. Quality of data in perinatal population health databases: a systematic review. Med Care 2012; 50: e7-e20.
- 22. NSW Department of Health. Annual Report 2009-10. Sydney: NSW Health, 2010. http://www0.health.nsw.gov.au/pubs/2010/pdf/annualreport10.pdf (accessed Dec 2013).
Abstract
Objective: To examine the trends in hospital readmissions in the first year of life and identify whether changes in maternal and infant risk factors explain any changes.
Design: Population-based study using de-identified linked health data.
Participants: All 788 798 live-born infants delivered in New South Wales from 1 January 2001 to 31 December 2009 with a linked birth and hospital record.
Main outcome measures: The number of infants readmitted to hospital at least once after discharge home from the birth admission to 1 year of age, per 100 live births each year, and changes in maternal and infant risk factors assessed by logistic regression.
Results: The number of infants readmitted to hospital up to age 1 year decreased by 10.5% (average annual reduction, 1.8%; 95% CI, − 1.7% to − 0.01%, P = 0.001), from 18.4 per 100 births in 2001 to 16.5 in 2009. Fifty-five per cent of this decrease could be explained by changes in factors that are associated with likelihood of hospitalisation; length of stay during the birth admission, maternal age and maternal smoking. The rate of readmissions for jaundice and feeding difficulties increased significantly over the study period, while readmissions for infections decreased.
Conclusions: There has been a decrease in the rate of infants readmitted to hospital in the first year of life, which can be partly explained by increasing maternal age, decreasing maternal smoking and a shift to shorter length of hospital stay at birth. Improved maternal and neonatal care in hospital and increased postnatal support at home may have contributed to reduced risk of readmission.