


Survival from oesophagogastric cancer is poor, despite improvements in care. In Australia, 5-year survival is 16% and 27% for people diagnosed with oesophageal and gastric cancer, respectively.1 Oesophagectomy and gastrectomy are potentially curative for early-stage disease. These procedures are complex and international studies have found that higher hospital volume is associated with decreased patient mortality and improved survival outcomes.2-4
Several overseas jurisdictions have aimed to consolidate oesophagectomy and gastrectomy into specialist centres with target surgical caseloads.5-7 This has the potential benefit of not only reducing unwarranted mortality seen in lower-volume centres, but also increasing the number of people offered definitive procedures8 and improving the outcomes of existing higher-volume centres at which surgical volume is further increased.9
To help inform health policy decision making, we examined the relationship between hospital volume and population-level short-term morbidity and mortality and longer-term survival outcomes for patients who underwent oesophagectomy or gastrectomy for oesophagogastric cancer in New South Wales between 2001 and 2008 using linked cancer notification and hospital admissions data.
We conducted a retrospective, population-based cohort study using linked de-identified data from the NSW Central Cancer Registry (CCR) and NSW Admitted Patient Data Collection (APDC). The CCR records mandatory notifications of cancer cases diagnosed in NSW residents and is linked to the National Death Index. The APDC records all public and private hospital admissions in NSW. The Centre for Health Record Linkage linked the data using probabilistic, privacy-preserving methods with ethics approval from the NSW Population and Health Services Research Ethics Committee (HREC/09/CIPHS/23).
Each person’s sex, cancer site, tumour histology, extent of cancer spread (furthest extent within 4 months of diagnosis)10 and area-based socioeconomic status (using the Index of Relative Socio-economic Disadvantage11) were obtained from CCR records. Age at admission, urgency of admission, hospital type and Charlson comorbidity score12 were obtained from APDC resection admission records. Charlson comorbidity score was calculated using diagnoses recorded in the index admission, excluding oesophagogastric and metastatic cancer. Hospital volume was calculated as the number of relevant procedures (ie, oeso_phagectomy or gastrectomy) in the hospital in the year of each person’s resection. Hospital volume was categorised as lower volume (≤ 6 procedures per year [a similar lower volume category to those used in other studies2,4]) or higher volume (> 6 procedures per year).
Multilevel logistic regression models were estimated for binary outcomes and multilevel Cox proportional hazards models were estimated for survival outcomes. Age, Charlson comorbidity score, extent of cancer spread, urgency of admission, hospital type and year of procedure (known confounders) were included in all models regardless of statistical significance. Sex and, for oesophagectomy, tumour histology were included in all survival models. Other variables were included if the P value for univariate significance was less than 0.25, with backwards elimination based on P values and reduction in Akaike information criterion. A sensitivity analysis was performed, including hospital volume as a continuous variable and excluding hospitals that performed fewer than eight relevant procedures during the study period because small group size with a low-prevalence outcome can inflate error in multilevel logistic regression models.13 Analyses were performed using Stata/MP 12 (StataCorp) and SAS 9.3 (SAS Institute).
From 2000 to 2008, 9618 people were diagnosed with oesophageal or gastric cancer, of whom 20 with multiple cases and 690 with rare tumour types (gastrointestinal stromal, non-solid, neuroendocrine and melanomatous tumours) were excluded. Between 1 July 2000 and 30 June 2009, the linked APDC records included 2801 oeso-phagectomy and gastrectomy admissions. Surgical pathology reports were reviewed for 172 of these to clarify the procedure performed. Of the 2801 admissions, 272 were excluded from our study: 18 were second resections, 16 were for people with a non-cardia gastric primary site who had undergone both gastrectomy and oesophagectomy, and 238 resections were outside the period 2001–2008.
From 2001 to 2008, 908 oeso-phagectomies were performed in a total of 42 NSW hospitals, of which 48.6% (441) were in higher-volume hospitals, and 1621 gastrectomies were performed in a total of 84 NSW hospitals, of which 54.5% (884) were in higher-volume hospitals (Box 1). Gastrectomy patients in higher-volume hospitals were younger (< 65 years: 36.1% v 29.3%; P = 0.01), more likely to have distant spread within 4 months of diagnosis (15.4% v 10.3%; P < 0.001) and less likely to have had the procedure during an emergency admission (13.3% v 17.1%; P = 0.04) than gastrectomy patients in lower-volume hospitals.
Rates of surgical resection for patients with cardio-oesophageal and non-cardia gastric cancer declined from 29.2% (145/496) to 18.7% (115/616) and from 44.5% (199/447) to 37.1% (157/423), respectively, for patients diagnosed between 2001 and 2008 (Appendix 1). For cardio-oesophageal cancer, fewer people who had squamous cell carcinoma underwent resection compared with people who had adenocarcinoma (8.7% [15/172] v 23.9% [93/389] in 2008) (Appendix 3).
Between 101 and 130 oesophagectomies were performed by 22–30 hospitals each year (Appendix 3). Median annual hospital volume ranged from 2 to 4 oesophagectomies, and 4–7 hospitals performed > 6 oesophagectomies per year.
The total number of gastrectomies performed each year decreased from over 200 before 2006 to 171 in 2008 (Appendix 3). The median annual hospital volume ranged from 2 to 3 gastrectomies, and 7 hospitals performed > 6 gastrectomies in 2008 (the lowest number during the study period), and 45–55 hospitals performed gastrectomies each year.
Length of stay was similar in both hospital volume groups: one-third and one-quarter of people stayed in hospital longer than 21 days for oesophagectomy and gastrectomy, respectively (Appendix 4). Overall, about 12% of people had an unplanned readmission within 28 days of discharge for both procedures.
Overall 30-day and 90-day mortality was 4.1% (37/905) and 7.5% (67/891) for oesophagectomy and 4.4% (70/1609) and 9.1% (143/1577) for gastrectomy, respectively. Lower hospital volume was not associated with higher 90-day mortality after oesophagectomy — the unadjusted odds ratio (OR) was 1.27 (95% CI, 0.77–2.09; P = 0.36), and the adjusted OR was 1.42 (95% CI, 0.84–2.39; P = 0.19) (Box 2). In the sensitivity analysis, including hospital volume as a continuous variable and excluding small sample size hospitals, the effect of an increase in one oesophagectomy per year was a 7% decrease in 90-day mortality after oesophagectomy (OR, 0.93 [95% CI, 0.86–1.00]; P = 0.06). Thirty-day mortality after gastrectomy was 5.1% (37/732) in lower-volume hospitals and 3.8% (33/877) in higher-volume hospitals (adjusted OR, 1.37 [95% CI, 0.80–2.33]; P = 0.25).
Oesophagectomy in a lower-volume hospital was associated with significantly lower 5-year absolute survival compared with oesophagectomy in a higher-volume hospital (adjusted hazard ratio [HR] for lower-volume hospitals, 1.28 [95% CI, 1.10–1.49]; P = 0.002) (Box 3, Box 4). The association was almost the same for conditional 5-year survival, in which the effect of perioperative deaths on survival is removed. Overall, there was a non-significant trend for gastrectomy in a higher-volume hospital to be associated with higher 5-year absolute survival compared with gastrectomy in a lower-volume hospital (adjusted HR for lower-volume hospitals, 1.11 [95% CI, 0.95–1.31]; P = 0.19) (Box 3, Box 4). When survival of people who had localised cancer within 4 months of diagnosis was examined for gastrectomy, absolute 5-year survival was significantly lower for those who had surgery in a lower-volume hospital compared with those who had surgery in a higher-volume hospital (adjusted HR for lower-volume hospitals, 1.83 [95% CI, 1.28–2.61]; P = 0.001) (Box 3). The exclusion of patients diagnosed in 2007, for whom follow-up data may not have been complete, did not substantially change the estimated HRs for the survival analyses.
We found evidence of a relationship between hospital volume and patient outcomes for people who underwent oesophagectomy for oesophagogastric cancer in NSW. There was no clear evidence of such a relationship for people who underwent gastrectomy overall, but resection in a higher-volume hospital was associated with significantly improved 5-year survival for people with localised gastric cancer who underwent gastrectomy. These results are consistent with those of international studies, in which the relationship for gastrectomy is weaker than for the more complex oesophagectomy.4,14 Rates of surgical resection for oesophagogastric cancer are decreasing and hospital volumes did not increase during our study period. The median annual number of procedures performed was four or fewer across the 22–30 and 45–55 hospitals performing oesophagectomy and gastrectomy, respectively, each year.
Although our study was population based and covered an 8-year period, it had a small sample size compared with many international studies.4 Sample size, prevalence of the outcome and effect size affect statistical power, and these factors may have limited our ability to detect significant differences, particularly for mortality outcomes. Risk adjustment is important because case complexity and patient characteristics may influence the choice of hospital to which patients are referred. In our study, risk adjustment included measures of tumour extent and comorbidity, as well as sex, age, socioeconomic status, tumour site and histology, urgency of admission and hospital type. Risk adjustment of oesophagectomy mortality outcomes increased the size and decreased the P value of the hospital volume effect, similar to other studies.2 Higher-volume hospitals performed gastrectomy on a larger proportion of patients with distant cancer spread. Clinical cancer stage and measures of comorbidity such as performance status may improve risk adjustment. Incomplete risk adjustment may have left residual confounding and restricted our ability to detect significant differences.
Outcomes for oesophagogastric cancer surgery in NSW are good, despite hospital volumes being low by international standards. Thirty-day mortality of 4.1% and 4.4% for oesophagectomy and gastrectomy, respectively, and 5-year survival of about 40% for both procedures compares well to results from other countries.14-19 Invasive surgery for advanced gastric cancer may be necessary at times, but information on surgical intent (curative or palliative) was not available from our data sources. We therefore included both curative-intent and palliative-intent resections in our study, which affects comparisons of our results with those of studies of curative-intent resections only.
There are no high-volume hospitals in NSW by international standards. For gastrectomy in Europe, one study has shown that lower 30-day mortality is only seen once hospitals perform more than 20 gastrectomies per year for gastric cancer.14 No hospital in NSW reached this volume during the study period, limiting our ability to assess a volume–outcome relationship. Japan has some of the best oesophagectomy mortality outcomes in the world, with an overall 30-day mortality of 1.2% (390/31 380).20 Nevertheless, a volume–outcome relationship is present: high-volume hospitals (40 or more oesophagectomies per year) achieve significantly lower mortality than hospitals that perform fewer than five per year (0.6% v 2.0%). So there is potential to significantly improve outcomes for patients in NSW.
The association between hospital volume and outcome may be partly due to high-volume surgeons working in high-volume hospitals and partly due to hospital factors.21,22 In our study, no data on surgeon volume were available. In general, hospital volume has been found to be more predictive of outcomes than surgeon volume,2 although this is not universal.21 Hospital characteristics associated with improved outcomes in higher-volume hospitals are likely to be multifactorial. Preoperative and postoperative care for oesophagogastric resection for cancer is complex; it involves extensive staging, intensive care, interventional radiology, (neo) adjuvant therapy, specialised nursing and allied health care. A high caseload supports the development of specialist multidisciplinary services and care teams.
Maintaining equitable access to multidisciplinary care is important for the 1000 people diagnosed with oesophagogastric cancer in NSW each year. In Ontario, Canada, a requirement for hospitals to perform 20 oesophagectomies per year has been established; in areas that cannot support this volume, a hospital target of seven is set, with a requirement to establish links with a major centre. The effect of hospital volume on longer-term survival after oeso-phagectomy in Ontario has not yet been reported.23 In the Netherlands, consolidation of surgery has been associated with improvements in survival of surgical and non-surgical cardio-oesophageal cancer patients.24 The arguments for greater consolidation are compelling. In NSW, achieving this and improving outcomes for people with oesophagogastric cancer will require ongoing consultation with clinicians, hospital administrators and governments.
1 Demographic and clinical characteristics of people who underwent oesophagectomy or gastrectomy for oesophagogastric cancer in New South Wales (2001–2008), by annual hospital volume*
|
Oesophagectomy (n = 908) |
Gastrectomy (n = 1621) |
|||||||||||||
|
Lower-volume hospitals (n = 467) |
Higher-volume hospitals (n = 441) |
P |
Lower-volume hospitals (n = 737) |
Higher-volume hospitals (n = 884) |
P |
|||||||||
Sex |
|
|
|
|
|
|
|||||||||
Female |
93 (19.9%) |
84 (19.0%) |
0.74 |
278 (37.7%) |
329 (37.2%) |
0.84 |
|||||||||
Male |
374 (80.1%) |
357 (81.0%) |
|
459 (62.3%) |
555 (62.8%) |
|
|||||||||
Age at admission |
|
|
|
|
|
|
|||||||||
< 65 years |
228 (48.8%) |
216 (49.0%) |
0.31 |
216 (29.3%) |
319 (36.1%) |
0.01 |
|||||||||
65–74 years |
172 (36.8%) |
147 (33.3%) |
|
223 (30.3%) |
257 (29.1%) |
|
|||||||||
≥ 75 years |
67 (14.3%) |
78 (17.7%) |
|
298 (40.4%) |
308 (34.8%) |
|
|||||||||
Socioeconomic status |
|
|
|
|
|
|
|||||||||
Least disadvantaged |
95 (20.3%) |
111 (25.2%) |
0.03 |
155 (21.0%) |
116 (13.1%) |
< 0.001 |
|||||||||
Quintile 2 |
82 (17.6%) |
97 (22.0%) |
|
125 (17.0%) |
222 (25.1%) |
|
|||||||||
Quintile 3 |
93 (19.9%) |
81 (18.4%) |
|
152 (20.6%) |
190 (21.5%) |
|
|||||||||
Quintile 4 |
121 (25.9%) |
80 (18.1%) |
|
175 (23.7%) |
124 (14.0%) |
|
|||||||||
Most disadvantaged |
76 (16.3%) |
72 (16.3%) |
|
130 (17.6%) |
232 (26.2%) |
|
|||||||||
Charlson comorbidity score |
|
|
|
|
|
|
|||||||||
0 |
349 (74.7%) |
326 (73.9%) |
0.45 |
523 (71.0%) |
632 (71.5%) |
0.51 |
|||||||||
1 |
83 (17.8%) |
89 (20.2%) |
|
135 (18.3%) |
146 (16.5%) |
|
|||||||||
≥ 2 |
35 (7.5%) |
26 (5.9%) |
|
79 (10.7%) |
106 (12.0%) |
|
|||||||||
Cancer site |
|
|
|
|
|
|
|||||||||
Oesophagus |
272 (58.2%) |
239 (54.2%) |
0.22 |
0 |
0 |
|
|||||||||
Cardia |
195 (41.8%) |
202 (45.8%) |
|
68 (9.2%) |
88 (10.0%) |
0.62 |
|||||||||
Stomach |
0 |
0 |
|
669 (90.8%) |
796 (90.0%) |
|
|||||||||
Tumour histology |
|
|
|
|
|
|
|||||||||
Adenocarcinoma |
380 (81.4%) |
339 (76.9%) |
0.12 |
|
|
|
|||||||||
Squamous cell |
80 (17.1%) |
88 (20.0%) |
|
|
|
|
|||||||||
Other |
7 (1.5%) |
14 (3.2%) |
|
|
|
|
|||||||||
Extent of cancer spread† |
|
|
|
|
|
|
|||||||||
Local |
145 (31.0%) |
168 (38.1%) |
0.04 |
211 (28.6%) |
245 (27.7%) |
< 0.001 |
|||||||||
Regional |
248 (53.1%) |
226 (51.2%) |
|
409 (55.5%) |
481 (54.4%) |
|
|||||||||
Distant |
44 (9.4%) |
30 (6.8%) |
|
76 (10.3%) |
136 (15.4%) |
|
|||||||||
Unknown |
30 (6.4%) |
17 (3.9%) |
|
41 (5.6%) |
22 (2.5%) |
|
|||||||||
Urgency of admission |
|
|
|
|
|
|
|||||||||
Emergency |
19 (4.1%) |
23 (5.2%) |
0.41 |
126 (17.1%) |
118 (13.3%) |
0.04 |
|||||||||
Planned or other |
448 (95.9%) |
418 (94.8%) |
|
611 (82.9%) |
766 (86.7%) |
|
|||||||||
Hospital type |
|
|
|
|
|
|
|||||||||
Public |
272 (58.2%) |
331 (75.1%) |
< 0.001 |
442 (60.0%) |
708 (80.1%) |
< 0.001 |
|||||||||
Private |
195 (41.8%) |
110 (24.9%) |
|
295 (40.0%) |
176 (19.9%) |
|
|||||||||
* Data are number (%) of patients; lower-volume and higher-volume hospitals performed ≤ 6 and > 6 procedures per year, respectively. † Furthest extent within 4 months of diagnosis. |
|||||||||||||||
2 Unadjusted and adjusted odds ratios for morbidity and mortality outcomes after oesophagectomy and gastrectomy perfomed in New South Wales (2001–2008), for higher annual hospital volume (reference group) versus lower annual hospital volume*
|
Unadjusted |
Adjusted |
|||||||||||||
Outcome |
Odds ratio (95% CI) |
P |
Odds ratio (95% CI) |
P |
|||||||||||
Oesophagectomy |
|
|
|
|
|||||||||||
> 21-day length of stay |
0.99 (0.69–1.42) |
0.96 |
1.10 (0.77–1.57) |
0.60 |
|||||||||||
28-day unplanned readmission |
0.67 (0.44–1.01) |
0.06 |
0.68 (0.45–1.04) |
0.08 |
|||||||||||
30-day mortality† |
1.25 (0.64–2.45) |
0.51 |
1.52 (0.76–3.03) |
0.23 |
|||||||||||
90-day mortality† |
1.27 (0.77–2.09) |
0.36 |
1.42 (0.84–2.39) |
0.19 |
|||||||||||
Gastrectomy |
|
|
|
|
|||||||||||
> 21-day length of stay |
1.11 (0.79–1.55) |
0.54 |
0.97 (0.69–1.38) |
0.88 |
|||||||||||
28-day unplanned readmission |
0.92 (0.63–1.33) |
0.64 |
1.00 (0.72–1.40) |
0.99 |
|||||||||||
30-day mortality† |
1.36 (0.84–2.20)‡ |
0.21 |
1.37 (0.80–2.33) |
0.25 |
|||||||||||
90-day mortality† |
1.07 (0.76–1.51)‡ |
0.69 |
1.22 (0.81–1.86) |
0.34 |
|||||||||||
* Lower-volume and higher-volume hospitals performed ≤ 6 and > 6 procedures per year, respectively. † Procedures after 1 December 2008 and 2 October 2008 were excluded from the 30-day and 90-day mortality analyses, respectively, because follow-up data may not have been complete. ‡ Single-level logistic regression model results. |
|||||||||||||||
3 Kaplan–Meier 5-year absolute survival after oesophagectomy or gastrectomy performed in New South Wales from 2001 to 2008 on people diagnosed with oesophagogastric cancer from 2000 to 2007, by annual hospital volume*
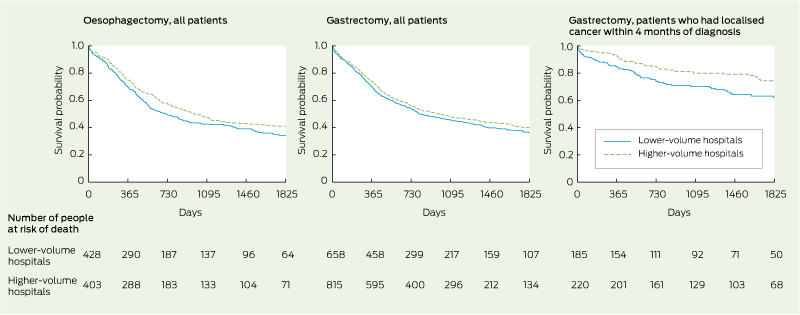
* Lower-volume and higher-volume hospitals performed ≤ 6 and > 6 procedures per year, respectively.
4 Unadjusted and adjusted 5-year survival (proportions of patients who survived) and hazard ratios (HRs) after oesophagectomy and gastrectomy performed in New South Wales from 2001 to 2008 on people diagnosed with oesophagogastric cancer from 2000 to 2007, by annual hospital volume*
|
Absolute survival |
Conditional survival† |
|||||||||||||
Unadjusted |
Adjusted |
Unadjusted |
Adjusted |
||||||||||||
% (95% CI) |
HR (95% CI) |
P |
% (95% CI) |
HR (95% CI) |
P |
% (95% CI) |
HR (95% CI) |
P |
% (95% CI) |
HR (95% CI) |
P |
||||
Oesophagectomy |
|
|
|
|
|
|
|
|
|
|
|
|
|||
Lower-volume hospitals |
34% (29%–40%) |
1.21 (1.01–1.44) |
0.03 |
34% (30%–38%) |
1.28 (1.10–1.49) |
0.002 |
36% (31%–41%) |
1.22 (1.00–1.47) |
0.05 |
36% (31%–40%) |
1.28 (1.07–1.52) |
0.006 |
|||
Higher-volume hospitals |
41% (36%–46%) |
1 |
|
42% (38%–47%) |
1 |
|
43% (37%–48%) |
1 |
|
44% (39%–48%) |
1 |
|
|||
Overall |
38% (34–41%) |
|
|
|
|
|
39% (35%–43%) |
|
|
|
|
|
|||
Gastrectomy |
|
|
|
|
|
|
|
|
|
|
|
|
|||
Lower-volume hospitals |
36% (32%–41%) |
1.11 (0.95–1.29) |
0.19 |
37% (33%–41%) |
1.11 (0.95–1.31) |
0.19 |
38% (34%–43%) |
1.09 (0.94–1.26) |
0.26 |
39% (35%–43%) |
1.10 (0.93–1.29) |
0.26 |
|||
Higher-volume hospitals |
40% (36%–44%) |
1 |
|
40% (37%–43%) |
1 |
|
42% (38%–46%) |
1 |
|
41% (38%–45%) |
1 |
|
|||
Overall |
38% (36%–41%) |
|
|
|
|
|
40% (37%–43%) |
|
|
|
|
|
|||
* HRs were calculated using Cox proportional hazards models, and an HR > 1 indicates a higher hazard (ie, poorer survival); lower-volume and higher-volume hospitals performed < 6 and > 6 procedures per year, respectively. † Analysis of conditional survival includes patients who survived > 30 days after surgery. |
|||||||||||||||
Received 12 September 2013, accepted 24 February 2014
- Ross C Smith1
- Nicola Creighton2
- Reginald V Lord3
- Neil D Merrett4
- Gregory W Keogh5
- Winston S Liauw6,7
- David C Currow2
- 1 Northern Clinical School, University of Sydney, Sydney, NSW.
- 2 Cancer Institute NSW, Sydney, NSW.
- 3 School of Medicine, University of Notre Dame Australia, Sydney, NSW.
- 4 School of Medicine, University of Western Sydney, Sydney, NSW.
- 5 Prince of Wales Hospital, Sydney, NSW.
- 6 Cancer Care Centre, St George Hospital, Sydney, NSW.
- 7 St George and Sutherland Clinical School, University of New South Wales, Sydney, NSW.
Claire Cooke-Yarborough provided advice based on review of the surgical pathology reports. We thank the CCR and the NSW Ministry of Health for providing data for this study.
Contributors: This study was conducted with assistance from the Upper Gastro-intestinal NSW Oncology Group of Cancer Institute NSW. The following members provided clinical and scientific advice on analysis and interpretation of the data: Douglas Fenton-Lee, Stephen Thompson, David Goldstein, Koroush Haghighi, Steven Leibman, Jaswinder Samra, Amitabha Das, Garett Smith and Charbel Sandroussi.
No relevant disclosures.
- 1. Australian Institute of Health and Welfare. Cancer in Australia: an overview, 2012. Canberra: AIHW, 2012. (AIHW Cat. No. CAN 70; Cancer Series No. 74.) https://www.aihw.gov.au/publication-detail/?id=60129542359 (accessed Feb 2014).
- 2. Wouters MW, Gooiker GA, van Sandick JW, Tollenaar RA. The volume-outcome relation in the surgical treatment of esophageal cancer: a systematic review and meta-analysis. Cancer 2012; 118: 1754-1763.
- 3. Birkmeyer JD, Sun Y, Wong SL, Stukel TA. Hospital volume and late survival after cancer surgery. Ann Surg 2007; 245: 777-783.
- 4. Gruen RL, Pitt V, Green S, et al. The effect of provider case volume on cancer mortality: systematic review and meta-analysis. CA Cancer J Clin 2009; 59: 192-211.
- 5. Finley CJ, Jacks L, Keshavjee S, Darling G. The effect of regionalization on outcome in esophagectomy: a Canadian national study. Ann Thorac Surg 2011; 92: 485-490.
- 6. Department of Health, UK. Guidance on commissioning cancer services: improving outcomes in upper gastro-intestinal cancers: the manual. London: Department of Health, 2001.
- 7. Dikken JL, Dassen AE, Lemmens VE, et al. Effect of hospital volume on postoperative mortality and survival after oesophageal and gastric cancer surgery in the Netherlands between 1989 and 2009. Eur J Cancer 2012; 48: 1004-1013.
- 8. Bachmann MO, Alderson D, Edwards D, et al. Cohort study in South and West England of the influence of specialization on the management and outcome of patients with oesophageal and gastric cancers. Br J Surg 2002; 89: 914-922.
- 9. Wouters MW, Karim-Kos HE, le Cessie S, et al. Centralization of esophageal cancer surgery: does it improve clinical outcome? Ann Surg Oncol 2009; 16: 1789-1798.
- 10. Esteban D, Whelan S, Laudico A, Parkin DM, editors. Manual for cancer registry personnel. (IARC Technical Report No. 10.) Lyon: International Agency for Research on Cancer, 1995.
- 11. Australian Bureau of Statistics. Information paper: an introduction to Socio-Economic Indexes for Areas (SEIFA), 2006. Canberra: ABS, 2008. (ABS Cat. No. 2039.0.) http://www.abs. gov.au/ausstats/abs@.nsf/mf/2039.0 (accessed Feb 2014).
- 12. Sundararajan V, Henderson T, Perry C, et al. New ICD-10 version of the Charlson Comorbidity Index predicted in-hospital mortality. J Clin Epidemiol 2004; 57: 1288-1294.
- 13. Moineddin R, Matheson FI, Glazier RH. A simulation study of sample size for multilevel logistic regression models. BMC Med Res Methodol 2007; 7: 34.
- 14. Dikken JL, van Sandick JW, Allum WH, et al. Differences in outcomes of oesophageal and gastric cancer surgery across Europe. Br J Surg 2013; 100: 83-94.
- 15. Goodney PP, Stukel TA, Lucas FL, et al. Hospital volume, length of stay, and readmission rates in high-risk surgery. Ann Surg 2003; 238: 161-167.
- 16. Park DP, Welch CA, Harrison DA, et al. Outcomes following oesophagectomy in patients with oesophageal cancer: a secondary analysis of the ICNARC Case Mix Programme Database. Crit Care 2009; 13 Suppl 2: S1.
- 17. Kohn GP, Galanko JA, Meyers MO, et al. National trends in esophageal surgery — are outcomes as good as we believe? J Gastrointest Surg 2009; 13: 1900-1912.
- 18. Anderson O, Ni Z, Møller H, et al. Hospital volume and survival in oesophagectomy and gastrectomy for cancer. Eur J Cancer 2011; 47: 2408-2414.
- 19. Bilimoria KY, Bentrem DJ, Feinglass JM, et al. Directing surgical quality improvement initiatives: comparison of perioperative mortality and long-term survival for cancer surgery. J Clin Oncol 2008; 26: 4626-4633.
- 20. Fujita H, Ozawa S, Kuwano H, et al. Esophagectomy for cancer: clinical concerns support centralizing operations within the larger hospitals. Dis Esophagus 2010; 23: 145-152.
- 21. Derogar M, Sadr-Azodi O, Johar A, et al. Hospital and surgeon volume in relation to survival after esophageal cancer surgery in a population-based study. J Clin Oncol 2013; 31: 551-557.
- 22. Birkmeyer JD, Stukel TA, Siewers AE, et al. Surgeon volume and operative mortality in the United States. N Engl J Med 2003; 349: 2117-2127.
- 23. Sundaresan S, McLeod R, Irish J, et al. Early results after regionalization of thoracic surgical practice in a single-payer system. Ann Thorac Surg 2013; 95: 472-479.
- 24. van de Poll-Franse LV, Lemmens VE, Roukema JA, et al. Impact of concentration of oesophageal and gastric cardia cancer surgery on long-term population-based survival. Br J Surg 2011; 98: 956-963.
Abstract
Objectives: To examine the relationship between hospital volume and patient outcomes for New South Wales hospitals performing oesophagectomy and gastrectomy for oesophagogastric cancer.
Design, setting and patients: A retrospective, population-based cohort study of NSW residents diagnosed with a new case of invasive oesophageal or gastric cancer who underwent oesophagectomy or gastrectomy between 2001 and 2008 in NSW hospitals using linked de-identified data from the NSW Central Cancer Registry, the National Death Index and the NSW Admitted Patient Data Collection. A higher-volume hospital was defined as one performing > 6 relevant procedures per year.
Main outcome measures: Odds ratios for > 21-day length of stay, 28-day unplanned readmission, 30-day mortality and 90-day mortality, and hazard ratios (HRs) for 5-year absolute and conditional survival.
Results: Oesophagectomy (908 patients) and gastrectomy (1621 patients) were undertaken in 42 and 84 hospitals, respectively, between 2001 and 2008. Median annual hospital volume ranged from 2 to 4 for oesophagectomies and ranged from 2 to 3 for gastrectomies. Controlling for known confounders, no associations between hospital volume and > 21-day length of stay and 28-day unplanned readmission were found. Overall 30-day mortality was 4.1% and 4.4% for oesophagectomy and gastrectomy, respectively. Five-year absolute survival was significantly better for patients who underwent oesophagectomy in higher-volume hospitals (adjusted HR for lower-volume hospitals, 1.28 [95% CI, 1.10–1.49]; P = 0.002) and for those with localised gastric cancer who underwent gastrectomy in higher-volume hospitals (adjusted HR for lower-volume hospitals, 1.83 [95% CI, 1.28–2.61]; P = 0.001).
Conclusions: These data support initial surgery for oesophagogastric cancer in higher-volume hospitals.