


Colorectal cancer is the second most commonly diagnosed cancer in Australia, excluding non-melanoma skin cancers.1 There is high-quality evidence that specific treatment approaches improve patient outcomes; however, previous Australian and international studies have found that clinical care processes and outcomes are highly variable for people with colorectal cancer.2-6 For example, a statewide patterns-of-care study completed in New South Wales in 2000 described large variation among hospitals in both evidence-based care and outcomes.7
To date in NSW, time- and resource-intensive clinician surveys or medical record audits have been used to conduct patterns-of-care studies. Because clinical cancer registries have been collecting in-depth clinical information in public facilities in NSW since 2006, there is now potential to conduct these studies using routinely collected data, at least in the public sector.
Identifying hospitals with significantly better or worse performance than other hospitals can be difficult, owing to differences in patient casemix and caseload. Without adjusting for factors that independently predict poorer outcomes, such as older age, comorbidities, later stage of disease, and emergency resection,6 hospital performance will not be accurately ascertained. Greater variability in outcome rates is also more likely to arise by chance for providers with small caseloads. Funnel plots, which plot the estimated outcome rate against a measure of its precision, have been suggested for use in identifying outlier hospitals8 and are increasingly being used in health services research.6 Multilevel regression models, which take into account the clustering of patients within hospitals, have also been used to quantify hospital variation in outcomes.9,10 By including patient and hospital factors in these models, adjusted performance estimates can be produced and patient-level and hospital-level determinants of care and outcomes can be identified.
The aim of this study was to quantify the extent of variation between hospitals in care processes and outcomes for colorectal cancer in NSW using a linked population-based dataset, and to identify patient- and hospital-level factors accounting for hospital variation.
A linked population-based de-identified dataset was created from the records of people with a cancer of the colon, rectosigmoid junction or rectum registered by the NSW Central Cancer Registry (CCR) in 2007 and 2008. The CCR receives mandatory cancer notifications and includes tumour details and demographic items. CCR data were linked by the Centre for Health Record Linkage to the NSW Admitted Patient Data Collection, a population-based collection including information on all episodes of hospital care from all NSW public and private facilities, and the NSW Registry of Births, Deaths and Marriages, which records date of death. Only records of the first registered colorectal cancer were used, and synchronous colorectal cancers were excluded. The study was approved by the NSW Population and Health Services Research Ethics Committee.
The study dataset included people who had an admission for an identified surgical resection procedure11 in one of 105 hospitals in NSW. Additionally, data were linked to six Area Health Service Clinical Cancer Registries (ClinCRs). The ClinCR contains items about cancer diagnosis, staging, and specialist referrals and consultations that provide additional depth to the data collected in the CCR and other datasets. ClinCR data are based on a minimum dataset collected voluntarily for notifiable cancers in public hospitals in six of the eight former Area Health Services in NSW since 2006, and have been shown to include 85% of people who underwent colorectal cancer surgery in a public hospital in 2008.11
We analysed six outcome and five care process measures in this study. Measures were chosen based on current clinical practice guidelines and literature review (with input from a study advisory group comprising clinicians, data managers and clinical coders), as well as an assessment of the feasibility of calculating them from available data.11 Measures were calculated for colon and rectal cancers separately. Rectosigmoid junction cancers were grouped with colon cancers as they have more similar rates of survival and recurrence.12 Outcome measures were calculated for the whole cohort; however, care process measures required data from the ClinCR, which are collected only in public hospitals (43 hospitals; 61.5% of patients). The available data for each measure and further information about their definition and calculation are reported elsewhere.13
Outcome rates by hospital were calculated using multilevel logistic regression models. Rates were adjusted for age, sex, Charlson comorbidity score,14 extent of disease, emergency admission, socioeconomic status (Socio-Economic Indexes for Areas score),15 and private health insurance status. Each hospital’s expected number of outcomes was obtained by summing their patients’ predicted probabilities of experiencing the outcome, given their covariate values. The observed number (O) of people who experienced the outcome was divided by the expected number (E) to create a ratio (O/E) that was multiplied by the overall NSW outcome rate to obtain the risk-adjusted rate for each hospital.16 Hospital rates for care process measures were unadjusted, as each measure should apply to all people defined in the denominator of the measure.
Funnel plots and multilevel regression models were used to quantify hospital variation. In the funnel plots, the outcome and care process rates for each hospital were plotted against hospital caseload. For each measure, 95% and 99.8% “control limits” were calculated based on the mean NSW rate.8 Hospitals outside of these limits were considered outliers.
Multilevel regression models take into account the clustering of patients within hospitals and allow the partitioning of variance between levels. The following two-level logistic regression models were fitted for each measure:
a null model (hospital random effects but no explanatory variables);
a model with fixed patient effects (as reported in Box 1) and hospital random effects; and
a model with fixed patient and hospital effects (ie, caseload, private or public hospital, metropolitan or rural location) and hospital random effects.
Models were fitted using a Markov chain Monte Carlo approach in MLwiN (Centre for Multilevel Modeling). Intraclass correlation coefficients were calculated to compare the proportion of total variability attributable to hospitals after accounting for known patient and hospital factors.
Adjusted odds ratios (AORs) for patient and hospital factors were obtained from a maximum likelihood estimation approach based on adaptive quadrature in Stata (StataCorp).18 ORs for hospital factors are also presented as 80% interval ORs (IOR-80%), as hospital-level AORs can be problematic to interpret in multilevel models.19 An IOR-80% containing the value one indicates that the hospital characteristic does not add meaningfully to explaining hospital variation in the outcome.
Box 1 presents the characteristics of the 6890 people included in the dataset. Hospital caseload varied widely, with hospitals treating between one and 129 patients with a new colon cancer and one and 41 patients with a new rectal cancer on average per year. Hospital caseload was divided into quintiles for the analysis.
Box 2 shows the number of outlying hospitals identified from funnel plots. Example funnel plots are shown in Box 3. More hospitals performed outside of control limits for care process measures than for outcome measures. The outcome measure with the most outlying hospitals was 90-day venous thromboembolism for both colon cancer (5% above 95% limits) and rectal cancer (8% above 95% limits). Recorded pathological stage (documented tumour–node–metastasis stage based on histological examination) was the care process measure with the greatest proportion of outlying hospitals (colon cancer, 41%; rectal cancer, 23%) (Box 2).
Hospital variance was much greater for care process measures than for outcome measures in the multilevel models, both before and after adjusting for patient and hospital factors (Box 2; and Appendix 1). Known patient factors accounted for most of the hospital variation in outcome measures. For care process measures, known patient and hospital factors generally did not help to explain much of the hospital variation. Recorded pathological stage showed the greatest hospital variation; estimates of total variability attributable to hospitals, after accounting for known patient and hospital factors, were 87% in the colon cancer model and 91% in the rectal cancer model.
Box 4 and Box 5 summarise patient and hospital-level predictors of outcome and care process measures. Complete results are available in Appendix 2. Greater extent of disease, comorbidity, resection after emergency admission and increasing patient age consistently showed strong evidence of an effect on outcomes. Having no current partner increased the odds of prolonged length of stay for colon (AOR, 1.8; 95% CI, 1.5–2.2) and rectal cancer patients (AOR, 1.7; 95% CI, 1.2–2.4).
There was less evidence of an effect of hospital-level factors on outcomes. Wound infection within 30 days was more likely in a rural or regional hospital compared with a metropolitan hospital (colon cancer: AOR, 1.9; 95% CI, 1.3–2.7; rectal cancer: AOR, 2.4; 95% CI, 1.4–4.0).
Care process measures had fewer consistent predictors than outcome measures. Younger people were more likely to be discussed at a multidisciplinary team (MDT) meeting and receive treatment within suggested time frames from the initial referral and the decision to treat. Greater extent of disease increased the odds of appropriate care for nearly all care process measures. Interestingly, males with rectal cancer were more likely than females to be treated within 62 days of initial referral (AOR, 1.9; 95% CI, 1.4–2.8).
Care process measures could only be compared between public hospitals, as these measures are based on data from the ClinCR. A patient with colon cancer treated at a metropolitan hospital or a medium caseload hospital was more likely to be discussed at an MDT meeting. However, the IOR-80% for these factors contains one, meaning that known hospital factors accounted for only a small component of the unexplained hospital variation in care processes.
A linked population-based dataset was used in this study to examine predictors of variation for a number of outcome and care process measures. Both funnel plots and the results of multilevel models showed that variation in hospital performance was much greater for care process measures (eg, discussion at an MDT meeting) than outcome measures (eg, 30-day mortality). There was a consistent effect of several patient-level and hospital-level factors on care and outcomes after colorectal cancer surgery.
Increasing age, for example, increased the odds of a patient not being discussed at an MDT meeting and not receiving treatment within suggested time frames. In a patterns-of-care study conducted in NSW in 2000, older people were also reported to be less likely to receive guideline-recommended care.2 Differences in the provision of care likely compound older patients’ already poorer postoperative outcomes, resulting in reduced longer-term survival. For both colon and rectal cancer patients, wound infection was more likely in a rural hospital. The reason for this is unclear, but could reflect differing practices for wound infection documentation in medical records, or could possibly arise from real differences in access to wound care after hospital discharge. Investigating and addressing causes of these differences could improve the care and outcomes of people with colorectal cancer.
This study has confirmed that patient characteristics must be included in risk-adjustment models to enable valid comparisons of outcomes and to accurately quantify hospital variation. Greater extent of disease, comorbidity, resection after emergency admission and increasing patient age showed evidence of a strong association with most outcome measures in this study. These predictors have been consistently reported across other population-based studies of colorectal cancer outcomes.6,20-22 However, socioeconomic status was not a predictor of any outcome in this study. A more personalised measure of socioeconomic status, such as income or education, or a measure of physical or health status could also explain outcomes.22,23 Nevertheless, there was little variation between hospitals for most outcome measures after accounting for patient factors.
Identifying causes of variation is more difficult for care process measures, as patient and hospital characteristics largely did not help to explain hospital variation. Physician-related factors such as training and volume have been identified as predictors of better patient outcomes after surgery for colorectal cancer,24 and could account for some of the hospital variation in care. Unfortunately, data about individual clinicians were not available for our study. Care process measures also rely on the accuracy and completeness of data in the ClinCR, which may differ by hospital.11 Hospital variation in recording of pathological stage, for example, could have resulted from a lack of local resources for interpretation of complex pathology reports. Recent integration of the ClinCR into the NSW Central Cancer Registry25 will facilitate increased completeness and reduce the potential for measurement error. However, further validation is required to determine whether a treatment or care process was not received or simply not recorded.
Variation between hospitals for one of the most commonly studied outcomes in surgical oncology, 30-day mortality, has been noted internationally for colorectal cancer surgery.6,22 While the range of hospital rates may be large, the amount of variation attributable to hospitals in statistical modelling is often small.22 Incorporating measures such as IOR-80%26 or using funnel plots to identify outlying hospitals while accounting for the precision of performance estimates may assist the interpretation of the practical importance of observed differences between hospitals.
A linked, routinely collected population-based dataset was able to be used in this study to explore hospital variation in colorectal cancer surgery for a range of outcome and care process measures for the first time in NSW. Despite its limitations, data linkage appears to be a cost-effective way to monitor the ongoing performance of hospitals in NSW and identify hospitals and patient groups most at risk of suboptimal care and outcomes. The reasons why certain patients and hospitals are at risk need to be further explored. The wide variation between hospitals in care processes indicates that there is considerable scope for improvement; however, identifying variation is ultimately only useful if it stimulates quality improvement.27
1 Characteristics of 6890 people having surgery for colorectal cancer in New South Wales
|
No. of people (%) |
||||||||||||||
Sex |
|
||||||||||||||
Male |
3741 (54.30%) |
||||||||||||||
Female |
3149 (45.70%) |
||||||||||||||
Age at diagnosis (years) |
|
||||||||||||||
0–59 |
1542 (22.38%) |
||||||||||||||
60–69 |
1912 (27.75%) |
||||||||||||||
70–79 |
2075 (30.12%) |
||||||||||||||
≥ 80 |
1361 (19.75%) |
||||||||||||||
Socioeconomic disadvantage (SEIFA score)* |
|||||||||||||||
1 Least disadvantaged |
1393 (20.22%) |
||||||||||||||
2 |
1186 (17.21%) |
||||||||||||||
3 |
1452 (21.07%) |
||||||||||||||
4 |
1568 (22.76%) |
||||||||||||||
5 Most disadvantaged |
1286 (18.66%) |
||||||||||||||
Remoteness (ARIA index) |
|
||||||||||||||
Highly accessible |
4707 (68.32%) |
||||||||||||||
Accessible |
1636 (23.74%) |
||||||||||||||
Moderately accessible/remote/very remote |
547 (7.94%) |
||||||||||||||
Private health insurance* |
|
||||||||||||||
Yes |
3310 (48.04%) |
||||||||||||||
No |
3475 (50.44%) |
||||||||||||||
Resection after emergency admission |
|||||||||||||||
Yes |
666 (9.67%) |
||||||||||||||
No |
6224 (90.33%) |
||||||||||||||
Degree of spread of cancer* |
|
||||||||||||||
Localised |
2611 (37.90%) |
||||||||||||||
Regional spread |
3243 (47.07%) |
||||||||||||||
Distant metastasis |
860 (12.48%) |
||||||||||||||
Charlson comorbidity score |
|
||||||||||||||
0 |
6130 (88.97%) |
||||||||||||||
1 |
322 (4.67%) |
||||||||||||||
2 |
326 (4.73%) |
||||||||||||||
3+ |
112 (1.63%) |
||||||||||||||
Site of cancer |
|
||||||||||||||
Colon |
4612 (66.94%) |
||||||||||||||
Rectosigmoid junction |
575 (8.35%) |
||||||||||||||
Rectum |
1703 (24.72%) |
||||||||||||||
Hospital type |
|
||||||||||||||
Public |
4237 (61.49%) |
||||||||||||||
Private |
2653 (38.51%) |
||||||||||||||
Hospital location |
|
||||||||||||||
Metropolitan |
4738 (68.77%) |
||||||||||||||
Rural/regional |
2152 (31.23%) |
||||||||||||||
SEIFA = Socio-Economic Indexes for Areas.15 ARIA = Accessibility/Remoteness Index of Australia.17 * Some data missing. |
|||||||||||||||
2 Hospital variation in outcome and care process measures for hospitals treating 6890 people with colorectal cancer in NSW
|
Model 1: Null two-level model (ICC) |
Model 2: Patient factors only (ICC) |
Model 3: Patient + hospital factors (ICC) |
No. (%) of outlying hospitals in funnel plots |
|||||||||||
|
Colon |
Rectal |
Colon |
Rectal |
Colon |
Rectal |
Colon |
Rectal |
|||||||
Outcome measures |
|
|
|
|
|
|
n = 98 |
n = 91 |
|||||||
30-day all-cause mortality |
0.12 |
0.10 |
0.02 |
0.14 |
0.04 |
0.11 |
1 (1%) |
5 (6%) |
|||||||
28-day emergency readmission |
0.03 |
0.02 |
0.008 |
0.01 |
0.01 |
0.02 |
3 (3%) |
2 (2%) |
|||||||
Prolonged length of stay for relevant diagnosis-related group |
0.04 |
0.04 |
0.02 |
0.008 |
0.02 |
0.006 |
1 (1%) |
1 (1%) |
|||||||
Venous thromboembolism within 90 days of surgery |
0.01 |
0.04 |
0.02 |
0.03 |
0.02 |
0.08 |
5 (5%) |
7 (8%) |
|||||||
Wound infection within 30 days of surgery |
0.03 |
0.06 |
0.02 |
0.01 |
0.01 |
0.01 |
2 (2%) |
0 |
|||||||
1-year all-cause mortality |
0.03 |
0.009 |
0.006 |
0.01 |
0.005 |
0.005 |
2 (2%) |
0 |
|||||||
Care process measures |
|
|
|
|
|
|
n = 42 |
n = 39 |
|||||||
Discussed at multidisciplinary team meeting |
0.34 |
0.41 |
0.36 |
0.42 |
0.28 |
0.42 |
10 (24%) |
5 (13%) |
|||||||
Cancer stage documented |
0.67 |
0.59 |
0.67 |
0.67 |
0.71 |
0.76 |
4 (10%) |
0 |
|||||||
Pathological stage recorded |
0.86 |
0.91 |
0.89 |
0.93 |
0.87 |
0.91 |
17 (41%) |
9 (23%) |
|||||||
Treatment within 31 days of decision to treat |
0.44 |
0.30 |
0.52 |
0.43 |
0.51 |
0.45 |
11 (26%) |
4 (10%) |
|||||||
Treatment within 62 days of initial referral |
0.43 |
0.21 |
0.52 |
0.29 |
0.49 |
0.26 |
11 (26%) |
5 (13%) |
|||||||
ICC = intraclass correlation coefficient (the estimated proportion of total variability attributable to hospitals). |
|||||||||||||||
3 Example funnel plots of hospital performance for outcome and care process measures
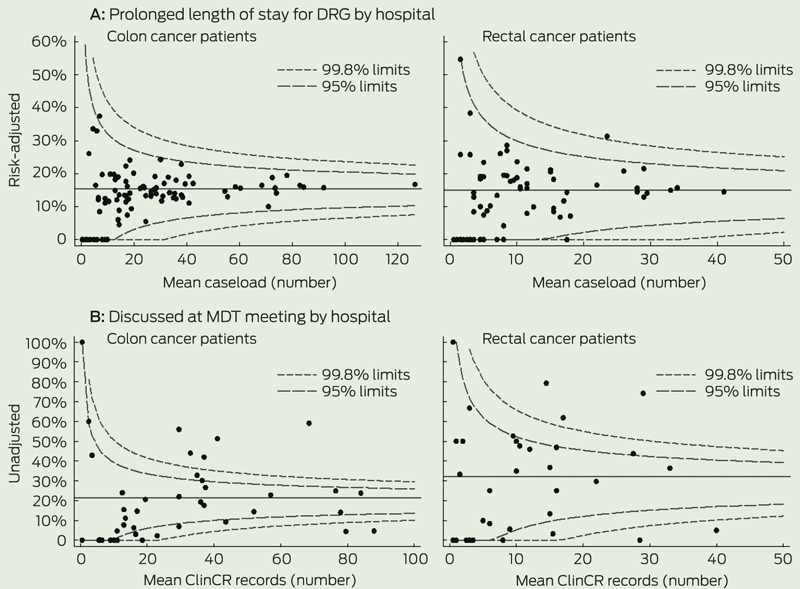
DRG = diagnosis-related group. MDT = multidisciplinary team. ClinCR = Area Health Service Clinical Cancer Registry.
4 Summary of significant predictors in multilevel models for outcome measures
|
30-day mortality |
28-day emergency readmission |
Prolonged length of stay |
90-day VTE |
30-day wound infection |
1-year mortality |
|||||||||
Patient factors |
|
|
|
|
|
|
|
|
|
|
|
|
|||
Charlson score (higher) |
C* |
R† |
|
|
C* |
R* |
C† |
|
|
|
C* |
R* |
|||
Cancer spread (greater) |
C† |
|
C* |
|
C* |
|
C* |
|
|
|
C* |
R* |
|||
Age at diagnosis (older) |
C* |
|
|
|
C* |
R* |
|
|
|
|
C* |
R* |
|||
Emergency admission |
C* |
|
|
|
C* |
R* |
|
|
|
|
C* |
|
|||
Marital status (no partner) |
|
|
|
|
C* |
R* |
|
|
|
|
|
|
|||
Sex (male) |
C† |
|
|
|
|
|
|
|
C† |
|
|
|
|||
Private health insurance |
|
|
|
|
C† |
|
|
|
|
|
|
|
|||
Remoteness (more remote) |
|
|
|
|
|
|
|
|
|
|
|
|
|||
Socioeconomic status |
|
|
|
|
|
|
|
|
|
|
|
|
|||
Hospital factors |
|
|
|
|
|
|
|
|
|
|
|
|
|||
Hospital type (public) |
|
|
|
R† |
|
|
|
|
|
|
|
|
|||
Hospital location (rural) |
|
|
|
|
|
|
|
|
C* |
R* |
|
|
|||
Mean caseload (mid) |
|
|
|
|
|
|
|
|
|
|
|
|
|||
C = colon cancer model. R = rectal cancer model. VTE = venous thromboembolism. * P < 0.001. † P < 0.01. |
|||||||||||||||
5 Summary of significant predictors in multilevel models for care process measures
|
Discussed at MDT meeting |
Documented cancer stage |
Pathological stage recorded |
Treatment within 31 days of decision |
Treatment within 62 days of referral |
||||||||||
Patient factors |
|
|
|
|
|
|
|
|
|
|
|||||
Cancer spread (regional) |
C* |
|
C* |
R† |
C* |
|
C* |
R* |
C* |
R* |
|||||
Age at diagnosis (younger) |
C* |
|
|
|
|
|
C* |
R* |
C* |
R† |
|||||
Sex (male) |
|
|
|
|
|
|
|
R* |
|
R* |
|||||
Charlson score (lower) |
|
|
|
|
|
|
C† |
|
|
|
|||||
Remoteness (more remote) |
C† |
|
|
|
|
|
|
|
|
|
|||||
Emergency admission |
|
|
|
|
|
|
|
|
C* |
|
|||||
Marital status (partnered) |
|
|
|
|
|
|
|
|
|
|
|||||
Private health insurance |
|
|
|
|
|
|
|
|
|
|
|||||
Socioeconomic status |
|
|
|
|
|
|
|
|
|
|
|||||
Hospital factors |
|
|
|
|
|
|
|
|
|
|
|||||
Mean caseload (mid) |
C† |
|
|
|
|
|
|
|
|
|
|||||
Hospital location (metro/rural) |
C* |
|
|
|
|
|
|
|
|
|
|||||
C = colon cancer model. R = rectal cancer model. MDT = multidisciplinary team. * P < 0.001. † P < 0.01. |
|||||||||||||||
Received 29 May 2013, accepted 8 December 2013
- Mikaela L Jorgensen1
- Jane M Young1
- Timothy A Dobbins1
- Michael J Solomon2
- 1 Cancer Epidemiology and Services Research, Sydney School of Public Health, University of Sydney, Sydney, NSW.
- 2 Surgical Outcomes Research Centre, Sydney Local Health District and University of Sydney, Sydney, NSW.
This research was funded by a Cancer Epidemiology Linkage Grant from the Cancer Institute NSW. We thank the data managers and custodians of each of the data collections used in this study and the staff at the Centre for Health Record Linkage for preparing the data for linkage. We also thank Paul Finan from the University of Leeds for his assistance in developing the indicators.
No relevant disclosures.
- 1. Australian Institute of Health and Welfare; Australasian Association of Cancer Registries. Cancer in Australia: an overview 2012. Canberra: AIHW, 2012. (AIHW Cat. No. CAN 70; Cancer Series No. 74.) http://www.aihw.gov.au/WorkArea/DownloadAsset.aspx?id=60129542353 (accessed May 2013).
- 2. Young JM, Leong DC, Armstrong K, et al. Concordance with national guidelines for colorectal cancer care in New South Wales: a population-based patterns of care study. Med J Aust 2007; 186: 292-295. <MJA full text>
- 3. Chagpar R, Xing Y, Chiang YJ, et al. Adherence to stage-specific treatment guidelines for patients with colon cancer. J Clin Oncol 2012; 30: 972-979.
- 4. Malin JL, Schneider EC, Epstein AM, et al. Results of the National Initiative for Cancer Care Quality: how can we improve the quality of cancer care in the United States? J Clin Oncol 2006; 24: 626-634.
- 5. McGrath DR, Leong DC, Gibberd R, et al. Surgeon and hospital volume and the management of colorectal cancer patients in Australia. ANZ J Surg 2005; 75: 901-910.
- 6. Morris EJ, Taylor EF, Thomas JD, et al. Thirty-day postoperative mortality after colorectal cancer surgery in England. Gut 2011; 60: 806-813.
- 7. Habib MR, Solomon MJ, Young JM, et al. Evidence-based and clinical outcome scores to facilitate audit and feedback for colorectal cancer care. Dis Colon Rectum 2009; 52: 616-622.
- 8. Spiegelhalter DJ. Funnel plots for comparing institutional performance. Stat Med 2005; 24: 1185-1202.
- 9. Sanagou M, Wolfe R, Forbes A, Reid CM. Hospital-level associations with 30-day patient mortality after cardiac surgery: a tutorial on the application and interpretation of marginal and multilevel logistic regression. BMC Med Res Methodol 2012; 12: 28.
- 10. Duncan C, Jones K, Moon G. Context, composition and heterogeneity: using multilevel models in health research. Soc Sci Med 1998; 46: 97-117.
- 11. Young J, Jorgensen M, Dobbins T, Solomon M. CESR technical report 1: the quality and usefulness of the NSW Clinical Cancer Registry Minimum Dataset and Colorectal Dataset Extension for colorectal cancer services research. Sydney: Cancer Epidemiology and Services Research, Sydney School of Public Health, University of Sydney, 2012. http://hdl.handle.net/2123/8936 (accessed May 2013).
- 12. Mukai M, Kishima K, Yamazaki M, et al. Stage II/III cancer of the rectosigmoid junction: an independent tumor type? Oncol Rep 2011; 26: 737-741.
- 13. Jorgensen M, Young J, Dobbins T, et al. CESR Supp Table 2: Calculation of surgical outcome and care process indicators for colorectal cancer in NSW, 2007-2008. Sydney: Sydney School of Public Health, University of Sydney, 2013. http://hdl.handle.net/2123/9119 (accessed Mar 2014).
- 14. Quan H, Li B, Couris CM, et al. Updating and validating the Charlson comorbidity index and score for risk adjustment in hospital discharge abstracts using data from 6 countries. Am J Epidemiol 2011; 173: 676-682.
- 15. Australian Bureau of Statistics. Socio-Economic Indexes for Areas (SEIFA) - Technical Paper, 2006. Canberra: ABS, 2008. (ABS Cat. No. 2039.0.55.001.) http://www.abs.gov.au/ausstats/abs@.nsf/mf/2039.0.55.001 (accessed May 2013).
- 16. Iezzoni LI. Risk adjustment for medical effectiveness research: an overview of conceptual and methodological considerations. J Investig Med 1995; 43: 136-150.
- 17. Department of Health and Aged Care. Measuring remoteness: Accessibility/Remoteness Index of Australia (ARIA) revised edition. Canberra: Commonwealth of Australia, 2001. (Occasional papers: new series no. 14.) http://www.health. gov.au/internet/main/publishing.nsf/Content/historical-publications-lp (accessed Mar 2014).
- 18. Capanu M, Gönen M, Begg CB. An assessment of estimation methods for generalized linear mixed models with binary outcomes. Stat Med 2013; 32: 4550-4566.
- 19. Larsen K, Petersen JH, Budtz-Jørgensen E, Endahl L. Interpreting parameters in the logistic regression model with random effects. Biometrics 2000; 56: 909-914.
- 20. Kelly M, Sharp L, Dwane F, et al. Factors predicting hospital length-of-stay and readmission after colorectal resection: a population-based study of elective and emergency admissions. BMC Health Serv Res 2012; 12: 77.
- 21. Davila JA, Rabeneck L, Berger DH, El-Serag HB. Postoperative 30-day mortality following surgical resection for colorectal cancer in veterans: changes in the right direction. Dig Dis Sci 2005; 50: 1722-1728.
- 22. Osler M, Iversen LH, Borglykke A, et al. Hospital variation in 30-day mortality after colorectal cancer surgery in Denmark: the contribution of hospital volume and patient characteristics. Ann Surg 2011; 253: 733-738.
- 23. Frederiksen BL, Osler M, Harling H; Danish Colorectal Cancer Group, et al. The impact of socioeconomic factors on 30-day mortality following elective colorectal cancer surgery: a nationwide study. Eur J Cancer 2009; 45: 1248-1256.
- 24. Iversen LH, Harling H, Laurberg S, Wille-Jørgensen P. Influence of caseload and surgical speciality on outcome following surgery for colorectal cancer: a review of evidence. Part 1: short-term outcome. Colorectal Dis 2007; 9: 28-37.
- 25. Cancer Institute NSW. Onwards and upwards for 40-year-old registry. Incite: Journal of the Cancer Institute NSW 2012; 10. http://www. cancerinstitute.org.au/incite/issue-10/onwards-and-upwards-for-40-year-old-registry (accessed May 2013).
- 26. Larsen K, Merlo J. Appropriate assessment of neighborhood effects on individual health: integrating random and fixed effects in multilevel logistic regression. Am J Epidemiol 2005; 161: 81-88.
- 27. Clarke AL, Shearer W, McMillan AJ, Ireland PD. Investigating apparent variation in quality of care: the critical role of clinician engagement. Med J Aust 2010; 193 (8 Suppl): S111-S113. <MJA full text>
Abstract
Objective: To identify predictors of variation in colorectal cancer care and outcomes in New South Wales.
Design, setting and patients: Multilevel logistic regression analysis using a linked population-based dataset based on the records of patients with cancer of the colon, rectosigmoid junction or rectum who were registered in 2007 and 2008 by the NSW Central Cancer Registry and treated in 105 hospitals in NSW.
Main outcome measures: Six outcome measures (30-day mortality, 28-day emergency readmission, prolonged length of stay, 30-day wound infection, 90-day venous thromboembolism, 1-year mortality) and five care process measures (discussion at multidisciplinary team [MDT] meeting, documented cancer stage, recorded pathological stage, treatment within 31 days of decision to treat, treatment within 62 days of referral).
Results: We analysed data for 6890 people. There was wide variation between hospitals in care process measures, even after adjusting for patient and hospital factors. Older adults were less likely to be discussed at an MDT meeting and receive treatment within suggested time frames (all P < 0.001 for colon cancer). Increasing patient age, greater extent of disease, higher Charlson comorbidity score and resection after emergency admission consistently showed strong evidence of an association with poor outcomes. Much of the variation between hospitals in outcome measures was accounted for by patient characteristics.
Conclusions: Patient characteristics should be included in risk-adjustment models for comparing outcomes between hospitals and for quantifying hospital variation. Further exploration of the reasons why certain hospitals and patients appear to be at risk of poorer care is needed.