




Volume 200 - Issue 3
Realigning Medicare: further changes in general practitioner consultation delivery rates
Author: Michael J Taylor
Med J Aust 2014; 200 (3): 151-152. || doi: 10.5694/mja13.11004
Published online: 17 February 2014
Published online: 17 February 2014
We need a better understanding of the effects of policy levers on general practice before adjusting Medicare further
To the Editor: A 2010 research paper published by the Journal showed long-term changes to Medicare-subsidised general practitioner consultations.1 Long (level C and D) consultations declined considerably between 2005 and the end of the study in 2009. The decline was not explained by the introduction of special items (eg, chronic disease management items) onto the Medicare Benefits Schedule (MBS). Level A consultations increased substantially over the same period. Subsequent research showed that two different supply-side changes underpinned the changes in level C and D consultation rates.2
In May 2010, MBS requirements for these standard consultations were substantially simplified;3 although debate about ever-increasing MBS complexity continued.4,5 The ability of the May 2010 changes to reverse the decline in long consultations — and thus realign Medicare with long-term health policy objectives — was uncertain.
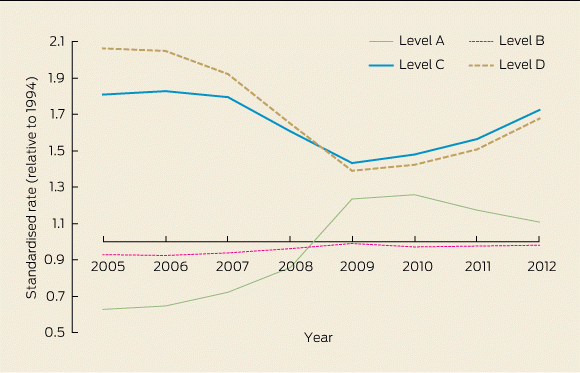
For this update, Medicare and population data were obtained to extend the original analysis from 2009 through to the end of 2012, using the previously documented methods and sources.1 Age–sex-standardised rates were expressed relative to 1994 rates, as per the original study (Box). Level A–D consultations included Group A1 and A18 GP attendances, as well as comparable Group A2 and A19 non-referred attendance items.3
Since 2009, it appears that the decline in long consultation delivery rates has been reversed. For Level C consultations, the delivery rate increased from its nadir of 452 consultations per 1000 population per year in 2009 to 544 per 1000 in 2012 (a 20% increase). A similar percentage increase in the Level D consultation rate was observed; alongside a 10% decrease in the Level A consultation rate over the same period. Special items (for health assessment, chronic disease management and mental health care) continued to increase, from about 230 services per 1000 population in 2009 to 330 per 1000 in 2012.
Although other supply and demand factors will also be responsible for these changes, the overall results show that the GP consultation pattern is quite labile. The relevant “policy levers” (ie, the May 2010 reforms and the MBS generally) and their practice- and practitioner-level effects must be better understood before further adjustments are made.
Competing interests
No relevant disclosures.
References
- Taylor MJ, Horey D, Livingstone C, Swerissen H. Decline with a capital D: long-term changes in general practice consultation patterns across Australia. Med J Aust 2010; 193: 80-83. BABJJGDE
- Taylor MJ, Horey D, Livingstone C, et al. General practitioners and consultation drift: the effects of supply-side changes and reforms on service delivery patterns. Aust Health Rev 2013; 37: 574-578. i1142880
- Australian Government Department of Health and Ageing. Medical Benefits Schedule Online. Canberra: DoHA, 2010. http://www.health.gov.au/internet/mbsonline/publishing.nsf/Content/Medicare-Benefits-Schedule-MBS-1 (accessed Aug 2013).
- Masters CS, Watt MI. Professional Services Review: unnatural justice. Med J Aust 2012; 196: 20-21. i1142886
- Webber TD. What is wrong with Medicare [letter]? Med J Aust 2012; 196: 240. i1142889
Shifting focus to adolescent wellbeing and inclusive participation in the digital age
Allyson R Todd, Elena Wang, Stephanie R Partridge
The clinical presentation, investigation, and management of women diagnosed with endometriosis in Australian general practices, 2011–2021: an open cohort study
Danielle Mazza, Kailash Thapaliya, Sharinne B Crawford, Alissia Hui, Maryam Moradi, Luke E Grzeskowiak
The impact of the Breast Screen NSW transition from film to digital mammography, 2002–2016: a linked population health data analysis
Rachel Farber, Nehmat Houssami, Katy J L Bell
Non‐technical errors associated with deaths in surgical care, Australia, 2012–2019, by surgical specialty (Australian and New Zealand Audit of Surgical Mortality): a retrospective cohort study
Jesse Ey, Victoria Kollias, Octavia Lee, Kelly Hou, Matheesha Herath, John B North, Ellie Treloar, Suzanne Edwards, Martin Bruening, Adam J Wells, Guy J Maddern
The CURE Asthma roadmap
Gary P Anderson, Anthony Flynn, Phil G Bardin, John D Blakey, Shyamali C Dharmage, Paul Foster, Peter G Gibson, Adam Jaffe, Alan James, Christine R Jenkins, Sundram Sivamalai, Peter D Sly, Guy B Marks, Vanessa M McDonald, Judy Wetttenhall
Evidence from Australian cohort studies about asthma trajectories and transitions across the life course: a narrative review
Caroline Lodge, Xin Dai, Ingrid A. Laing, Michael P Menden, Anthony Flynn, Gary P Anderson, Sarath Ranganathan, Shyamali C Dharmage