


The Australian state of Queensland experienced severe flooding in the summer of 2010–2011; more than 78% of the state was declared a disaster zone1 and damage to public infrastructure totalled over $6 billion.2 Climate change projections predict more intense and more frequent weather-related disasters and increasing public health burdens.3 Experiencing traumatic events can be causally related to mood and anxiety disorders, potentially initiating psychosocial stressors (eg, unemployment or underemployment, displacement, relationship disturbance), and further symptoms.4 Emotional trauma leading to adverse psychiatric outcomes is an important and increasingly likely public health concern.
Data were collected as part of the Queensland Government’s annual Self-Reported Health Status (SRHS) survey by means of computer-assisted telephone interviews from 11 March to 6 June 2011.5 Households were sampled by random-digit dialling to interview one person aged 16 years or older per household; the SRHS survey included 12 564 people, representing a response rate of 44%. Data were weighted for probability of selection based on the number of fixed phone lines and eligible people in the household and by age, sex and health region.
The SRHS survey monitors numerous health indicators, so respondents were randomly allocated survey modules to reduce participant burden. The module relevant to this study assessed disaster-related exposures or impacts (Appendix 1), and had items covering “damage exposure”, being “affected” (by exposure to specific damage and “in any way”) and “emotional impacts”. Remoteness6 and the Socio-Economic Indexes For Areas (SEIFA) Index of Relative Socio-Economic Advantage and Disadvantage (IRSAD) quintile7 were assigned according to respondents’ residential areas.
A total of 6104 respondents (aged 18 years or older) received the natural disaster modules of the SRHS pertinent to this report (Appendix 2).
Two-thirds of respondents (62%) reported being “affected in any way” by the 2010–2011 weather-related disasters (Appendix 3). About a third (37.2%) had damage to their own suburb or local area, or to the home of a significant other (family member, friend or carer). Damage to their own homes was reported by 9.2%, and 11.7% reported damage to an income-producing property that they owned. Not all respondents who reported damage exposure considered themselves affected, with 80% of those reporting suburb damage and 90% reporting income-producing property or own home damage reporting being affected in any way.
Those aged under 55 years were more likely than older adults to have been exposed to and affected by each type of property damage. Those aged 18–24 years were 2.7 times more likely than those aged 75 years or over to report damage to their home (10.8% and 4.0%, respectively). Additionally, 94% of those aged 18–24 years reported being affected by that damage compared with 85% of those aged 75 years or over (Appendix 3). Reduced income was reported by 17%, with men and young to mid-aged adults most often reporting income loss (Box 1). Retirees were about half as likely to have been affected by any type of damage, reporting less damage or income loss.
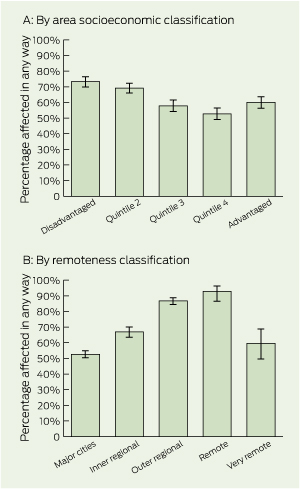
Residents of the most disadvantaged IRSAD quintile were up to 39% more likely to be affected than those in more advantaged quintiles (Box 2). However, owing to a J-shaped relationship, they were 22% more likely to be affected than those in the most advantaged quintile.
More people were affected by the disasters in regional and remote Queensland than in major cities (Box 2). Residents of regional and remote areas also experienced more damage. In major cities, a quarter reported local area damage; such damage in inner regional, outer regional and remote areas was 51%, 60% and 64%, respectively. Similarly, income-producing property damage was 8% in major cities compared with 13%, 20% and 37% for these same non-metropolitan areas (Appendix 3). Residents of regional and remote areas were much more likely than were city residents to report disaster-related income loss (Box 1).
One in 25 respondents (3.9%) thought they might be “badly injured or die” during the disasters (Box 1). Retirees were up to 68% less likely to report this than other Queenslanders. Compared with adults living in major cities, those from remote and outer regional areas were four to six times more likely to report this impact. One in seven respondents (14.3%) felt “terrified, helpless or hopeless” after the disasters (84% higher among women than men). Consistent with patterns of damage exposure and being affected by the disasters, the prevalence of feeling terrified, helpless or hopeless was higher among those in the most disadvantaged area socioeconomic quintile, working-age people (though less so among those aged 18–24 years), and those in outer regional and remote areas.
Between 2 and 5 months after the disasters, 7.1% of respondents (about 240 000) were “still currently distressed” (Box 1). Current distress was particularly common among women and those living in remote areas. Of those still distressed, one in six (about 40 000) were distressed “all or most of the time”, and almost 300 000 adults were “worried about how they would manage” (with a higher prevalence among middle-aged adults, unemployed people and those living in outer regional and remote areas). Among those still worried, over a third (about 100 000) were worried “all or most of the time”.
About 1.7 million Queensland adults were affected in some way by the 2010–2011 floods and cyclones, and the prevalence of trauma found in this study is consistent with that in other studies that used diagnostic instruments.3,4,8-13 Here, as around the world,14 weather-related disasters most severely harm those with the greatest underlying vulnerability — residents of disadvantaged areas and those living in rural and, especially, remote areas. Adults of working age were also disproportionately affected, perhaps reflecting greater likelihood that this age group participates in the labour force, owns an income-producing property, and is financially responsible for dependents. These three categories of Queenslanders were the most likely to experience reduced income, property damage and emotional impacts. Unexpectedly, despite similar exposures and young people generally having a higher incidence of psychiatric presentations, the youngest participants did not report elevated traumatic reactions; this requires further investigation. In addition, perhaps reflecting Brisbane’s premium riverside residential properties (areas that experienced extensive flooding), a higher prevalence of exposure to or being affected by damage and, to a lesser extent, reporting emotional impacts, were also observed among those living in the most advantaged socioeconomic areas.
Complex, persistent disadvantage (marginalisation) is strongly related to chronic poor mental health and social exclusion in Australia.15 Additionally, residents of rural and remote Australia have worse health than their urban peers, partly because of higher levels of disadvantage and poor access to services.16 These disadvantages are clearly exacerbated and made more complex in the context of disasters, and this has implications for disaster preparedness planning and the delivery of services after a disaster.
Exposure to trauma is a common experience over a lifetime,10,17 but it is unusual for such widespread impacts to occur in a compressed time and place. High levels of perceived threat indicate that many people would likely have experienced an acute stress disorder. Many will experience a decline in symptoms of these over the first year18 with a small percentage developing post-traumatic stress disorder (PTSD). Nevertheless, given the numbers affected by this disaster, a substantial burden of disease is likely after a disaster. Our finding that about 240 000 adults reported persisting distress 2 to 5 months after the disaster should alert clinicians, families and friends to the possibility of symptoms of mood, anxiety and other disorders among people affected by natural disasters.
The large number of individuals with possible PTSD or another postdisaster mental health problem reinforces recommendations that all health and social care workers should be aware of the psychological impact of traumatic events.4 Health services and clinicians must collaborate to develop realistic, cost-effective and rapid-deployment mass interventions in the event of weather disasters. Our findings also clearly indicate the need for an increasing focus on disaster prevention and preparedness.19 Given the well documented excess vulnerability of children, and their unavoidable exclusion from this study, further research should focus on the disaster preparedness and response needs of children specifically. For all people, clinicians will need access to simple screening tools for use before disasters to help identify those most at risk, and simple postdisaster screening tools to identify quickly and easily people with symptoms of psychological trauma.
Limitations of our study include the low response rate and the fixed-phone-line-only sampling frame. The response bias appears minimal, based on sample representativeness (Appendix 4) and comparison with previous SRHS surveys.20 Fixed-phone-line-only sampling may underestimate the prevalence of emotional affects of weather-related trauma due to displacement, but excluding mobile-only households may introduce bias.
Received 13 March 2013, accepted 9 July 2013
- Susan L Clemens1
- Helen L Berry2
- Brett M McDermott3
- Catherine M Harper1
- 1 Department of Health, Queensland Government, Brisbane, QLD.
- 2 Faculty of Health, University of Canberra, Canberra, ACT.
- 3 Mater Medical Research Institute, Brisbane, QLD.
We are grateful to the Regional and Rural Research and Development Grants Program for funding to support this project.
No relevant disclosures.
- 1. Queensland Floods Commission of Inquiry. Queensland Floods Commission of Inquiry interim report. Brisbane: QFCI, 2011. http://www.floodcommission.qld.gov.au/publications/interim-report (accessed Jul 2013).
- 2. Price Waterhouse Coopers. Economic impact of Queensland’s natural disasters. Brisbane: Price Waterhouse Coopers, 2011.
- 3. Meehl GA, Arblaster JM, Tebaldi C. Contributions of natural and anthropogenic forcing to changes in temperature extremes over the United States. Geophys Res Lett 2007; 34: L19709. doi: 10. 1029/2007GL030948.
- 4. National Collaborating Centre for Mental Health. Post-traumatic stress disorder (PTSD): the management of PTSD in adults and children in primary and secondary care. Clinical Guideline 26. London: National Institute for Clinical Excellence, 2005. http://guidance.nice.org.uk/CG26/NICEGuidance/pdf/English (accessed Jul 2013).
- 5. Queensland Government Department of Health. Health surveys [website with link to health surveys]. http://www.health.qld.gov.au/epidemiology/publications/health-surveys.asp (accessed May 2013).
- 6. Australian Bureau of Statistics. Statistical geography volume 1 - Australian standard geographical classifications (ASGC). Canberra: ABS, 2006. (ABS Cat. No. 1216.0.) http://www.abs.gov.au/AUSSTATS/abs@.nsf/Lookup/1216.0Main+Features1Jul%202006?OpenDocument (accessed Jul 2013).
- 7. Australian Bureau of Statistics. Census of population and housing: Socio-Economic Indexes for Areas (SEIFA), Australia - data only, 2006. Canberra: ABS, 2008. (ABS Cat. No. 2033.0.55.001.) http://www.abs.gov.au/AUSSTATS/abs@.nsf/allprimarymainfeatures/356A4186CCDDC4D1CA257B3B001AC22C?opendocument (accessed Jul 2013).
- 8. Andrews G, Hall W, Teeson M, Henderson S. National Survey of Mental Health and Wellbeing, report 2: the mental health of Australians. Canberra: Commonwealth Department of Health and Aged Care, 1999.
- 9. Australian Bureau of Statistics. National Survey of Mental Health and Wellbeing: summary of results, 2007. Canberra: ABS, 2007. (ABS Cat. No. 4326.0.) http://www.abs.gov.au/ausstats/abs@.nsf/mf/4326.0 (accessed Jul 2013).
- 10. Creamer M, Burgess P, McFarlane AC. Post-traumatic stress disorder: findings from the Australian National Survey of Mental Health and Well-being. Psychol Med 2001; 31: 1237-1247.
- 11. McDermott BM, Cobham VE. Family functioning in the aftermath of a natural disaster. BMC Psychiatry 2012; 12: 55.
- 12. McDermott BM, Palmer LJ. Postdisaster emotional distress, depression and event-related variables: findings across child and adolescent developmental stages. Aust N Z J Psychiatry 2002; 36: 754-761.
- 13. Ursano RJ, Bell C, Eth S, et al. Practice guideline for the treatment of patients with acute stress disorder and posttraumatic stress disorder. Am J Psychiatry 2004; 161 (11 Suppl): 3-31.
- 14. McMichael AJ, Friel S, Nyong A, Corvalan C. Global environmental change and health: impacts, inequalities, and the health sector. BMJ 2008; 336: 191-194.
- 15. Berry H, Butterworth P, Caldwell T, Rodgers B. Contemporary Australian archetypes: different people, different needs. Social Policy Research Paper No. 32. Canberra: Commonwealth of Australia, 2008. http://www.fahcsia.gov.au/about-fahcsia/publications-articles/research-publications/social-policy-research-paper-series/number-32-contemporary-australian-archetypes-different-people-different-needs (accessed Jul 2013).
- 16. Smith KB, Humphreys JS, Wilson MG. Addressing the health disadvantage of rural populations: how does epidemiological evidence inform rural health policies and research? Aust J Rural Health 2008; 16: 56-66.
- 17. Costello EJ, Erkanli A, Fairbank JA, Angold A. The prevalence of potentially traumatic events in childhood and adolescence. J Trauma Stress 2002; 15: 99-112.
- 18. Kessler RC, Sonnega A, Bromet E, et al. Posttraumatic stress disorder in the National Comorbidity Survey. Arch Gen Psychiatry 1995; 52: 1048-1060.
- 19. Steffen W, Hughes L, Karoly D. The critical decade: extreme weather. Canberra: Climate Commission Secretariat, Department of Industry, Innovation, Climate Change, Science, Research and Tertiary Education, 2013. http://climatecommission.gov.au/report/extreme-weather (accessed Jul 2013).
- 20. Queensland Health. The health of Queenslanders 2012: advancing good health. Fourth report of the Chief Health Officer Queensland. Brisbane: Queensland Health, 2012. http://www.health.qld.gov.au/cho_report/2012/documents/2012-cho-report-all.pdf (accessed May 2013).
Abstract
Objectives: To assess the population prevalence of property, income and emotional impacts of the 2010–2011 Queensland floods and cyclones.
Design, setting and participants: Cross-sectional telephone-based survey using a brief trauma exposure and impact screening instrument, conducted between 11 March and 6 June 2011, of 6104 adults who answered natural disaster and mental health questions.
Main outcome measures: Natural disaster property damage exposure and emotional wellbeing impacts.
Results: Two-thirds of respondents (62%) reported being affected by the disasters, with property damage exposure ranging from 37.2% (suburb or local area) to 9.2% (own home, with 2.1% living elsewhere at least temporarily). Income was reduced for 17.0% of respondents and 11.7% of income-producing property owners reported damage to those properties. Trauma impacts ranged from 14.3% of respondents feeling “terrified, helpless or hopeless” to 3.9% thinking they might be “badly injured or die”. Up to 5 months after the disasters, 7.1% of respondents were “still distressed” and 8.6% were “worried about how they would manage”. Adults of working age and residents of regional and remote areas and of socioeconomically disadvantaged areas were disproportionately likely to report exposure to damage and emotional impacts.
Conclusions: Weather-related disasters exact a large toll on the population through property damage and resultant emotional effects. Vulnerable subpopulations are more severely affected. There is a need for realistic, cost-effective and rapid-deployment mass interventions in the event of weather disasters.