




Volume 199 - Issue 7
Trends in general practice services in two cohorts of Australian children between 2003–2004 and 2010–2011
Authors: Lixin Ou, Jack Chen and Kenneth Hillman
Med J Aust 2013; 199 (7): 460-461. || doi: 10.5694/mja13.10105
Published online: 7 October 2013
Published online: 7 October 2013
To the Editor: Despite concerns about suspected reductions in general practitioner visits for Australian children,1,2 there has been a lack
of research to investigate trends
in GP visits over the past decade.
We explored trends in GP visits using linked data between the Medicare Benefits Schedule (MBS) database and the consecutive biannual survey (2004-2010) of two cohorts - the infant cohort (aged 0-1 years in 2004) and ...
To the Editor: Despite concerns about suspected reductions in general practitioner visits for Australian children,1,2 there has been a lack of research to investigate trends in GP visits over the past decade.
We explored trends in GP visits using linked data between the Medicare Benefits Schedule (MBS) database and the consecutive biannual survey (2004–2010) of two cohorts — the infant cohort (aged 0–1 years in 2004) and the child cohort (aged 4–5 years in 2004) — from the nationally representative Longitudinal Study of Australian Children (LSAC).3 GP visits were extracted from the MBS with item numbers 1–51, 597, 599, 601, 602, 5000–5067 and 715 between 1 March 2002 and 28 February 2011. The number of GP visits in each year was calculated for the period from 1 March to 28 February of the next year.
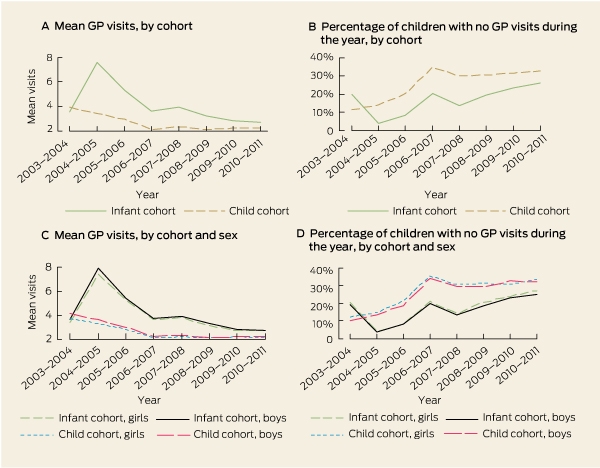
Among 9385 children enrolled in the study (4779 in the infant cohort and 4606 in the child cohort), the mean number of GP visits in the infant cohort decreased from 7.6 in 2004–2005 to 2.7 in 2010–2011; a transient increase in GP visits occurred between 2003–2004 and 2004–2005 (Box).
After adjustment for demographic and health outcome variables, the decrease still persisted from 2008–2009 to 2010–2011. Between 2003–2004 and 2010–2011, the percentage of children without annual GP visits increased from 19.8% to 25.9% in the infant cohort, and from 11.4% to 32.7% in the child cohort.
We also compared the number of GP visits for the same age groups between the two cohorts, and found that the average number of visits for 3–4-year-old children in the infant cohort in 2006–2007 was significantly lower than that for children of the same age in the child cohort in 2002–2003 (3.6 v 4.1 visits; P < 0.001). Similar relationships were found for 5–6-year-olds in the infant cohort in 2008–2009 compared with children of the same age in the child cohort in 2004–2005 (3.2 v 3.4 visits; P = 0.01), and for 6–7-year-olds in the infant cohort in 2009–2010 compared with children of the same age in the child cohort in 2005–2006 (2.8 v 2.9 visits; P = 0.03). However, the visits for 7–8-year-olds in the infant cohort in 2010–2011 were significantly higher than for children of the same age in the child cohort in 2006–2007 (2.6 v 2.1; P < 0.001).
Our study showed that GP visits peaked around 2 years after birth and decreased afterwards in both cohorts. There was evidence suggesting a decline in the number of GP visits among children in the infant cohort compared with children of the same age in the child cohort between 2006–2007 and 2009–2010, which raises concern about possible underutilisation of primary care among vulnerable groups and may warrant further policy considerations.4,5 The recent increase in visits (2010–2011) among the children in the infant cohort compared with children of the same age in the child cohort should be further confirmed.
Comparison of annual general practitioner visits* among children in two cohorts of the Longitudinal Study of Australian Children,3 by cohort and sex
* The number of GP visits in each year was calculated for the period from 1 March to 28 February of the next year.
Competing interests
No relevant disclosures.
Acknowledgements
This study used unit record data from Growing up in Australia: the Longitudinal Study of Australian Children (LSAC). The LSAC was conducted in partnership between the Department of Families, Housing, Community Services and Indigenous Affairs (FaHCSIA), the Australian Institute of Family Studies (AIFS) and the Australian Bureau of Statistics (ABS). The findings and views reported in this paper are our own and should not be attributed to FaHCSIA, AIFS or the ABS.
References
- Freed GL, Sewell JR, Spike NA. Challenges to children’s health care in an ageing Australia. Med J Aust 2011; 195: 436-437. 0_CBBCAIHB
- Britt H, Miller GC, editors. General practice in Australia, health priorities and policies 1998 to 2008. Canberra: AIHW, 2009. (AIHW Cat. No. GEP 24; General Practice Series No. 24.) http://www.aihw.gov.au/publication-detail/?id=6442468257 (accessed Sep 2013).
- Sanson A, Nicholson J, Ungerer J, et al. LSAC discussion paper no. 1: introducing the Longitudinal Study of Australian Children. Melbourne: Australian Institute of Family Studies, 2002. http://www.aifs.gov.au/growingup/pubs/discussion/dp1/index.html (accessed Jan 2013).
- Ou L, Chen J, Garrett P, Hillman K. Ethnic and Indigenous access to early childhood healthcare services in Australia: parents’ perceived unmet needs and related barriers. Aust N Z J Public Health 2011; 35: 30-37. 0_i1142885
- Poulton R, Caspi A, Milne BJ, et al. Association between children’s experience of socioeconomic disadvantage and adult health: a life-course study. Lancet 2002; 360: 1640-1645. 0_i1142889
Shifting focus to adolescent wellbeing and inclusive participation in the digital age
Allyson R Todd, Elena Wang, Stephanie R Partridge
The clinical presentation, investigation, and management of women diagnosed with endometriosis in Australian general practices, 2011–2021: an open cohort study
Danielle Mazza, Kailash Thapaliya, Sharinne B Crawford, Alissia Hui, Maryam Moradi, Luke E Grzeskowiak
The impact of the Breast Screen NSW transition from film to digital mammography, 2002–2016: a linked population health data analysis
Rachel Farber, Nehmat Houssami, Katy J L Bell
Non‐technical errors associated with deaths in surgical care, Australia, 2012–2019, by surgical specialty (Australian and New Zealand Audit of Surgical Mortality): a retrospective cohort study
Jesse Ey, Victoria Kollias, Octavia Lee, Kelly Hou, Matheesha Herath, John B North, Ellie Treloar, Suzanne Edwards, Martin Bruening, Adam J Wells, Guy J Maddern
The CURE Asthma roadmap
Gary P Anderson, Anthony Flynn, Phil G Bardin, John D Blakey, Shyamali C Dharmage, Paul Foster, Peter G Gibson, Adam Jaffe, Alan James, Christine R Jenkins, Sundram Sivamalai, Peter D Sly, Guy B Marks, Vanessa M McDonald, Judy Wetttenhall
Evidence from Australian cohort studies about asthma trajectories and transitions across the life course: a narrative review
Caroline Lodge, Xin Dai, Ingrid A. Laing, Michael P Menden, Anthony Flynn, Gary P Anderson, Sarath Ranganathan, Shyamali C Dharmage