


Variation in clinical practice has been reported in many medical disciplines.1 Reducing unwarranted practice variation is important where it influences health outcomes, health care costs, and provision of appropriate and patient-focused care.1
From 2000 to 2009, the caesarean section (CS) rate in Australia increased from 23% to 32%,2 one of the 11 highest rates in Organisation for Economic Co-operation and Development countries.3 This is well above the United Kingdom Royal College of Obstetricians and Gynaecologists recommended CS rate of 20%4 and the United States Department of Health and Human Services Healthy People 2010 goal of 15% for nulliparous women at low-risk.5 In Australia, CS rates vary by state and territory (from 28% in the Australian Capital Territory to 33% in both Queensland and Western Australia), between public and private hospitals (28% and 43%, respectively), and among individual public hospitals.2 This variation is potentially attributable to differences in women’s risk profiles, preferences and expectations, and local maternity care practices.6 Identifying and better understanding the drivers of this variation may have a significant and important impact on maternity care reform in Australia.7
To date, comparison of CS rates among hospitals has primarily been based on two approaches. The first approach compares hospital CS rates only among nulliparous women who give birth to a cephalic presenting singleton baby at term.8,9 However, this is of limited value for generalising the results to the whole maternity population. Other studies have extended this approach and categorised births into clinically homogeneous groups according to combinations of pregnancy characteristics, most commonly using a classification proposed by Robson.10,11 This risk-based approach allows comparison of CS rates either among different hospitals or within the same hospital over time, as well as identifying the contribution of each group to the overall CS rate. Although the risk-based approach allows a more meaningful comparison among hospitals by eliminating potential confounding effects of some pregnancy characteristics, it does not take into account other maternal factors (eg, maternal age and medical conditions) that influence rates.11 For example, a hospital with a high proportion of older women may have a higher CS rate.12
Quantifying divergent hospital CS rates after adjustment for maternal and pregnancy characteristics (casemix) is important for determining the role that differences in clinical practice play in the variation in CS rates at a hospital level. Identification of demonstrably achievable CS rates may help prioritise interventions to enhance maternity care.6 The aims of our study were to: assess recent hospital CS rates in New South Wales, adjusted for casemix; quantify the amount of variation that can be explained by casemix differences; and examine the potential impact on the overall CS rate of reducing variation in practice.
We obtained data from longitudinally linked birth records of the NSW Perinatal Data Collection (PDC). The PDC is a legislated population-based surveillance system covering all live births and stillbirths of at least 20 weeks’ gestation or at least 400 grams birthweight in NSW. The following obstetric information was available and is reliably reported in the PDC:13,14 maternal age, country of birth of the mother, parity, plurality, onset of labour (spontaneous labour, induced or no labour), CS in the previous and current pregnancies, fetal presentation, gestational age, maternal smoking, diabetes (pre-existing or gestational), hypertension (chronic or gestational hypertension, or pre-eclampsia), and type of maternity care (private care in a private hospital, private care in a public hospital or public care in a public hospital).
Record linkage was carried out by the NSW Centre for Health Record Linkage (CHeReL, http://www.cherel.org.au). For this study, the CHeReL reported the quality of the record linkage as 3 in 1000 false positive links and < 5 in 1000 missed links.
The study population included women giving birth (referred to as births) in NSW public and private hospitals in 2009 and 2010 (Appendix). The primary outcome was the CS rate for each hospital. Multifetal births were counted as a single CS if one or more of the infants were delivered by CS; all other multifetal births were counted as single vaginal births. Hospitals with continuous maternity services during the study period and with ≥ 50 births per annum were included in the study. Hospitals with a midwifery-only service (CSs not done) were excluded. To examine variation in hospital CS rates for preterm births, we included only those hospitals with a service capability to manage preterm infants.15 Although some preterm births occurred as emergencies in other hospitals (308 at 30 hospitals; 0.2% of preterm births), they do not contribute to the understanding of variation and so were excluded.
Births were categorised into 10 risk-based, mutually exclusive groups according to the Robson classification (Robson group). These 10 groups are inclusive of all births, and are based on a woman’s pregnancy characteristics including parity, plurality, onset of labour, previous CS, fetal presentation and gestational age (Box 1).16 When information on parity and previous CS was missing for the current pregnancy (2449 births [1.3%]), it was obtained from linked historical birth records where available. Consequently, only 721 records (0.4%) with missing information on one or more of the maternal or pregnancy characteristics were excluded from the analysis (Appendix).
For each Robson group we determined the number of births, number of CSs, observed CS rate and contribution to the overall CS rate. Because of the hierarchical structure of the data (births nested within hospitals), multilevel logistic regression with a random intercept for each hospital was used to examine variation in hospital CS rates for each of the 10 Robson groups, adjusting for casemix (all the factors as listed in Box 2) while taking into account similarities of births within hospitals.17
Two models were fitted for each Robson group: a crude model (with no adjustment) and an adjusted model. Within each group, the risk-adjusted CS rate and 95% confidence interval for each hospital were calculated by first converting the hospital’s estimated odds ratio for CS obtained from the multilevel logistic regression model into a relative risk and then multiplying by the statewide rate.18 To describe the variation in hospital CS rates, we standardised the ranges of the 95% confidence intervals for risk-adjusted hospital CS rates. Variation in CS rates was classified as low (where the standardised difference between the highest upper confidence bound and the lowest lower confidence bound was < 0.3), medium (standardised confidence interval range, 0.3–0.6), or high (standardised confidence interval range, > 0.6). The proportion of variation among hospitals explained by adjusting for casemix was calculated as the difference between the variation of the crude and adjusted models, as a proportion of the crude model variation. To illustrate differences in hospital CS rates after adjustment, risk-adjusted CS rates with 95% confidence intervals were plotted for each Robson group.
We explored the potential impact of reducing variation in CS practice by calculating the 20th centile of the risk-adjusted hospital CS rate for each Robson group and overall. The 20th centile rate has been suggested as the “best practice” rate;19,20 it represents the rate of CS at or below which 20% of hospitals are currently operating and is demonstrably achievable. Data were analysed using SAS version 9.3 (SAS Institute Inc).
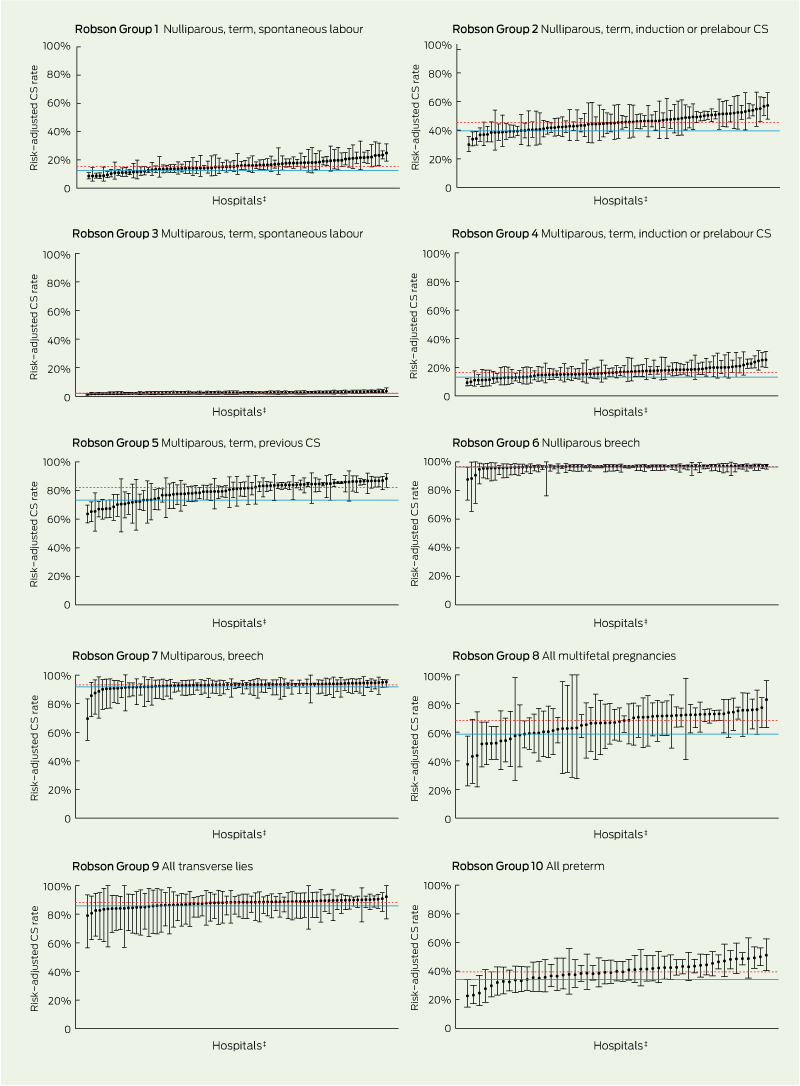
Of the 183 310 births at 81 hospitals included in our analysis, 56 696 were by CS, giving an overall CS rate of 30.9%. Hospital CS rates varied from 11.8% to 47.4% (interquartile range, 23.9%–33.1%; data not shown). Compared with women who had a vaginal birth, women who had a CS were more likely to be older, Asian-born and nulliparous. Having had a previous CS, diabetes, hypertension, private maternity care and preterm birth were also associated with an increased likelihood of CS (Box 2). The observed CS rate within the 10 Robson groups ranged from 2.3% among multiparous women with spontaneous labour at term to 96.7% births among nulliparous women with breech presentation (Box 1). The risk-adjusted hospital CS rates and their 95% confidence intervals for each Robson group are shown in Box 3.
Three groups accounted for 70.9% of all CSs: women who had had a previous CS (Group 5, 36.4%); nulliparous women with induction or prelabour CS at term (Group 2, 23.4%); and nulliparous women with spontaneous term births (Group 1, 11.1%) (Box 1).
After accounting for casemix, medium to high unexplained variation in CS rates among hospitals persisted for the following Robson groups: nulliparous women at term (Group 1, spontaneous; Group 2, induction or prelabour CS), women who had had a previous CS (Group 5), multifetal pregnancies (Group 8) and preterm births (Group 10) (Box 1 and Box 3). Casemix explained only 19.7%, 36.0%, 17.3% and 19.0% of the variation among hospitals for Robson groups 1, 2, 5 and 10, respectively (Box 1). Conversely, the largest proportion of variation in hospital CS rates explained by casemix was for multiparous women with breech presentation (Group 7); the degree of variation was medium for this group. In contrast, adjustment for casemix slightly increased the between-hospital variation (by 6.0%) for multiparous women with spontaneous labour at term (Group 3), although the variation remained low for this group (Box 1).
In the period 2009–2010 in NSW hospitals, almost one in three women gave birth by CS, and the CS rates varied considerably among hospitals overall and within risk-based groups. Nulliparous women at term and women with previous CS accounted for two-thirds of the overall CS rate. Some hospitals achieved CS rates compatible with international guidelines of 15%–20%.4,5 Wide variation in hospital CS rates persisted after adjusting for casemix, with marked unexplained variation in the following groups: nulliparous women at term; women with previous CS; multifetal pregnancies; and preterm births. Management of these groups appears to be different among hospitals and may present opportunities for practice improvement. However, further research needs to examine whether these differences are supported by differences in outcome. In contrast, negligible unexplained variation was observed for multiparous women with spontaneous labour at term and women with breech presentation.
The Robson classification has been used in single- and multi-institutional studies worldwide, and is recommended as the most appropriate CS classification for auditing and monitoring purposes.21 The Robson classification is useful for prospectively identifying groups of women at risk of CS, since classification is based on a woman’s risk profile rather than on the indications for CS.16 Groups with persisting variation after casemix adjustment suggest lower CS rates are achievable in certain populations. Where these groups also make a large contribution to the overall CS rate, they are priority targets for initiatives to reduce practice variation and caesarean births where appropriate. Reducing variation can be achieved by identifying the best evidence-based practices (those with optimal obstetric outcomes with a minimum of intervention) and translating this knowledge to local circumstances for improvement of maternity care.6 Our study suggests that nulliparous women at term and women with multifetal pregnancies or preterm birth meet these criteria, and together contribute 43.6% of the overall CS rate. In addition, the largest contribution of previous CS to the overall CS rate underscores the importance of mode of birth for the first birth.22 For example, breech presentation, a strong indication for CS and low variation, is avoidable in almost one-third of such births through external cephalic version.23 If variation in practice was reduced to that of hospitals in the lowest 20% for each Robson group, this would equate to an absolute reduction of 3.6% in the overall CS rate, from 30.9% to 27.3%. Over 80% of this decrease is contributed by the five risk-based groups that account for most hospital variation and total CSs.
An international study examining variation in CS rates in more than 47 000 births from tertiary referral centres in nine countries also identified wide between-institutional variation for women with spontaneous cephalic labour at term via the Robson classification.10 However, that study did not take into account casemix factors that could potentially bias the comparative evaluation. A recent study that accounted for sociodemographic and clinical characteristics of the mother and fetus showed reduced variation in hospital CS rates for nulliparous women.11 Furthermore, a UK study investigating variation in CS rates among National Health Service maternity units found the rates of intrapartum CS varied more than the rates of prelabour CS after adjusting for maternal and clinical risk factors, suggesting that future studies should consider analysing intrapartum and prelabour CSs separately.24
The strengths of our study are the use of longitudinally linked population-based data with sufficient numbers of CSs to explore hospital variation even in smaller subpopulations (eg, women with multifetal pregnancies), and the availability of reliably collected and validated labour and birth data. Furthermore, the use of multilevel modelling for risk adjustment allowed inclusion of hospitals with a small number of births and accounting for similarities of births within hospitals. In addition, we used the same casemix factors to ensure risk adjustment was consistent across the Robson groups. However, there is a lack of information on clinical or non-medical factors (such as hospital or individual management styles and practices, clinicians’ attitudes, cultural background and maternal request) that may influence CS.25 Some of this additional information could be obtained in subsequent studies through record linkage to other data sources (eg, hospital data) where a wide range of maternal, clinical and hospital factors are available. We sought initially to understand CS practice variation; further work is required to determine whether any relationship exists with birth outcomes.
1 Caesarean section (CS) rates by Robson 10-group classification, New South Wales, 2009–2010
Received 6 March 2013, accepted 10 July 2013
- Yuen Yi (Cathy) Lee1
- Christine L Roberts1
- Jillian A Patterson1
- Judy M Simpson2
- Michael C Nicholl3
- Jonathan M Morris1
- Jane B Ford1
- 1 Clinical and Population Perinatal Health Research, Kolling Institute, University of Sydney, Sydney, NSW.
- 2 Sydney School of Public Health, University of Sydney, Sydney, NSW.
- 3 Department of Obstetrics and Gynaecology, Northern Clinical School, University of Sydney, Sydney, NSW.
We thank the NSW Ministry of Health for access to the population health data and the NSW Centre for Health Record Linkage for linking the datasets. This work was supported by a National Health and Medical Research Council Centre for Research Excellence Grant (1001066). Christine Roberts is supported by an NHMRC Senior Research Fellowship (APP1021025). Yuen Yi Lee was employed by the NSW Ministry of Health on the NSW Biostatistical Officer Training Program at the time this work was conducted.
No relevant disclosures.
- 1. Kennedy PJ, Leathley CM, Hughes CF. Clinical practice variation. Med J Aust 2010; 193 (8 Suppl): S97-S99. <MJA full text>
- 2. Australian Institute of Health and Welfare. Australia’s mothers and babies 2009. Canberra: AIHW, 2010. (AIHW Cat. No. PER 52; Perinatal Statistics Series No. 25.) http://www.aihw.gov.au/publication-detail/?id=10737420870 (accessed Feb 2013).
- 3. Organisation for Economic Co-Operation and Development. Caesarean sections. In: Health at a glance 2011: OECD Indicators. OECD, 2011. http://www.oecd.org/health/health-systems/healthat aglance2011.htm (accessed Aug 2013).
- 4. Royal College of Obstetricians and Gynaecologists. Making sense of commissioning Maternity Services in England — some issues for Clinical Commissioning Groups to consider. London: RCOG, 2012. www.rcm.org.uk/Easy SiteWeb/GatewayLink.aspx?alId=207370 (accessed Feb 2013).
- 5. US Department of Health and Human Services. Maternal, infant, and child health. In: Healthy people 2010: understanding and improving health. 2nd ed. Washington, DC: US Government Printing Office, 2000. http://www.healthy people.gov/2010/document/html/volume2/16mich.htm (accessed Jun 2013).
- 6. Glantz JC. Obstetric variation, intervention, and outcomes: doing more but accomplishing less. Birth 2012; 39: 286-290.
- 7. Australian Government. Improving maternity services in Australia: a discussion paper from the Australian Government. Canberra: Commonwealth of Australia, 2008. http://www. health.gov.au/internet/main/publishing.nsf/Content/maternityservicesreview-discussion paper (accessed Feb 2013).
- 8. Coonrod DV, Drachman D, Hobson P, Manriquez M. Nulliparous term singleton vertex cesarean delivery rates: institutional and individual level predictors. Am J Obstet Gynecol 2008; 198: 694.e1-e11.
- 9. Stivanello E, Rucci P, Carretta E, et al. Risk adjustment for inter-hospital comparison of caesarean delivery rates in low-risk deliveries. PLOS One 2011; 6: e28060.
- 10. Brennan DJ, Robson MS, Murphy M, O’Herlihy C. Comparative analysis of international cesarean delivery rates using 10-group classification identifies significant variation in spontaneous labor. Am J Obstet Gynecol 2009; 201: 308.e1-e8.
- 11. Colais P, Fantini MP, Fusco D, et al. Risk adjustment models for interhospital comparison of CS rates using Robson’s ten group classification system and other socio-demographic and clinical variables. BMC Pregnancy Childbirth 2012; 12: 54.
- 12. Roberts CL, Rowlands IJ, Nguyen M. The contribution of maternal age to increasing caesarean section rates. Aust N Z J Obstet Gynaecol 2012; 52: 308-309.
- 13. Roberts CL, Bell JC, Ford JB, Morris JM. Monitoring the quality of maternity care: how well are labour and delivery events reported in population health data? Paediatr Perinat Epidemiol 2009; 23: 144-152.
- 14. Taylor LK, Pym M, Bajuk B, et al. Part 8: validation study NSW Midwives Data Collection 1998. New South Wales Mothers and Babies 1998. N S W Pub Health Bull Supplementary Series 2000; 11 (1): 97-99. http://www.publish.csiro.au/nid/227/issue/5090.htm (accessed Jul 2013).
- 15. NSW Department of Health. Guide to role delineation of health services. 3rd ed. Sydney: NSW Department of Health, 2002.
- 16. Robson MS. Classification of caesarean sections. Fetal Matern Med Rev 2001; 12: 23-39.
- 17. Rabe-Hesketh S, Skrondal A. Multilevel and longitudinal modelling using Stata. 2nd ed. College Station, Tex: Stata Press, 2008.
- 18. Mohammed MA, Manktelow BN, Hofer TP. Comparison of four methods for deriving hospital standardised mortality ratios from a single hierarchical logistic regression model. Stat Methods Med Res 2012; Nov 6. [Epub ahead of print.]
- 19. Gibberd R, Pathmeswaran A, Burtenshaw K. Using clinical indicators to identify areas for quality improvement. J Qual Clin Pract 2000; 20: 136-144.
- 20. Simpson JM, Evan N, Gibberd RW, et al; Australian and New Zealand Neonatal Network. Analysing differences in clinical outcomes between hospitals. Qual Saf Health Care 2003; 12: 257-262.
- 21. Torloni MR, Betran AP, Souza JP, et al. Classifications for cesarean section: a systematic review. PLOS One 2011; 6: e14566.
- 22. Roberts CL, Algert CS, Ford JB, et al. Pathways to a rising caesarean section rate: a population-based cohort study. BMJ Open 2012; 2: e001725.
- 23. Hofmeyr GJ, Kulier R. External cephalic version for breech presentation at term. Cochrane Database Syst Rev 2012; (10): CD000083.
- 24. Bragg F, Cromwell DA, Edozien LC, et al. Variation in rates of caesarean section among English NHS trusts after accounting for maternal and clinical risk: cross sectional study. BMJ 2010; 341: c5065.
- 25. Stavrou EP, Ford JB, Shand AW, et al. Epidemiology and trends for caesarean section births in New South Wales, Australia: a population-based study. BMC Pregnancy Childbirth 2011; 11: 8.
Abstract
Objectives: To assess recent hospital caesarean section (CS) rates in New South Wales, adjusted for casemix; to quantify the amount of variation that can be explained by casemix differences; and to examine the potential impact on the overall CS rate of reducing variation in practice.
Design and setting: Population-based record linkage study of births in 81 hospitals in New South Wales, 2009–2010, using the Robson classification to categorise births, and multilevel logistic regression to examine variation in hospital CS rates within Robson groups.
Main outcome measures: Hospital CS rates.
Results: The overall CS rate was 30.9%, ranging from 11.8% to 47.4% (interquartile range, 23.9%–33.1%) among hospitals. The three groups contributing most to the overall CS rate all comprised women with a single cephalic pregnancy who gave birth at term, including: those who had had a previous CS (36.4% of all CSs); nulliparous women with an elective delivery (prelabour CS or labour induction, 23.4%); and nulliparous women with spontaneous labour (11.1%). After adjustment for casemix, marked unexplained variation in hospital CS rates persisted for: nulliparous women at term; women who had had a previous CS; multifetal pregnancies; and preterm births. If variation in practice was reduced for these risk-based groups by achieving the “best practice” rate, this would lower the overall rate by an absolute reduction of 3.6%, from 30.9% to 27.3%.
Conclusion: Understanding hospital heterogeneity in performing CS and implementing evidence-based practices may result in improved maternity care. We have identified five risk-based groups as priority targets for reducing practice variation in CS rates.