


With an average alcohol consumption of 9.8 litres of pure alcohol per person aged 14 years and over in 2000, Australia was ranked 23rd among the 58 countries included in the World Drink Trends (2003).1 Among Australian states and territories, alcohol consumption is the highest in the Northern Territory. Annual average consumption of 16.9 litres for NT Aboriginal people and 14.5 litres for NT non-Aboriginal people has been reported.2 In Australia, per capita consumption of alcohol remained stable between 1990 and 2001.3
The NT has distinctive demographic and geographical features compared with the rest of Australia. The population is much younger, there is a high proportion of Aboriginal people, much of the Territory is remote and the climate is generally warmer. A previous report has highlighted the high burden of alcohol-related health conditions within the NT, especially in non-metropolitan areas.3 Alcohol misuse causes direct harm to individuals who consume alcohol at risky levels, contributes to violence and crime, and has negative impacts on families and society at large. Drinking alcohol at risky levels also has an economic impact. The total social cost of alcohol in the NT was estimated to be $642 million in the financial year 2004–05.4
In recent years, collective efforts have been made at both local and national levels to reduce excess alcohol consumption in the NT. Surveys and studies have been conducted to quantify the impact of alcohol misuse and to understand the underlying issues and identify solutions.2,3 Both government and non-government organisations have introduced a range of policies and interventions, such as the Northern Territory National Emergency Response Act 2007 (Cwlth) restricting the sale and consumption of alcohol in remote Aboriginal communities. Hospital inpatient discharge data are among the most reliable health datasets for analysing long-term changes in health outcomes. We examined trends in hospitalisation for alcohol-attributable conditions among NT Aboriginal and non-Aboriginal populations during a decade in which significant public health interventions were introduced.
We analysed inpatient discharge data from all five NT public hospitals for the financial years 1998–99 to 2008–09. During this period, hospital discharge data were coded using the International Classification of Diseases and Related Health Problems, 10th revision, Australian modification (ICD-10-AM).5 We selected diagnosis codes for medical conditions that are wholly or partially attributable to alcohol, based on previous studies.6-8 These are listed in the Appendix.
We used an accepted method — the aetiological fraction (AF) method — to calculate the proportion of hospitalisations that can be attributed to alcohol consumption. This method requires information on the prevalence of alcohol consumption within a population, the relative risk of developing a particular condition, and hospital discharge data.3 We calculated the AF using the equation:
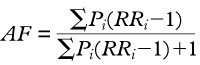
Pi = proportion of people with the specified risk factor in a particular population, i;
RRi = relative risk of developing a disease or condition in a particular population, i.
We obtained data on alcohol consumption prevalence for the NT non-Aboriginal and Aboriginal populations from the National Drug Strategy Household Surveys (NDSHS) for 1994 and 2004.9,10 The 1994 NDSHS was chosen over more recent surveys for estimates of alcohol consumption for Aboriginal people because the methods were similar to those used by the 2004 NDSHS and are considered to provide the most reliable estimates of alcohol consumption among Aboriginal people to date. Relative risks were acquired from various sources, including the Australian Burden of Disease Study.6,7,11 We used relative risks from studies of non-Aboriginal populations for both the Aboriginal and non-Aboriginal populations in our study.
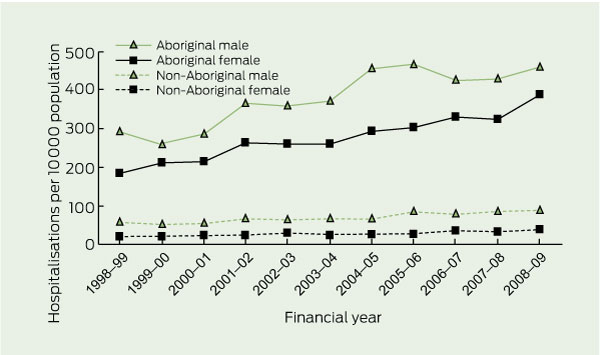
Time trends for alcohol-attributable hospitalisation rates for NT Aboriginal and non-Aboriginal males and females are shown in Box 1. During the 11-year study period, the rates increased among all groups and remained higher for both Aboriginal males and females than for either of the non-Aboriginal groups. Among Aboriginal males, the alcohol attributable-hospitalisation rate increased from 291.3 to 460.0 per 10 000 population (57.9%), and among Aboriginal females it increased from 181.8 to 387.4 per 10 000 (113.1%). Among non-Aboriginal males the rate increased from 58.8 to 87.4 per 10 000 population (48.6%), while increasing from 16.8 to 37.2 per 10 000 (121.4%) among non-Aboriginal females. The average annual increase in alcohol-attributable hospitalisation rates was 3.9% (95% CI, − 1.03% to 9.1%; P = 0.122) for Aboriginal males and 5.5% (95% CI, 0.2% to 11.1%; P = 0.043) for Aboriginal females, compared with annual average increases of 2.7% (95% CI, − 2.2% to 7.9%; P = 0.284) and 4.2% (95% CI, − 1.3% to 10.1%; P = 0.140) for their non-Aboriginal counterparts, respectively.
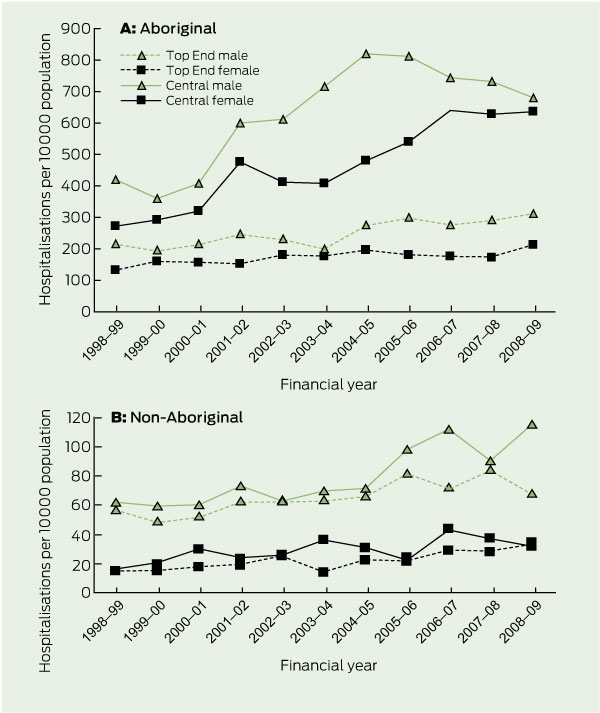
Box 2, A shows the trend for alcohol-attributable hospitalisation rates among NT Aboriginal and non-Aboriginal males and females by region of residence. The rates of alcohol-attributable hospitalisation among Aboriginal people living in Central Australia were much higher than among Aboriginal people living in the Top End of the Northern Territory. In Central Australia, the rate for Aboriginal males increased between 1998–99 and 2004–05 (annual average change, 8.5%; 95% CI, 0.4% to 17.3%) before a decline (annual average change, − 2.1%; 95% CI, − 13.1% to 10.2%) between 2004–05 and 2008–09. Among Aboriginal females in Central Australia, the average annual increase in alcohol-attributable hospitalisation rate was 8.4% (95% CI, 3.3% to 13.7%). Among Top End Aboriginal people, the annual increase was 2.3% for both males and females (male 95% CI, − 2.7% to 7.6%; female 95% CI, − 3.1% to 8.0%).
Among non-Aboriginal people (Box 2, B), the rate of alcohol-attributable hospitalisation per 10 000 population nearly doubled for Central non-Aboriginal males (from 62.4 [95% CI, 47.4–77.3] to 115.4 [95% CI, 95.6–135.2]; P < 0.001) and females (from 16.6 [95% CI, 8.3–24.8] to 31.5 [95% CI, 21.1–42.0]; P = 0.029) and Top End females (from 16.3 [95% CI, 12.5–20.1] to 34.3 [95% CI, 29.0–39.5]; P < 0.001), while there was a small increase among Top End non-Aboriginal males (from 56.5 [95% CI, 49.7–63.3] to 68.5 [95% CI, 61.6–75.4]; P = 0.020).
The greatest increase in annual alcohol-attributable hospitalisation rate was among Aboriginal people aged 25 years and over who lived in Central Australia (8.1%; 95% CI, 5.6%–10.7%), followed by non-Aboriginal people aged less than 25 years (6.9%; 95% CI, 2.9%–11.0%) and non-Aboriginal people aged 25 years and over who lived in the same region (6.2%; 95% CI, 3.0%–9.5%) (Box 3).
The most common cause of alcohol-attributable hospitalisation among NT Aboriginal people was assault (37.1%), and the second most common cause was pancreatitis (12.1%). Among non-Aboriginal people, the most common cause of alcohol-attributable hospitalisation was fall injuries (16.9%), and the second most common cause was occupational and machinery injuries (13.5%). Epilepsy was the third most common cause for Aboriginal people, but it was not among the top five causes for non-Aboriginal people (Box 4).
Our findings are consistent with reports of the high prevalence of drinking at risky levels among the NT population, including higher alcohol consumption in Central Australia.1,2 One report estimated that alcohol-attributable deaths in the non-Aboriginal NT population occurred at twice the national rate during July 2004 to June 2005.3 We estimated that the rate for alcohol-attributable hospitalisation among NT Aboriginal people was 329.2 per 10 000, which is much higher than the rates for the total population in other Australian states (range, from 25.2 to 63.3 per 10 000 population3). The rate for non-Aboriginal NT people in our study was similar to these rates in other Australian states using a comparable method of estimating alcohol-attributable hospitalisation.
Previous studies show that many Aboriginal people do not drink alcohol at all or drink very lightly. However, Aboriginal people who do drink are more likely to drink at risky levels.12 There are many factors that contribute to why some Aboriginal people drink excessively. In the last two centuries, Aboriginal people have been exposed to dramatic changes in their lives that have weakened traditional social control and contributed to emotional distress and intergenerational trauma, which are recognised drivers of substance misuse.12 While separation from family, land and culture is linked with emotional distress, evidence exists of the success of comprehensive population-based interventions.13 It is argued that communities need to address the problem at the grass-roots level, with a focus on why this happened. The most effective strategies are those that are directed at altering the conditions that produce alcohol problems.14
While the hospitalisation rate continued to increase among Central Australian Aboriginal females during the study period, the rate declined among Central Australian Aboriginal males from 2004–05 onwards. This decline supports an argument that recent changes in policy and practices may be having an impact. A 2012 report by the Menzies School of Health Research indicated that alcohol consumption in Central Australia had dropped by 18% since a suite of Australian and NT government alcohol restrictions came into force in 2006.15 However, recent policy changes and interventions have not occurred in isolation. The NT government and community organisations have introduced a range of interventions since the 1990s, including those under the Living with Alcohol Program (from 1991), alcohol sales restrictions in Central Australia (from 2002) and the Northern Territory Alcohol Framework project (2003).13,16,17 More recently, the Australian and NT governments have introduced broader policy changes to reduce alcohol harm across the NT. The impact of these interventions may be cumulative and become more apparent in the future. A well designed and comprehensive evaluation is warranted.
Our study has a number of limitations. Firstly, the relative risks we applied were developed for the general population and may not be the same among the NT Aboriginal population. This limitation is countered by the benefit of this being a constant measure for both populations. A second limitation is that we used the aetiological fraction method, applied to hospitalisations. NT Aboriginal people have much higher hospitalisation rates than the general population as a result of multiple factors, including social disadvantage, unemployment and social isolation as well as alcohol.18 Therefore, some of the excess “alcohol-attributable” hospitalisation among the Aboriginal population may be due to such factors, and, consequently, the study results need to be interpreted with caution. The influence of these conditions on health outcomes highlights the need for a multisectoral approach to reduce alcohol-related morbidity through individual and community-wide interventions.
1 Age-adjusted alcohol-attributable hospitalisations per 10 000 population, Northern Territory, 1998–99 to 2008–09
2 Age-adjusted alcohol-attributable hospitalisations per 10 000 population, Northern Territory, 1998–99 to 2008–09, by Aboriginality and region
3 Average annual increase in alcohol-attributable hospitalisation rate by age group and region, Northern Territory, 1998–99 to 2008–09
Average annual increase, % (95% CI) |
|||||||||||||||
Received 21 November 2011, accepted 5 July 2012
- Shu Qin Li1
- Sabine L M Pircher2
- Steven L Guthridge3
- Health Gains Planning, Northern Territory Department of Health, Darwin, NT.
We thank Jo Wright and Steven Skov for their valuable comments on this article.
No relevant disclosures.
- 1. Productschap voor Gedistilleerde Dranken. World drink trends 2003: international beverage alcohol consumption and production trends. Henley on Thames: NTC Publications, 2003.
- 2. Skov SJ, Chikritzhs TN, Li SQ, et al. How much is too much? Alcohol consumption and related harm in the Northern Territory. Med J Aust 2010; 193: 269-272.
- 3. Chikritzhs T, Catalano P, Stockwell T, et al. Australian alcohol indicators, 1990–2001. Patterns of alcohol use and related harms for Australian states and territories. Perth: National Drug Research Institute, Curtin University of Technology, 2003. http://ndri.curtin.edu.au/local/docs/pdf/naip/naipaaifullreport.pdf (accessed Jul 2012).
- 4. South Australian Centre for Economic Studies. Harm from and costs of alcohol consumption in the Northern Territory: final report. Adelaide: SACES, 2009.
- 5. National Centre for Classification in Health. International statistical classification of diseases and related health problems, 10th revision, Australian modification (ICD-10-AM). Sydney: NCCH, University of Sydney, 1998.
- 6. Collins DJ, Lapsley HM. The costs of tobacco, alcohol and illicit drug abuse to Australian society in 2004/05. Canberra: Commonwealth of Australia, 2008. http://www.nationaldrugstrategy.gov.au/internet/drugstrategy/publishing.nsf/content/34F55AF632F67B70CA2573F60005D42B/$File/mono64.pdf (accessed Jul 2012).
- 7. Mathers C, Vos T, Stevenson C. The burden of disease and injury in Australia (full report). Canberra: Australian Institute of Health and Welfare, 1999. (AIHW Cat. No. PHE 17.) http://www.aihw.gov.au/publication-detail/?id=6442467088 (accessed Jul 2012).
- 8. Bagnardi V, Blangiardo M, La Vecchia C, Corrao G. A meta-analysis of alcohol drinking and cancer risk. Br J Cancer 2001; 85: 1700-1705.
- 9. Australian Institute of Health and Welfare. 2004 National Drug Strategy Household Survey: first results. Canberra: AIHW, 2005. (AIHW Cat. No. PHE 57.) http://www.aihw.gov.au/publication-detail/?id=6442467715 (accessed Jul 2012).
- 10. Commonwealth Department of Human Services and Health. National Drug Strategy Household Survey: urban Aboriginal and Torres Strait Islander peoples supplement 1994. Canberra: Australian Government Publishing Service, 1995.
- 11. English D, Holman D, Milne E, et al. The quantification of drug caused morbidity and mortality in Australia, 1992. Canberra: Commonwealth Department of Human Services and Health, 1995.
- 12. Creative Spirits. Aboriginal alcohol consumption. http://www.creativespirits.info/aboriginalculture/health/aboriginal-alcohol-consumption.html (accessed Jul 2010).
- 13. Stockwell TR, Chikritzhs T, Hendrie D, et al. The public health and safety benefits of the Northern Territory’s Living with Alcohol programme. Drug and Alcohol Review 2001; 20: 167-180.
- 14. King T, Richards J; Turning Point Alcohol and Drug Centre. Australian local government: alcohol harm minimisation projects. A good practice guide. Canberra: Commonwealth of Australia, 2004. http://www.alcohol.gov.au/internet/alcohol/publishing.nsf/Content/resources-harm-minimisation/$FILE/alc_harm.pdf (accessed Sep 2010).
- 15. d’Abbs P, Ivory B, Senior K, et al. Managing alcohol in Tennant Creek, Northern Territory: an evaluation of the Tennant Creek Alcohol Management Plan and related measures to reduce alcohol-related problems. Darwin: Menzies School of Health Research, 2010. http:// (accessed Jul 2012).
- 16. Crundall I. Living with Alcohol in the Northern Territory. Darwin: Northern Territory Government, 1994.
- 17. Crundall I, Moon C. Report to the licensing commission: summary evaluation of the Alice Springs Liquor Trial. Darwin: Northern Territory Government, 2003.
- 18. You J, Guthridge S. Mortality, morbidity and health care costs of injury in the NT, 1991-2001. Darwin: Health Gains Planning, Northern Territory Department of Health and Community Services, 2005. http://digitallibrary.health.nt.gov.au/dspace/bitstream/10137/60/1/injury_project_report.pdf (accessed Jul 2012).
Abstract
Objective: To examine trends in hospitalisation for alcohol-attributable conditions in the Northern Territory Aboriginal and non-Aboriginal populations between the financial years 1998–99 and 2008–09.
Design and setting: Retrospective descriptive analysis of inpatient discharge data from NT public hospitals.
Main outcome measures: Alcohol-attributable hospitalisation by age, sex, Aboriginality, region of residence and medical conditions, with annual time trends.
Results: Annual rates of hospitalisation for alcohol-attributable conditions across the NT increased from 291.3 per 10 000 population to 460.0 per 10 000 (57.9%) among Aboriginal males and from 181.8 per 10 000 to 387.4 per 10 000 (113.1%) among Aboriginal females over the study period. The alcohol-attributable hospitalisation rate also increased from 58.8 per 10 000 population to 87.4 per 10 000 (48.6%) among non-Aboriginal males and from 16.8 per 10 000 to 37.2 per 10 000 (121.4%) among non-Aboriginal females. Alcohol-attributable hospitalisation rates among Aboriginal people living in Central Australia were much higher than in the Top End. In Central Australia, the rates for Aboriginal females increased throughout the study period, but for Aboriginal males declined from 2004–05 onwards.
Conclusion: Rates of hospitalisation for alcohol-attributable conditions were high among NT Aboriginal people and increased during the study period. Although not statistically significant, the moderation in rates among Central Australian Aboriginal males after 2004–05 is encouraging. This apparent improvement is consistent with another recent study and provides tentative support that recent policy changes and interventions may be having an impact. The results of this study highlight the burden of alcohol use in the NT and emphasise the need for ongoing investment in comprehensive alcohol-management programs.