


Traumatic injury accounts for 9% of global mortality,1 and imposes significant physical and psychological disability on people of all age groups. It remains the leading cause of death in those under 45 years of age.2 Trauma systems facilitate the timely treatment of patients with major trauma at a trauma centre. This approach has reduced mortality in patients with trauma in Australia3,4 and internationally.5,6
A system for trauma care was first proposed in Australia in New South Wales in 1988 and then implemented in 1992.7 The paediatric trauma system in NSW has been studied previously,8 but the trauma system for the adult population has not been evaluated in NSW. A monitoring program was established in 2002 (the NSW Trauma Registry) by the NSW Institute of Trauma and Injury Management. A predefined, mandatory minimum dataset for patients with major injury (injury severity score [ISS] > 15) is collected by trained trauma nurses in each hospital and submitted electronically to the centrally maintained registry. Variables include 26 non-identifiable items about each injured person, including the time and mechanism of injury, the ISS, the prehospital transport mode and inhospital treatment.
Trauma centres in Australia are categorised according to model resource levels (summarised in Box 1).9 During the study period, patients with major trauma were transported to the nearest Level I centre, or to a regional trauma centre, commensurate with a Level III centre. Regional trauma centres play an important role in the delivery of trauma care, but often lack specialty resources. Most are located outside Sydney, and road travel time from regional trauma centres to a Level I centre ranges from 30 minutes to 2 hours. In a recent single region study in NSW, morbidity was significantly higher in a regional trauma centre compared with a Level I centre.10
Patients aged ≥ 15 years with major injuries, defined as an ISS > 15, were included. The ISS was calculated from the Abbreviated Injury Scale, 1998 revision.11 There were no changes in trauma centre designation or data collection resources during the study period.
Definitive trauma care was considered to be delivered at the hospital where most of the patient’s treatment and care were provided, as defined by length of stay (LOS). Outcome measures were limited to those included in the NSW Trauma Registry: overall hospital LOS, LOS in an intensive care unit (ICU) and inhospital mortality. Injury severity was grouped into serious (ISS, 16–24), severe (ISS, 25–39) and critical (ISS, 40–75).4
During the 5-year period, 9769 people aged ≥ 15 years and admitted to hospital with an ISS > 15 had their details recorded in the NSW Trauma Registry. The patients’ mean age was 48.2 years (SD, 22.6) and 73% were male. There was a trend towards increasing presentations of patients aged 75 years and over (χ2 test for trend, P < 0.01). The median ISS remained consistent at 22 over the 5-year period (Box 2).
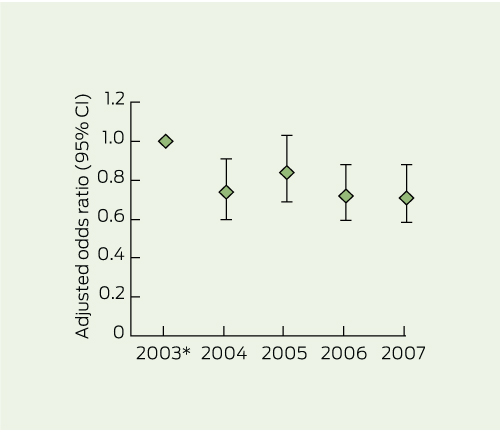
There were 1328 inhospital deaths (overall mortality rate, 13.6%; range, 15% in 2002 to 12.9% in 2007). Year of injury, level of trauma centre, ISS, body region (Abbreviated Injury Scale) and age were independent predictors of mortality (Box 3). There was a significant decrease in the unadjusted mortality and the number of patients dying at Level I centres over time (P = 0.02). The adjusted relative odds of mortality decreased significantly from 2003 to 2007, except in 2005 (Box 4). The relative odds of mortality were significantly higher among patients receiving definitive care at regional trauma centres (OR, 1.34; 95% CI, 1.10–1.63) compared with Level I centres.
There was no significant difference in patient characteristics between patients who died in a regional trauma centre versus a Level I centre, except for mechanism of injury (χ2 = 20.15; df = 5; P < 0.01). Level I centres received a higher proportion of fatally injured patients who were pedestrians, had fallen > 1 m, or suffered burns or violence (eg, assault, stabbing). Deaths at regional trauma centres more commonly resulted from motorcycle or pedal cycle crashes.
The relative odds of death increased in those older than 65 years, and increased 30-fold in those with critical injuries (ISS, 40–75). In patients with head and neck injuries, the relative odds of death decreased significantly over time to 2007 (OR, 0.68; 95% CI, 0.54–0.86), particularly in older (> 65 years) and more severely injured patients (Box 3).
This is the first statewide analysis of major adult trauma trends and outcomes in NSW. Age, sex, injury severity and initial treatment at a regional trauma centre were independent predictors of mortality. Despite a small reduction in mortality after major trauma over the study period, trauma remains a significant cause of mortality and hospitalisation in NSW, and accurate data on trauma-related mortality are, at present, not recorded for rural areas. Trauma should continue to feature prominently on the public health agenda.12
The overall mortality rate in NSW is similar to that reported in other Australian states.4,13 During the study period no change in prehospital protocol occurred, yet the proportion of patients receiving care at a regional trauma centre increased. This may represent improved data collection and reporting at these centres, as trauma coordinators became more experienced.
Patients admitted to a regional trauma centre had a significantly higher mortality rate compared with those admitted to a Level I centre. The survival benefit at Level I centres could be explained by the presence of greater resources, such as the availability of surgically trained staff 24 hours a day, a multidisciplinary trauma service14,15 and higher patient volumes, resulting in enhanced expertise in trauma care.16 Deficiencies in trauma care, regardless of trauma centre level, may occur at multiple points of care and are more likely to occur when there is failure to comply with protocols, poor communication and/or delayed referral.10,14,17,18 However, without reviewing each of the deaths in this study, it is not possible to comment on factors contributing to mortality.
The benefits of primary transport or early interhospital transfer of patients with major trauma to a Level I trauma centre are confirmed in our study. In 2008 Ambulance NSW introduced “Protocol T1”, which specifies that patients with major trauma should be taken directly to a Level I centre, bypassing lower-level centres, if transport time is within 1 hour.19 The impact of Protocol T1 on patient transport practice and outcomes requires evaluation.
The geography of NSW means that regional trauma centres will continue to play an important role in initial stabilisation of patients with trauma. Our study suggests that improved adherence to transfer guidelines will contribute to improved patient outcomes consistent with the experience in Victoria17 and the United States.20 In recent years, a series of standardised transfer guidelines for patients with major trauma have been implemented in NSW, with variable compliance.10,21 The low numbers of transferred patients could also result from some patients with critical injuries being deemed too unstable for transfer, transfer being considered futile, or patients dying before a transfer decision was made.10,21
Trauma systems in Australia have been developed largely on the basis of expert opinion, international experience and informal consensus. Each trauma system needs to consider the specific needs of the region, and the available resources and expertise.15 It is imperative to continue to evaluate trauma systems, and central to this is quality surveillance data.22 In 2010, a statewide online trauma registry was established to facilitate data collection; however, the amount of data each trauma centre collects and enters remains variable. The resourcing of an enhanced statewide minimum dataset, including physiological (vital signs) function and data on cause and time of death, would enable closer analysis of the NSW trauma system. However, ongoing independent academic support is required to conduct, interpret and translate the results of a sustained trauma monitoring program. This would enable targeted and evidence-based resource allocation for initiatives such as increasing helicopter primary retrieval capability from regional areas, or improving education and training for staff in regional trauma centres.
Mortality and LOS are crude methods of appraising outcome, and do not reflect the full burden of injury, although they allow simple monitoring of trauma systems. NSW Level I trauma centres appear to have been effective in reducing mortality. This is likely to be a result of the development and uptake of evidence-based practice, including the NSW Ministry of Health clinical practice guidelines.23 Where deficiencies are detected it is incumbent on governing authorities to ensure that all trauma centres are adequately resourced, staff are well trained, and compliance with trauma protocols are maintained.18 We recommend that the NSW Ministry of Health considers supporting a mandatory trauma verification process, such as that conducted by the Royal Australasian College of Surgeons.9 Currently, the government designates major trauma centres independently of trauma centre verification processes and standards.9
2 Demographic and injury profile of 9769 patients with major trauma (injury severity score [ISS], > 15) in New South Wales, 2003–2007
* The sex of two patients was not specified, one in 2003 and one in 2007. Bold font = significant |
|||||||||||||||
Received 21 October 2011, accepted 13 March 2012
- Kate A Curtis1,2
- Rebecca J Mitchell3
- Shanley S Chong4
- Zsolt J Balogh5
- Duncan J Reed6
- Peter T Clark7
- Scott D’Amours8
- Deborah A Black9
- Mary E Langcake2
- Colman B Taylor10
- Patricia McDougall7
- Peter A Cameron11
- 1 Sydney Nursing School, University of Sydney, Sydney, NSW.
- 2 St George Hospital, Sydney, NSW.
- 3 Transport and Road Safety Research, School of Aviation, University of New South Wales, Sydney, NSW.
- 4 Centre for Research, Evidence Management and Surveillance, Sydney South West Local Health District, New South Wales Health, Sydney, NSW.
- 5 John Hunter Hospital, University of Newcastle, Newcastle, NSW.
- 6 Emergency Department, Gosford Hospital, Gosford, NSW.
- 7 New South Wales Institute of Trauma and Injury Management, Sydney, NSW.
- 8 Liverpool Hospital, Sydney, NSW.
- 9 Faculty of Health Sciences, University of Sydney, Sydney, NSW.
- 10 The George Institute for Global Health, Sydney, NSW.
- 11 Critical Care Division, School of Public Health, Monash University, Melbourne, VIC.
We thank the trauma nurses and data managers from participating trauma centres in NSW, and David Martens from the NSW Institute of Trauma and Injury Management for assistance with data provision. Rebecca Mitchell was supported by an Australian Research Council linkage postdoctoral fellowship (LP0990057). Data analysis was funded by the St George Honda Trauma and Critical Care Research Program.
No relevant disclosures.
- 1. Peden MM, McGee K, Krug E. Injury: a leading cause of the global burden of disease, 2000. Geneva: WHO, 2002.
- 2. Australian Bureau of Statistics. Causes of Death, Australia, 2008. Canberra: ABS, 2010. (ABS Cat. No. 3303.0.) http://www.abs.gov.au/AUSSTATS/abs@.nsf/Lookup/3303.0Main+Features12008? OpenDocument (accessed Mar 2012).
- 3. Brennan PW, Everest ER, Griggs WM, et al. Risk of death among cases attending South Australian major trauma services after severe trauma: the first 4 years of operation of a state trauma system. J Trauma 2002; 53: 333-339.
- 4. Cameron PA, Gabbe BJ, Cooper DJ, et al. A statewide system of trauma care in Victoria: effect on patient survival. Med J Aust 2008; 189: 546-550. <MJA full text>
- 5. Celso B, Tepas J, Langland-Orban B, et al. A systematic review and meta-analysis comparing outcome of severely injured patients treated in trauma centers following the establishment of trauma systems. J Trauma 2006; 60: 371-378.
- 6. Twijnstra MJ, Moons KG, Simmermacher RK, Leenen LP. Regional trauma system reduces mortality and changes admission rates: a before and after study. Ann Surg 2010; 251: 339-343.
- 7. New South Wales Institute of Trauma and Injury Management. The NSW Trauma Registry profile of serious to critical injuries. Sydney: NSW Health, 2007. http://www.health.nsw.gov.au/pubs/2008/pdf/trauma_profile_2006.pdf (accessed Mar 2012).
- 8. Mitchell RJ, Curtis K, Chong S, et al. Comparative analysis of trends in paediatric trauma outcomes in New South Wales, Australia. Injury 2011; Dec 5 [Epub ahead of print].
- 9. Royal Australasian College of Surgeons. The Australasian Trauma Verification Program Manual. Melbourne: RACS, 2009. http://www.surgeons.org/media/4940/2009-08-04_Trauma_Verification_Manual.pdf (accessed Mar 2012).
- 10. Curtis K, Chong S, Mitchell R, et al. Outcomes of severely injured adult trauma patients in an Australian health service: does trauma center level make a difference? World J Surg 2011; 35: 2332-2340.
- 11. Association for the Advancement of Automotive Medicine. The Abbreviated Injury Scale. 1998 Revision. Barrington, IL: AAAM, 1998.
- 12. National Public Health Partnership. The National Injury Prevention and Safety Promotion Plan: 2004-2014. Canberra: NPHP, 2005. http://www. nphp.gov.au/publications/sipp/nipspp.pdf (accessed Mar 2012).
- 13. Royal Perth Hospital Trauma Services. Annual Report – 2008. Perth: Royal Perth Hospital, 2008. http://www.rph.wa.gov.au/pdf/Trauma_Report_2008.pdf (accessed Mar 2012).
- 14. Ursic C, Curtis K, Zou Y, Black D. Improved trauma patient outcomes after implementation of a dedicated trauma admitting service. Injury 2009; 40: 99-103.
- 15. Liberman M, Mulder DS, Jurkovich GJ, Sampalis JS. The association between trauma system and trauma center components and outcome in a mature regionalized trauma system. Surgery 2005; 137: 647-658.
- 16. Garwe T, Cowan LD, Neas BR, et al. Directness of transport of major trauma patients to a level I trauma center: a propensity-adjusted survival analysis of the impact on short-term mortality. J Trauma 2011; 70: 1118-1127.
- 17. McDermott FT, Cordner SM, Tremayne AB, et al. A “before and after” assessment of the influence of the new Victorian trauma care system (1997–1998 vs 2001–2003) on the emergency and clinical management of road traffic fatalities in Victoria. Melbourne: Consultative Committee on Road Traffic Fatalities in Victoria, 2003.
- 18. Chua WC, D’Amours SK, Sugrue M, et al. Performance and consistency of care in admitted trauma patients: our next great opportunity in trauma care? ANZ J Surg 2009; 79: 443-448.
- 19. Ambulance Service of New South Wales. Pre-hospital Management of Major Trauma. Protocol T1. Trauma Triage Tool. Major Trauma Criteria (MIST). Rozelle: Ambulance Service of New South Wales, 2008.
- 20. Newgard CD, McConnell KJ, Hedges JR, Mullins RJ. The benefit of higher level of care transfer of injured patients from nontertiary hospital emergency departments. J Trauma 2007; 63: 965-971.
- 21. Smith J, Lynch J, Sugrue M, et al. An evaluation of compliance with practice guidelines on interhospital trauma transfer. Injury 2005; 36: 1051-1057.
- 22. Mitchell RJ, McClure RJ, Williamson AM, McKenzie K. Implementing the national priorities for injury surveillance. Med J Aust 2008; 188: 405-408. <MJA full text>
- 23. NSW Institute of Trauma and Injury Management. Trauma guidelines [various publications]. Sydney: NSW ITIM, 2007. http://www.itim.nsw.gov.au/wiki/Trauma_guidelines_section (accessed Feb 2012).
Abstract
Objective: To examine trends in mechanism and outcome of major traumatic injury in adults since the implementation of the New South Wales trauma monitoring program, and to identify factors associated with mortality.
Design and setting: Retrospective review of NSW Trauma Registry data from 1 January 2003 to 31 December 2007, including patient demographics, year of injury, and level of trauma centre where definitive treatment was provided.
Participants: 9769 people aged ≥ 15 years hospitalised for trauma, with an injury severity score (ISS) > 15.
Main outcome measures: The NSW Trauma Registry outcome measures included were overall hospital length of stay, length of stay in an intensive care unit and inhospital mortality.
Results: There was a decreasing trend in severe trauma presentations in the age group 16–34 years, and an increasing trend in presentations of older people, particularly those aged ≥ 75 years. Road trauma and falls were consistently the commonest injury mechanisms. There were 1328 inhospital deaths (13.6%). Year of injury, level of trauma centre, ISS, head/neck injury and age were all independent predictors of mortality. The odds of mortality was significantly higher among patients receiving definitive care at regional trauma centres compared with Level I centres (odds ratio, 1.34; 95% CI, 1.10–1.63).
Conclusions: Deaths from major trauma in NSW trauma centres have declined since 2003, and definitive care at a Level 1 trauma centre was associated with a survival benefit. More comprehensive trauma data collection with timely analysis will improve injury surveillance and better inform health policy in NSW.