


Obesity is a major public health challenge for Australia. In the 2007–08 National Health Survey, 24% of Australian adults were reported to be obese and a further 37% overweight.1 Obesity rates are growing and the continuing increase in severe obesity is of particular concern.2,3 It is a major risk factor for type 2 diabetes and a range of other chronic diseases, including cardiovascular, digestive and musculoskeletal disorders,4 as well as overall mortality.5
Clinical guidelines recommend bariatric surgery for those with a body mass index (BMI) over 40 kg/m2, or BMI over 35 kg/m2 and comorbid conditions, after non-surgical options have failed.6,7 This surgery is more effective than non-surgical interventions for the treatment of severe obesity, and it is cost-effective. In addition to substantial weight loss, bariatric surgery can lead to improvements in comorbid conditions including lipid abnormalities, obstructive sleep apnoea and joint disease.8-11 Of particular note is its effectiveness in treating type 2 diabetes,12,13 with one recent trial showing remission rates of 75%–95% within 2 years after surgery.13
Bariatric surgery procedures have been listed on the Medicare Benefits Schedule (MBS) since 1992. Admissions for this surgery rose from 535 to around 17 000 between 1998–1999 and 2007–2008.14 Notably, most of this surgery is carried out in private hospitals and incurs substantial out-of-pocket costs,14 while obesity is concentrated among those of lower socioeconomic status (SES).15 This suggests that groups that are most likely to need surgery are the least likely to have it. However, despite equity concerns,16 there are no published data to date in Australia on the extent of variation in bariatric surgery by health status, SES and other key factors among those potentially eligible for the procedure. In this study, we investigate variation in primary bariatric surgery rates in an obese population, quantify socioeconomic inequalities in rates of surgery and examine the extent to which holding private health insurance (PHI) explains these inequalities.
We used data from the 45 and Up Study, a cohort study involving 266 848 men and women aged 45 years and over from New South Wales. Study participants were randomly sampled from the Medicare enrolment database. More than 10% of the NSW population aged 45 years and over is included in the cohort (response rate of about 18%).17 Participants received a baseline questionnaire (between 1 January 2006 and 31 December 2008) and gave signed consent for follow-up, including linkage to routine health databases. The study is described in detail elsewhere,17 and questionnaires can be viewed at http://www.45andup.org.au.
Questionnaire data were linked to death data from the NSW Registry of Births, Deaths and Marriages (to 30 June 2010) and to hospital data from the NSW Admitted Patient Data Collection (APDC) from 1 July 2000 to 30 June 2010. The NSW APDC includes records of all hospitalisations in NSW, including reasons for admission (coded using ICD-10-AM) and procedures performed (coded using the Australian Classification of Health Interventions).18 Data were linked probabilistically by the Centre for Health Record Linkage (http://www.cherel.org.au).
Data on participant characteristics were based on self-reported data from the questionnaire. Variables were categorised as shown in Box 1 and Box 2. Socioeconomic variables included annual pre-tax household income, education and area-level disadvantage. Area-level disadvantage was based on the Socio-Economic Indexes for Areas Index of Relative Socio-Economic Disadvantage (IRSD),19 derived from postcode of residence and categorised into quintiles using cut-off scores from the 2006 Australian census. Other variables included PHI (including holders of a Department of Veterans’ Affairs [DVA] card), BMI, sex, age group, area of residence (based on the Accessibility/Remoteness Index of Australia Plus,20 derived from postcode), marital status, country of birth, self-rated health, diabetes (ever diagnosed by a doctor), number of other doctor-diagnosed chronic conditions, smoking, tertile of physical activity (based on number of weekly sessions of walking and moderate and vigorous activity, weighted for intensity) and alcohol intake.
Descriptive data showing bariatric surgery rates in relation to participant baseline characteristics are shown in Box 1 and Box 2. Rates of surgery increased with increasing BMI, ranging from 3.72 per 10 000 py (BMI 30–32.49 kg/m2) to 227.77 per 10 000 py (BMI 45–50 kg/m2). Rates varied significantly in relation to all participant characteristics except country of birth and marital status (P > 0.05). Higher rates were associated with being female, younger, a resident in a major city, in poorer health, a non-smoker, a non-drinker and being in the lowest tertile of physical activity.
With regard to SES, unadjusted rates (Box 2 and Box 3) and age–sex- adjusted RRs (Box 2) show that bariatric surgery rates were higher among those who were relatively advantaged. There was a clear socioeconomic gradient with household income; for IRSD, the most notable difference was between the top quintile (low disadvantage) and the other quintiles; for education, rates were highest among those with post-school (non-trade) qualifications and lowest in those with no qualifications; and rates were much higher among those with PHI than among those without.
The degree of socioeconomic in-equality in bariatric surgery rates, after adjusting for all variables except PHI (Model 1), was substantial (Box 4). The adjusted RRs for household income show a clear gradient, with those in the highest bracket (≥ $70 000) five times more likely to have surgery than those in the lowest bracket (< $20 000) (RR, 5.27; 3.18–8.73). After adjusting for PHI (Model 2), the RRs decreased by 35%–62% (P < 0.001 for all income levels), confirming that PHI explained a substantial proportion of income-related inequality. Nevertheless, significant inequality remained, with those in the highest income bracket still being almost twice as likely to have bariatric surgery as those in the lowest bracket (RR, 1.98; 1.15–3.41). When income and education were jointly modelled, this made virtually no difference to the income inequality estimates, while education inequality estimates were not significant in either Model 1 or 2 (results not shown).
Our inequality findings differ from a previous report that showed that bariatric surgery rates in the middle SES quintile of area disadvantage were more than double those of any other SES quintile;14 however, this report was based on the whole population, not the obese population, and hence did not take into account the “need” for surgery. Our findings that bariatric surgery is more common among women, middle-aged rather than older people, and among those living in major cities are consistent with previous reports.14 In addition, the variation in rates we found in relation to health characteristics was in keeping with the indications for surgery7 — the likelihood of surgery increased with increasing BMI, and was greater among those with poor health, diabetes and other chronic conditions. We also found that current smokers were less likely to have surgery than non-smokers.
Strengths of this study include its grounding in a very large population-based cohort, allowing a relatively rare event to be examined; investigation of a large range of factors not recorded in routine data; and use of linked administrative records, allowing virtually complete and objective ascertainment of surgery. A limitation is that BMI was based on self-reported weight and height. However, a validation study involving participants in the 45 and Up Study found that the mean difference between self-reported and measured BMI was not large (on average, 0.74 kg/m2), with sensitivity for classifying obesity of 79%, and importantly, specificity of 99%.21 Although the relatively low response rate and the potential for a “healthy cohort effect” mean that the estimates of surgery rates in our sample may be different to those of the general population, relative comparisons of surgery rates among groups within the cohort remain valid.22,23 Some caution must be applied, however, in generalising the size of the inequality estimates to younger ages, and beyond NSW, which has the highest proportion of private hospital weight loss procedures of all Australian jurisdictions.14
In 2009 the House of Representatives Standing Committee on Health and Ageing Inquiry into Obesity recommended that equity in access be ensured by publicly funding bariatric surgery.24 Our findings suggest that bariatric surgery, an MBS-listed procedure, is currently largely available only to those who can afford PHI and the associated out-of-pocket costs, with poor access to these cost-effective procedures in the section of the population that is most in need. Continuing inequity in access is likely to exacerbate existing inequalities in obesity and related health problems. However, if bariatric surgery came to be less discretionary over time, particularly for the treatment of type 2 diabetes,25 such inequalities could decline. While resource issues may limit the total number of patients that can have bariatric surgery, there is scope to consider how the distribution of limited supply can be improved, and the potential savings that could be made from increasing supply and improving health outcomes.
1 Primary bariatric surgery rates and rate ratios in relation to demographic and health characteristics at baseline in 49 364 participants with body mass index ≥ 30 kg/m2
2 Primary bariatric surgery rates and rate ratios in relation to socioeconomic characteristics at baseline in 49 364 participants with body mass index ≥ 30 kg/m2
3 Rates of bariatric surgery in relation to household income, education level and area-level disadvantage* in 49 364 participants with body mass index ≥ 30 kg/m2
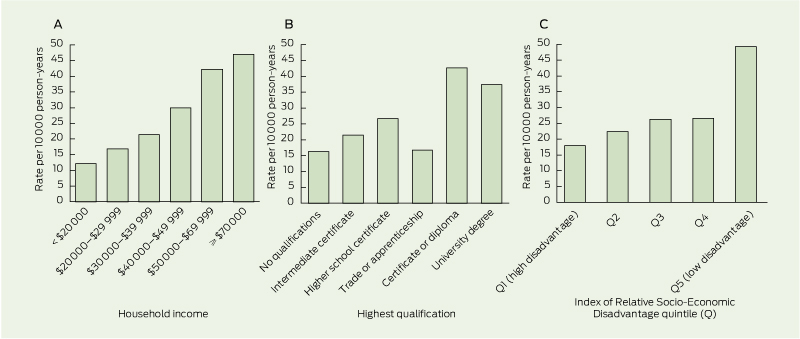
* Area-level disadvantage was based on the Socio-Economic Indexes for Areas Index of Relative Socio-Economic Disadvantage (IRSD),19 derived from postcode of residence and categorised into quintiles using cut-off scores from the 2006 Australian census.
Received 1 July 2012, accepted 28 October 2012
- Rosemary J Korda1
- Grace Joshy1
- Louisa R Jorm2
- James RG Butler1
- Emily Banks1,3
- 1 Australian National University, Canberra, ACT.
- 2 Centre for Health Research, School of Medicine, University of Western Sydney, Sydney, NSW.
- 3 Sax Institute, Sydney, NSW.
We thank the men and women participating in the 45 and Up Study. The 45 and Up Study is managed by the Sax Institute in collaboration with major partner Cancer Council NSW; and partners National Heart Foundation of Australia, NSW Ministry of Health; beyondblue: the national depression initiative; Ageing, Disability and Home Care, NSW Family and Community Services; UnitingCare Ageing; and the Australian Red Cross Blood Service. We also thank the Centre for Health Record Linkage. This project was supported by National Health and Medical Research Council (NHMRC) project grant 585402. The NHMRC had no role in the study design; in the collection, analysis, and interpretation of data; in the writing of the report; or in the decision to submit the article for publication.
Emily Banks is supported by the NHMRC.
- 1. Australian Bureau of Statistics. National health survey: summary of results, 2007-08 (Reissue). Canberra: ABS, 2009. (ABS Cat. No. 4364.0.) http://www.abs.gov.au/ausstats/abs@.nsf/mf/4364.0 (accessed Aug 2012).
- 2. Organisation for Economic Co-operation and Development. Obesity and the economics of prevention: fit not fat. Paris: OECD, 2010. http://www.oecd.org/health/healthpoliciesanddata/obesityandtheeconomicsofpreventionfitnotfat. htm (accessed Aug 2012).
- 3. Walls H, Wolfe R, Haby MM, et al. Trends in BMI of urban Australian adults, 1980-2000. Public Health Nutr 2010; 13: 631-638.
- 4. Guh DP, Zhang W, Bansback N, et al. The incidence of co-morbidities related to obesity and overweight: a systematic review and meta-analysis. BMC Public Health 2009; 9: 88.
- 5. Whitlock G, Lewington S, Sherliker P, et al. Body-mass index and cause-specific mortality in 900 000 adults: collaborative analyses of 57 prospective studies. Lancet 2009; 373: 1083-1096.
- 6. National Institute for Health and Clinical Excellence. CG43 Obesity: full guideline. Obesity: guidance on the prevention, identification, assessment and management of overweight and obesity in adults and children. NICE clinical guideline 43. London: NICE, 2006. http://guidance.nice.org.uk/CG43/Guidance (accessed Aug 2012).
- 7. National Health and Medical Research Council. Clinical practice guidelines for the management of overweight and obesity in adults. Canberra: NHMRC, 2003. http://health.gov.au/internet/main/publishing.nsf/Content/7AF116AFD4E2EE3 DCA256F190003B91D/$File/adults.pdf (accessed Aug 2012).
- 8. Lynch J, Belgaumkar A. Bariatric surgery is effective and safe in patients over 55: a systematic review and meta-analysis. Obes Surg 2012; 22: 1507-1516.
- 9. Picot J, Jones J, Colquitt JL, et al. The clinical effectiveness and cost-effectiveness of bariatric (weight loss) surgery for obesity: a systematic review and economic evaluation. Health Technol Assess 2009; 13: 1-190, 215-357, iii-iv.
- 10. Garb J, Welch G, Zagarins S, et al. Bariatric surgery for the treatment of morbid obesity: a meta-analysis of weight loss outcomes for laparoscopic adjustable gastric banding and laparoscopic gastric bypass. Obes Surg 2009; 19: 1447-1455.
- 11. Buchwald H, Estok R, Fahrbach K, et al. Trends in mortality in bariatric surgery: a systematic review and meta-analysis. Surgery 2007; 142: 621-632.
- 12. Dixon JB, Murphy DK, Segel JE, Finkelstein EA. Impact of laparoscopic adjustable gastric banding on type 2 diabetes. Obes Rev 2011; 13: 57-67.
- 13. Mingrone G, Panunzi S, De Gaetano A, et al. Bariatric surgery versus conventional medical therapy for type 2 diabetes. N Engl J Med 2012; 366: 1577-1585.
- 14. Australian Institute of Health and Welfare. Weight loss surgery in Australia. Canberra: AIHW, 2010. (AIHW Cat. No. HSE 91.) http://www. aihw.gov.au/publication-detail/?id=6442472385&tab=2 (accessed Aug 2012).
- 15. Australian Institute of Health and Welfare. Who is overweight? Canberra: AIHW, 2011. http://www.aihw.gov.au/overweight-and-obesity/prevalence (accessed Aug 2012).
- 16. Talbot ML, Jorgensen JO, Loi KW. Difficulties in provision of bariatric surgical services to the morbidly obese. Med J Aust 2005; 182: 344-347. <MJA full text>
- 17. Banks E, Redman S, Jorm L, et al. Cohort profile: the 45 and up study. Int J Epidemiol 2008; 37: 941-947.
- 18. National Centre for Classification in Health. The international statistical classification of diseases and related health problems, 10th revision, Australian modification (ICD-10-AM). 3rd ed. Sydney: University of Sydney, 2002.
- 19. Australian Bureau of Statistics. Socio-Economic Indexes for Areas (SEIFA) - Technical Paper 2006. Canberra: ABS, 2008. http://www. ausstats.abs.gov.au/Ausstats/subscriber.nsf/0/72283F45CB86E5FECA 2574170011B271/$File/2039055001_socioeconomic%20indexes% 20for%20areas%20(seifa)%20-%20 technical %20paper_2006.pdf (accessed Aug 2012).
- 20. Australian Institute of Health and Welfare. Rural, regional and remote health: a guide to remoteness classifications. Canberra: AIHW, 2004. (AIHW Cat. No. PHE 53; Rural Health Series No. 4.) http://www.aihw.gov.au/WorkArea/DownloadAsset.aspx?id=6442459567 (accessed Aug 2012).
- 21. Ng SP, Korda R, Clements M, et al. Validity of self-reported height and weight and derived body mass index in middle-aged and elderly individuals in Australia. Aust N Z J Public Health 2011; 35: 557-563.
- 22. Mealing NM, Banks E, Jorm LR, et al. Investigation of relative risk estimates from studies of the same population with contrasting response rates and designs. BMC Med Res Methodol 2010; 10: 26.
- 23. Ponsonby AL, Dwyer T, Couper D. Is this finding relevant? Generalisation and epidemiology. Aust N Z J Public Health 1996; 20: 54-56.
- 24. House of Representatives Standing Committee on Health and Ageing. Weighing it up: obesity in Australia. Canberra: Commonwealth of Australia, 2009. http://www.aph.gov.au/Parliamentary_Business/Committees/House_of_Represen tatives_Committees?url=haa/./obesity/report. htm (accessed May 2012).
- 25. Dixon JB, Zimmet P, Alberti KG, et al. Bariatric surgery: an IDF statement for obese type 2 diabetes. Diabet Med 2011; 28: 628-64.
Abstract
Objectives: To investigate variation, and quantify socioeconomic inequalities, in the uptake of primary bariatric surgery in an obese population.
Design, setting and participants: Prospective population-based cohort study of 49 364 individuals aged 45–74 years with body mass index (BMI) ≥ 30 kg/m2. Data from questionnaires (distributed from 1 January 2006 to 31 December 2008) were linked to hospital and death data to 30 June 2010. The sample was drawn from the 45 and Up Study (approximately 10% of New South Wales population aged 45 included, response rate approximately 18%).17
Main outcome measures: Rates of bariatric surgery and adjusted rate ratios (RRs) in relation to health and sociodemographic characteristics.
Results: Over 111 757 person-years (py) of follow-up, 312 participants had bariatric surgery, a rate of 27.92 per 10 000 py (95% CI, 24.91–31.19). Rates were highest in women, those living in major cities and those with diabetes, and increased significantly with a higher BMI and number of chronic health conditions. Adjusted RRs were 5.27 (95% CI, 3.18–8.73) for those with annual household income ≥ $70 000 versus those with household income < $20 000, and 4.01 (95% CI, 2.41–6.67) for those living in areas in the least disadvantaged quintile versus those in the most disadvantaged quintile. Having versus not having private health insurance (age- and sex-adjusted RR, 9.25; 95% CI, 5.70–15.00) partially explained the observed inequalities.
Conclusions: Bariatric surgery has been shown to be cost-effective in treating severe obesity and associated illnesses. While bariatric surgery rates in Australia are higher in those with health problems, large socioeconomic inequalities are apparent. Our findings suggest these procedures are largely available to those who can afford private health insurance and associated out-of-pocket costs, with poor access in populations who are most in need. Continuing inequalities in access are likely to exacerbate existing inequalities in obesity and related health problems.