


Chlamydia is the most commonly notified infectious disease in Australia. In 2011, there were 80 800 chlamydia diagnoses, with a notification rate three times greater among Aboriginal and Torres Strait Islander people than non-Indigenous people. In 2011, there were 12 087 gonorrhoea diagnoses, with a notification rate 30 times greater among Indigenous people than non-Indigenous people.1
Notifications from states and territories included in the analysis were used to assess trends in chlamydia and gonorrhoea crude notification rates per 100 000 population from 2000 to 2009, using univariate Poisson regression. Comparisons were made between Indigenous and non-Indigenous people, men and women, age groups, and areas of residence. The 2006 estimated resident population was sourced from the Australian Bureau of Statistics,2 and the area of residence classification was based on the Australian Standard Geographical Classification.3
There were 149 719 chlamydia notifications from 2000 to 2009; 61% were in women and 72% in non-Indigenous people. Among Indigenous people, 64% were women, 81% were aged 15–29 years, and 83% lived in remote areas (Box 1). In non-Indigenous people, 59% were women, 81% were aged 15–29 years, and 63% lived in urban areas. The female:male ratio was about 2:1 among Indigenous people and about 1.4:1 in non-Indigenous people.
From 2000 to 2009, the crude notification rate per 100 000 for chlamydia among Indigenous people increased by 80%, from 1383 in 2000 to 2494 in 2009, and in non-Indigenous people increased by 335%, from 51 in 2000 to 222 in 2009 (data not shown). The Indigenous versus non-Indigenous summary rate ratio was 23.92 (Box 1).
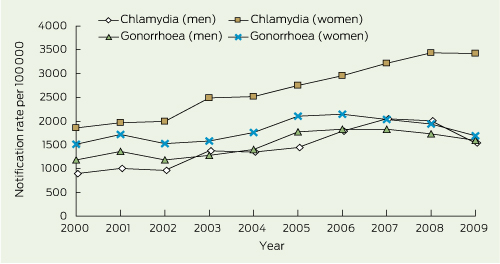
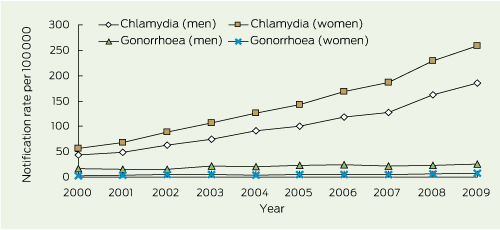
Among Indigenous people, women had the highest crude notification rate per 100 000 for chlamydia, which increased by 84% from 1858 in 2000 to 3428 in 2009 (Box 2). Among non-Indigenous people, women had the highest crude notification rate per 100 000, which increased by 354% from 57 in 2000 to 259 in 2009 (Box 3). The Indigenous versus non-Indigenous summary rate ratio was highest in women (26.24) (Box 1).
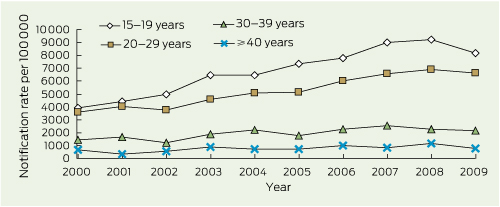
Among Indigenous people, the highest crude notification rate per 100 000 for chlamydia by age was in 15–19-year-olds; the rate was 3897 in 2000 and 8151 in 2009, an increase of 109% (Box 4). The highest crude notification rate per 100 000 in non-Indigenous people was in 20–29-year-olds; the rate was 190 in 2000 and 766 in 2009, an increase of 303% (data not shown). The Indigenous versus non-Indigenous summary rate ratio was highest in those aged 40 years or older (36.09) (Box 1).
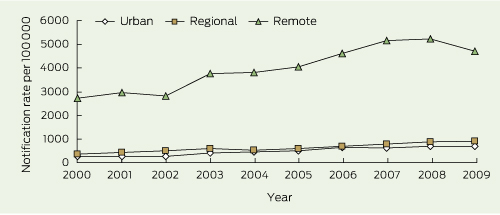
Among Indigenous people, the highest crude notification rate per 100 000 for chlamydia was among people who lived in remote areas; the rate was 2729 in 2000 and 4708 in 2009, an increase of 73% (Box 5). Among non-Indigenous people, the highest crude notification rate was among people who resided in remote areas, which increased by 231% from 181 in 2000 to 599 in 2009 (data not shown). The Indigenous versus non-Indigenous summary rate ratio was highest in remote areas (12.59) (Box 1).
There were 73 480 gonorrhoea notifications from 2000 to 2009; 54% in males and 77% among Indigenous people. Among Indigenous people, 53% of notifications were in women, 79% were in those aged 15–29 years, and 86% were among those who lived in remote areas. Among non-Indigenous people, 80% were in men, 50% were in those aged 15–29 years, 72% were among people who lived in urban areas, and 77% in men who lived in urban areas (Box 1) (data not shown). The female:male ratio was about 1.2:1 among Indigenous people and about 0.25:1 among non-Indigenous people.
The crude notification rate per 100 000 for gonorrhoea among Indigenous people increased by 48% between 2000 and 2006 (1347 to 1991), and then declined by 17% to 1643 in 2009 (Box 2) (data not shown). Among non-Indigenous people, the crude notification rate per 100 000 increased by 70% from 10 in 2000 to 17 in 2009 (Box 3) (data not shown). The Indigenous versus non-Indigenous summary rate ratio was 173.78 (Box 1).
Among Indigenous people, the highest crude notification rate per 100 000 for gonorrhoea was in women; from 1509 in 2000 to 2148 in 2006, an increase of 42%. It then declined by 21% to 1697 in 2009. The notification rate per 100 000 among Indigenous men also increased by 55% from 1183 in 2000 to 1832 in 2006, and from then declined by 13% to 1588 in 2009 (Box 2). In non-Indigenous people, men had the highest crude notification rate, which increased by 47% from 17 in 2000 to 25 in 2009 (Box 3). The Indigenous versus non-Indigenous summary rate ratio was highest in females (465.93) (Box 1).
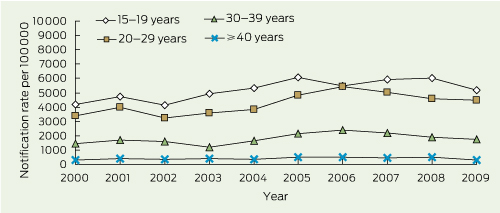
Among Indigenous people, the highest crude notification rate per 100 000 for gonorrhoea was in 15–19-year-olds, increasing by 24% from 4180 in 2000 to 5176 in 2009 (Box 6). Among non-Indigenous people, the highest crude notification rate per 100 000 was in 20–29-year-olds, increasing by 96% from 27 in 2000 to 53 in 2009 (data not shown). The Indigenous versus non-Indigenous summary rate ratio was highest in the 15–19-year-old group (238.09) (Box 1).
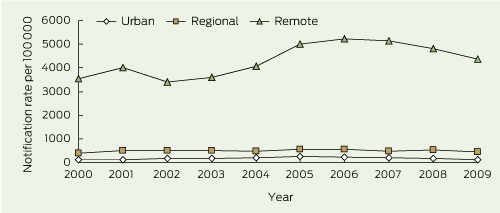
Among Indigenous people, the highest crude notification rate per 100 000 for gonorrhoea by area of residence was among those who resided in remote areas, which increased by 23% from 3530 in 2000 to 4356 in 2009 (Box 7). Among non-Indigenous people, the highest crude notification rate per 100 000 was in those who resided in remote areas, decreasing by 25% from 60 in 2000 to 45 in 2009 (data not shown). The Indigenous versus non-Indigenous summary rate ratio was highest in regional areas (95.47) and remote areas (80.46) (Box 1).
We found that a higher proportion of chlamydia notifications were among women. Possible explanations include preferential testing of women attending primary health services, compared with men.4 In contrast, we found that in non-Indigenous people, most gonorrhoea notifications were among men and those residing in urban areas. This is consistent with a study showing a gonorrhoea incidence of 2.9 per 100 person–years5 in urban men, compared with a 0.4% prevalence in women tested at an urban sexual health centre.6
The highest chlamydia and gonorrhoea notification rates were among 15–19-year-old Indigenous people. This finding could reflect enhanced clinical involvement of this group, including more testing and contact tracing. However, a study from far north Queensland does not support the possibility that more testing is occurring in this young age group.7 The higher rates are more likely to be due to higher prevalence and reinfection rates.8,9 A prevalence study in remote Indigenous communities in northern Australia found that chlamydia (19%) and gonorrhoea (17%) prevalences were much higher in 16–19-year-olds, compared with older age groups,10 and an analysis by Su and colleagues showed that chlamydia and gonorrhoea reinfection rates in central Australia were three and a half times greater among those aged less than 30 years compared with those aged over 30 years.8 A national survey of sexual health knowledge, risk behaviours and access to health services among young Indigenous people will further our knowledge of these areas of investigation.10
Our study also highlights the fact that among non-Indigenous people, chlamydia and gonorrhoea notification rates were higher among people who resided in regional and remote areas, compared with urban areas. A prevalence survey conducted in general practice clinics also found a higher chlamydia prevalence among non-Indigenous males in regional areas compared with urban areas.11 In our study, the higher notification rates for regional and remote areas for both populations could also be a reflection of an increase in risk-taking sexual behaviour, less access to health care, or more testing.
There have been several sexually transmitted infection (STI) programs established in remote Indigenous communities over the past decade, which have been successful in reducing chlamydia and gonorrhoea prevalence.12-14 These programs have included community STI screening, project planning and management, staff training, community-based education and health promotion, condom provision, research, surveillance, monitoring and evaluation. The services were also guided by an Indigenous governance structure and had dedicated sexual health coordinators.
Several factors must be considered when interpreting our results. First, this study does not include testing data to determine if increases in notification rates are the result of increased testing. Second, chlamydia notifications from three states and territories were excluded due to low completeness of reporting of Indigenous status. One solution to this issue is data linkage. A data linkage study in WA successfully reduced the proportion of STIs and bloodborne virus notifications from patients with unknown Indigenous status by 74%.15 Also, as notifications are derived from laboratories, the documentation of Indigenous status on laboratory forms could increase reporting completeness.
Received 25 January 2012, accepted 2 October 2012
- Simon Graham1
- Rebecca J Guy1
- Basil Donovan1,2
- Hamish McManus1
- Jiunn-Yih Su3
- Carol El-Hayek4
- Kellie S H Kwan5
- Amalie Dyda1
- Handan C Wand1
- James S Ward6
- 1 Aboriginal and Torres Strait Islander Health Program, Kirby Institute, University of New South Wales, Sydney, NSW.
- 2 Sydney Sexual Health Centre, Sydney Hospital, Sydney, NSW.
- 3 Sexual Health and Blood Borne Virus Unit, Centre for Disease Control, Department of Health, Darwin, NT.
- 4 Communicable Disease Control Directorate, Burnet Institute, Melbourne, VIC.
- 5 Communicable Disease Control Directorate, Public Health Division, Department of Health, Perth, WA.
- 6 Baker IDI Heart and Diabetes Institute, Alice Springs, NT.
Simon Graham and James Ward are Aboriginal Australians, and all authors recognise the Land on which this work was done, and thank the Aboriginal and Torres Strait Islander Australians who contributed to our study. We thank the departments that contribute to the NNDSS.
No relevant disclosures.
- 1. The Kirby Institute. Bloodborne viral and sexually transmitted infections in Aboriginal and Torres Strait Islander people: surveillance and evaluation report. Sydney: The Kirby Institute, The University of New South Wales, 2012. http://notes.med.unsw.edu.au/nchecrweb.nsf/page/AboriginalSurvRep (accessed Oct 2012).
- 2. Australian Bureau of Statistics. Experimental estimates and projections, Aboriginal and Torres Strait Islander Australians, 1991 to 2021. Canberra: ABS, 2006. (ABS Cat. No. 3238.0.) http://www.abs.gov.au/ausstats/abs@.nsf/0/4ef9b192cb67360cca256f1b0082c453 (accessed Oct 2012).
- 3. Australian Bureau of Statistics. Australian Standard Geographical Classification (ASGC). Canberra: Australian Bureau of Statistics, 2010. (ABS Cat. No. 1216.0.) http://www.abs.gov.au/AUSSTATS/abs@.nsf/DetailsPage/1216.0July%202010 (accessed Oct 2012).
- 4. Kong FYS, Guy RJ, Hocking JS, et al. Australian general practitioner chlamydia testing rates among young people. Med J Aust 2011; 194: 249-252. <MJA full text>
- 5. Jin F, Prestage GP, Mao L, et al. Incidence and risk factors for urethral and anal gonorrhoea and chlamydia in a cohort of HIV-negative homosexual men: the Health in Men Study. Sex Transm Infect 2007; 83: 113-119.
- 6. McDonagh P, Ryder N, McNulty AM, et al. Neisseria gonorrhoeae infection in urban Sydney women: prevalence and predictors. Sex Health 2009; 6: 241-244.
- 7. Hengel B, Mein J, Fagan P, et al; STRIVE Investigator Group. Health service utilisation patterns in FNQ remote communities: implications for STI testing [abstract]. Proceedings of the Australasian Sexual Health Conference; 2011 Sep 26-28; Canberra. Sydney: Australasian Society for HIV Medicine, 2011. https://secure.ashm.org.au/ei/viewpdf.esp?id=81&file=c%3A\Certain\Eventwin \docs\pdf\C11ASAbstract00593.pdf (accessed Nov 2012).
- 8. Su J-Y, Rahman S, Mactaggart W, et al. Prevalence of repeat infection with chlamydia and gonorrhoea in central Australia, 2005–2009 [abstract]. Proceedings of the Australasian Sexual Health Conference; 2011 Sep 26-28; Canberra. Sydney: Australasian Society for HIV Medicine, 2011. https://secure.ashm.org.au/ei/viewpdf.esp ?id=81&file=c%3A\Certain\Eventwin\docs\pdf\ c11asAbstract00168.pdf (accessed Nov 2012).
- 9. McGregor S, Guy R, Garton L, et al. Routine STI testing patterns in remote health services in the Northern Territory and far north Queensland [abstract]. Proceedings of the Australasian Sexual Health Conference; 2011 Sep 26-28; Canberra. Sydney: Australasian Society for HIV Medicine, 2011.
- 10. Arizmendi C, Worth H, Smith A, et al. Hearing from young Aboriginal and Torres Strait Islander people about their sexual health and wellbeing [abstract]. Proceedings of the Australasian Sexual Health Conference; 2011 Sep 26-28; Canberra. Sydney: Australasian Society for HIV Medicine, 2011. https://secure.ashm.org.au/ei/viewpdf.esp? id=81&file=c%3A\Certain\Eventwin\docs\pdf\ C11ASAbstract00632.pdf (accessed Nov 2012).
- 11. Peeling RW, Holmes KK, Mabey D, Ronald A. Rapid tests for sexually transmitted infections (STIs): the way forward. Sex Transm Infect 2006; 82 Suppl 5: v1-v6.
- 12. DeWitt DE. Analysis to synergy: why coordination of rural initiatives at metropolitan universities is important and timely. Aust J Rural Health 2007; 15: 225-226.
- 13. Guy R, Ward J, Smith KS, et al. The impact of sexually transmissible infection programs in remote Aboriginal communities in Australia: a systematic review. Sex Health 2012; 9: 205-212.
- 14. Huang RL, Torzillo PJ, Hammond VA, et al. Epidemiology of sexually transmitted infections on the Anangu Pitjantjatjara Yankunytjatjara Lands: results of a comprehensive control program. Med J Aust 2008; 189: 442-445.
- 15. Mak DB, Watkins RE. Improving the accuracy of Aboriginal and non-Aboriginal disease notification rates using data linkage. BMC Health Serv Res 2008; 8: 118.
Abstract
Objectives: To assess notification trends for chlamydia and gonorrhoea infections in Indigenous Australians compared with non-Indigenous Australians in 2000–2009.
Design and setting: We assessed trends in national notification rates using univariate Poisson regression and summary rate ratios.
Main outcome measures: Crude notification rates and summary rate ratios, by Indigenous status, sex, age and area of residence.
Results: Over the 10-year period studied, chlamydia notification rates per 100 000 increased by 80% from 1383 in 2000 to 2494 in 2009 among Indigenous people, and by 335% from 51 in 2000 to 222 in 2009 among non-Indigenous people. The Indigenous versus non-Indigenous summary rate ratio was 23.92 (95% CI, 23.65–24.19; P < 0.001). Gonorrhoea notification rates per 100 000 increased by 22% from 1347 in 2000 to 1643 in 2009 among Indigenous people, and by 70% from 10 in 2000 to 17 in 2009 among non-Indigenous people. The gonorrhoea summary notification rate ratio in Indigenous compared with non-Indigenous people was 173.78 (95% CI, 170.81–176.80; P < 0.001). In Indigenous people, the highest chlamydia and gonorrhoea notification rates were in women, 15–19-year-olds, and those living in remote areas.
Conclusions: Chlamydia and gonorrhoea notification rates have increased in both populations but were higher among Indigenous people. Our findings highlight the need for targeted prevention programs for young people, especially Indigenous Australians residing in remote areas.