


The impact of major sporting events on health and health care utilisation has been studied, with varying results. Some studies demonstrated a decrease in ED attendance,1-5 some no effect,6-9 and others an increase in workload.10-12 In the United States, women were more likely to attend the ED during World Series baseball games, whereas male attendance was reduced.13 Sporting events have been associated with increased rates of cardiovascular disease in some studies,14,15 but not others.3,5,6,16 Suicidal behaviour17-20 and assaults21,22 have also been associated with major sporting events.
The State of Origin series is an annual representative event between the rival states of Queensland and New South Wales. Rugby league is the most popular spectator sport in these states,23 and the State of Origin series is arguably the most important event on the rugby league calendar. The three-game series involves NRL players representing the state in which their first professional football club was located. The three games are played on non-consecutive Wednesday evenings during winter. They are broadcast on public television and run for around 2 hours from 8 pm, with the telecast usually starting 30 minutes earlier.
Queensland has a population of more than four and a half million people.24 The majority reside in the south-east corner of the state, with its two largest cities being Brisbane and the Gold Coast. The population is served by a public hospital system, with free access to emergency care available throughout the state.
Patient characteristics are summarised in Box 1. Significant differences were found for all age groups, except for patients over 60 years of age. Both males and females were significantly less likely to present on game days. A χ2 analysis comparing males with females indicated this was particularly so for males, although this effect did not reach significance (P = 0.06). Significant differences were also found across triage categories 2–4, with only patients in triage category 1 (requiring immediate intervention) and category 5 (non-urgent cases) presenting in similar numbers on game and control days. Reductions in presentations were seen across most ICD-10 diagnostic groupings. An analysis comparing individual sites with the number expected from the statewide total found no statistically significant variation (P = 0.08).
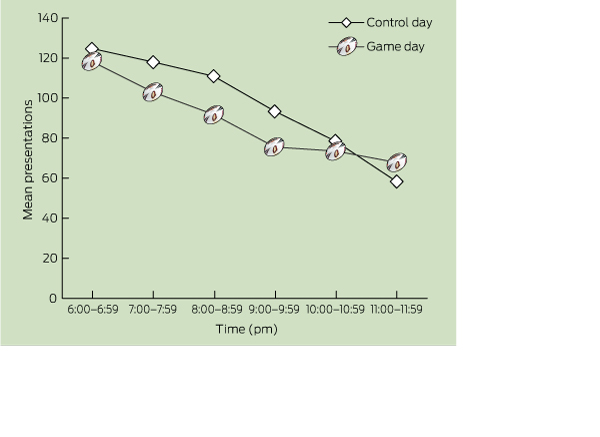
Box 2 shows the mean ED census on game and control days for the hours surrounding the State of Origin broadcast. Binomial tests indicated there were significant differences at each hour from 6 pm to midnight. The hours where this was least notable were during the 2 hours preceding kick-off, and at 2 hours after the game finished. The pattern was reversed after 11 pm, with proportionally more patients presenting to EDs on game days compared with control days.
These results are consistent with some of the literature. In the US, the Super Bowl football championship was associated with a significant reduction in ED census,1 while another study showed five fewer male registrations on football, baseball and basketball game days.2 In Canada during the 2010 Winter Olympics ice hockey final, EDs had 17% fewer patients per hour during game time, particularly for adult men with a low triage category.3
Not all studies have found similar results. Two studies in Northern Ireland found no effect of sporting events on a district hospital ED6 and a paediatric ED.8 An English study found no association with match days in the 1996 European Football Championship,7 and there was no significant effect on a poison information call centre during the 2010 Fédération Internationale de Football Association (FIFA) World Cup in South Africa.9 Other studies have found an increase in workload. In Spain, televised soccer games were associated with a 19.8% rise in demand for emergency care,11 and in Edinburgh, the opening game of the 1998 FIFA World Cup was associated with an increase in ED attendance.12 These differing findings suggest that our results, although significant, can perhaps not be generalised outside of rugby league fans in Queensland.
Our results showed that presentations increased after the telecast. Possible reasons for this include alcohol-related violence and injury, a “catching up” of presentations delayed by the game, or presentations precipitated by the game. A study in both English and Australian EDs on the effect of the 2003 Rugby World Cup Final, played between England and Australia, found attendance was down before kick-off in both countries, but increased after the game only in England, whose team won the game.25 This effect is likely to be complex and may involve expectations, team performance, time of day, weather and other factors.
Unlike some studies, our data did not show a statistically significant difference in presentations with ICD-10 codes for diseases of the circulatory system. In Munich during the 2006 FIFA World Cup, cardiovascular events were 2.66 times more likely on the German team’s game days than on control days, including a 2.49-fold increase in ST-elevation myocardial infarction.14 In the Netherlands, mortality from cardiovascular disease increased by a factor of 1.51 in men on the day the Dutch team was eliminated from the 2006 European Football Championship (an excess of 14 deaths).15 The authors hypothesised that this may have been caused by a combination of increased mental and emotional stress, alcohol intake, overeating and excessive smoking. In contrast, a study in Sydney found no significant increase in cardiac event risk associated with two stressful sporting events: an Australian Football League (AFL) grand final and a national soccer penalty shoot-out.16 As the local teams won in both cases, these authors suggested that adverse health events associated with stressful sporting events may be confined to supporters of the losing team. Unfortunately, with Queensland’s recent dominance in State of Origin, we did not have sufficient data on NSW victories to examine this theory further. An exploration of NSW ED data may be revealing.
Our data showed a statistically significant decrease in presentations with ICD-10 codes for injury and poisoning on game days. In contrast, during the 2010 FIFA World Cup, there was a 37.5% increase in assault attendances in the northwest of England when England played,21 and there were more trauma admissions in Ireland during the 2002 FIFA World Cup when Ireland played.10 In an Australian study, a single ED reported attendance for assault was 1.39 times more likely on days when the local AFL team won.22 Unlike many major sporting events, State of Origin is played on mid-week evenings, and there may have been an increase in trauma presentations the next day.
- Jeremy S Furyk1
- Jenine M Lawlor2
- Richard Franklin2
- Carl J O’Kane1
- David A Kault3
- Colin J Banks1
- Peter J Aitken1
- 1 Emergency Department, Townsville Hospital, Townsville, QLD.
- 2 School of Public Health and Tropical Medicine, James Cook University, Townsville, QLD.
- 3 School of Engineering and Physical Sciences, James Cook University, Townsville, QLD.
We would like to acknowledge the support of Sue Donnelly and Jean Sloan for assistance with data retrieval and arrangement. We would also like to thank the Queensland Emergency Medicine Research Foundation for its ongoing support of research capacity building in the Townsville Hospital Emergency Department.
No relevant disclosures.
- 1. Reich NT, Moscati R, Jehle D, Ciotoli M. The impact of a major televised sporting event on emergency department census. J Emerg Med 1994; 12: 15-17.
- 2. Jerrard DA. Male patient visits to the emergency department decline during the play of major sporting events. West J Emerg Med 2009; 10: 101-103.
- 3. Redelmeier DA, Vermeulen MJ. Emergency department visits during an Olympic gold medal television broadcast. Open Med 2011; 5: e112-e119.
- 4. Reis BY, Brownstein JS, Mandl KD. Running outside the baseline: impact of the 2004 Major League Baseball postseason on emergency department use. Ann Emerg Med 2005; 46: 386-387.
- 5. Savry C, Oger E, Chahir N, et al. Effect of the 1998 Soccer World Cup tournament on rescue requests. Intensive Care Med 2001; 27: 1224-1226.
- 6. McGreevy A, Millar L, Murphy B, et al. The effect of sporting events on emergency department attendance rates in a district general hospital in Northern Ireland. Int J Clin Pract 2010; 64: 1563-1569.
- 7. Cooke MW, Allan TF, Wilson S. A major sporting event does not necessarily mean an increased workload for accident and emergency departments. Br J Sports Med 1999; 33: 333-335.
- 8. Farrell S, Doherty GM, McCallion WA, Shields MD. Do major televised events affect pediatric emergency department attendances or delay presentation of surgical conditions? Pediatr Emerg Care 2005; 21: 306-308.
- 9. van Hoving DJ, Veale DJ, Gerber E. The influence of the 2010 World Cup on the Tygerberg Poison Information Centre. Clin Toxicol (Phila) 2011; 49: 181-186.
- 10. Murphy SM, Myers E, Kingston R, et al. Ireland in the World Cup: trauma orthopaedic workloads. Ir Med J 2003; 96: 119-120.
- 11. Perez-Ciordia I, Catalan Fabo F, Zalacain Nicolay F, et al. [Profile of the emergency demand and influence of televised soccer games on an extra-hospital center in the Tafalla health care district. Navarre, Spain] [Spanish]. Rev Esp Salud Publica 2003; 77: 735-747.
- 12. Mattick AP. The Football World Cup 1998: an analysis of related attendances to an accident and emergency department. Scott Med J 1999; 44: 75-76.
- 13. Cheng D, Yakobi-shvili R, Fernandez J. Major sport championship influence on ED gender census. Am J Emerg Med 2005; 23: 240-241.
- 14. Wilbert-Lampen U, Leistner D, Greven S, et al. Cardiovascular events during World Cup soccer. N Engl J Med 2008; 358: 475-483.
- 15. Witte DR, Bots ML, Hoes AW, Grobbee DE. Cardiovascular mortality in Dutch men during 1996 European football championship: longitudinal population study. BMJ 2000; 321: 1552-1554.
- 16. Bauman AE, van der Ploeg HP, Chey T, Sholler G. The hazards of watching football — are Australians at risk? Med J Aust 2006; 185: 684-686. <MJA full text>
- 17. Encrenaz G, Contrand B, Leffondre K, et al. Impact of the 1998 Football World Cup on suicide rates in France: results from the National Death Registry. Suicide Life Threat Behav 2012; 42: 129-135.
- 18. Joiner TE, Hollar D, Van Orden K. On Buckeyes, Gators, Super Bowl Sunday, and the Miracle on Ice: “pulling together” is associated with lower suicide rates. J Soc Clin Psychol 2006; 25: 179-195.
- 19. Fernquist RM. An aggregate analysis of professional sports, suicide, and homicide rates — 30 US metropolitan areas, 1971–1990. Aggress Violent Behav 2000; 5: 329-341.
- 20. Andriessen K, Krysinka K. Can sports events affect suicidal behavior? A review of the literature and implications for prevention. Crisis 2009; 30: 144-152.
- 21. Quigg Z, Hughes K, Bellis MA. Effects of the 2010 World Cup football tournament on emergency department assault attendances in England. Eur J Public Health 2012; Aug 8 [Epub ahead of print]. doi: 10.1093/eurpub/cks098.
- 22. Miller P, McDonald L, McKenzie S, et al. When the Cats are away: the impact of sporting events on assault- and alcohol-related emergency department attendances. Drug Alcohol Rev 2012; Jun 20 [Epub ahead of print]. doi: 10.1111/j.1465-3362.2012.00481.x.
- 23. Read B. League defies the scandals. The Australian 2009; 3 Sep. http://www.theaustralian.com.au/sport/league-defies-the-scandals/story-e6frg7mf-1225768992314 (accessed Oct 2012).
- 24. Queensland Government. Queensland population counter. http://www.oesr.qld.gov.au/products/briefs/pop-growth-qld/qld-pop-counter.php (accessed Oct 2012).
- 25. Moody WE, Hendry RG, Muscatello D. Were attendances to accident and emergency departments in England and Australia influenced by the Rugby World Cup Final 2003? Eur J Emerg Med 2007; 14: 68-71.
Abstract
Objective: To evaluate the effect of the State of Origin rugby league series on the number of emergency department (ED) presentations in Queensland.
Design and setting: Retrospective analysis of Emergency Department Information System data from 25 Queensland EDs for game days and matched control days during the annual State of Origin series from 2005 to 2012. The Queensland team won seven of the eight series in this period.
Main outcome measures: Number of patients presenting to Queensland EDs on 24 game days and 80 control days.
Results: Proportionally, a binomial test indicated there were significantly fewer ED presentations on game days (49 702) than on control days (172 351) (P < 0.001). On average, there were 2154 presentations per day on control days and 2071 on game days, representing a 4% reduction on game days.
Conclusion: We found that the State of Origin series was associated with fewer ED presentations on game days. We believe these results have broader implications for workforce planning and resource allocation.