


Public health and crisis planning depends largely on the cooperation of the public it intends to care for and protect. During an influenza pandemic, advice about preventing infection and containing the spread of disease is provided by local and national authorities, and is principally derived from the Australian Health Management Plan for Pandemic Influenza.1 However, such advice will be ineffective unless members of the public perceive this information as trustworthy and relevant, and are willing to comply with recommended behaviours.
In April 2009, the World Health Organization declared the first influenza pandemic since 1968–1969. However, doubts about its severity began to be raised, and when the numbers of severe cases proved to be a fraction of those initially feared, accusations of overreaction and exaggeration were made.2,3 If the public health response to H1N1 2009 is framed as a “false alarm” rather than a responsible approach to a threat of unknown virulence and transmissibility, then confidence in health authorities may be seriously undermined. Critically, this may reduce the public’s willingness to undertake recommended health-protective behaviours in the event of a future, and potentially more serious, pandemic.
In 2007, a validated question module addressing perceptions of a possible future influenza pandemic and willingness to comply with a series of health-protective behaviours was included in the New South Wales Population Health Survey.4 A repeat survey was undertaken in late 2009 to early 2010 to assess changes in public perception and response to a future pandemic in the context of the intervening 2009 H1N1 influenza pandemic.
A six-question module was developed and validated in 2007.4 Three questions addressed components of threat perception and general changes to behaviour (perceived likelihood of a future influenza pandemic, degree of concern that respondents themselves or their families would be affected if a pandemic occurred, and degree to which changes had been made due to the threat of a pandemic). The remaining three questions addressed willingness to comply with health-protective behaviours (willingness to be vaccinated against influenza, willingness to be isolated if needed, and willingness to wear a face mask; Box 1). Responses for all questions were structured as five-point Likert scales, with responses “extremely”, “very”, “moderately”, “a little”, and “not at all” used for all questions. Both surveys also included a broad set of demographic, socioeconomic and health indicator items.
The first study (S2007) was conducted between 22 January and 31 March 2007, and was included in the 2007 NSW Population Health Survey. The second study (S2010) was conducted as a stand-alone survey between 29 October 2009 and 20 February 2010; we began to administer this survey 3 months after the peak of the H1N1 2009 pandemic and 1 month after the pattern of NSW cases had declined to normal seasonal levels.5,6 Both studies used the sampling and administration protocols of the NSW Population Health Survey, and were administered through computer-assisted telephone interviewing (CATI).7 The target population for both surveys was residents of NSW aged 16 years or above, stratified by area health region.
NSW Health Population Health Survey weighting methods were used to adjust for the probability of selection and for differing non-response rates among men and women, and among different age groups.8 The responses for each question were expressed as dichotomous variables, with a value of 1 assigned to a response of “very” or “extremely” and a value of zero to other responses. This approach was used for all variables except “degree of changes made”, for which the responses “extremely”, “very”, “moderately” and a “little” were combined and assigned the value of 1.
Data on health-protective behaviours were analysed as outcome measures, with threat perception and general behaviour change variables used as independent variables. Full analyses of S2007 data have been previously reported.4,9,10
In total, 2081 NSW residents participated in S2007 and 2038 participated in S2010. Response rates were 64% and 57%, respectively. The only statistically significant difference across key demographic variables was “children in the household”, the rate of which was lower in the 2010 sample (P < 0.001). Previous analysis of the S2007 sample indicated it was similar to the Australian general population for most demographic variables,7 so it was assumed that the 2010 sample was similarly comparable.
Statistically significant changes were noted across four of the six indicators from S2007 to S2010 (Box 1). The proportion of the general population who thought a future pandemic was highly likely to occur increased greatly (by 28.9%), as did the proportion reporting that they had made some degree of change to their lives due to the possibility of a future pandemic (a 15.8% increase). Conversely, concern that survey respondents or their families would be directly affected by a future pandemic dropped 12.0% between the two surveys. These differences were all statistically significant.
We conducted multiple logistic regression analysis on S2007 and S2010 data separately, using the health-protective behaviour indicators as outcome measures and a range of sociodemographic, health and threat-perception indicators as explanatory variables. Significant associations between these threat-perception indicators and the health-protective behaviours for S2007 and S2010 are presented in Box 2. In all statistically significant findings, an increased level of threat perception was associated with increased willingness to comply with health-protective behaviours. Most notably, in both the S2007 and S2010 analyses, a high level of concern that respondents or their families would be directly affected by a future pandemic was the only variable consistently associated with increased willingness to comply with all health-protective behaviours. These latter associations were all highly significant (P < 0.001).
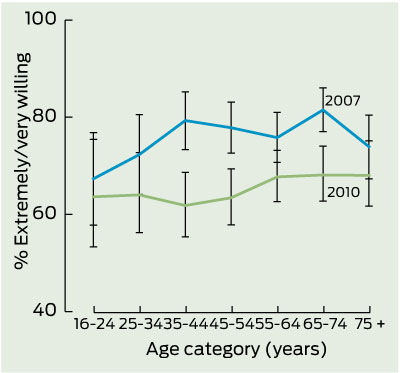
Although we have not included the wider analysis of S2007 and S2010 sociodemographic data here, a range of significant associations were noted for the three health-protective behaviours studied. Box 3 shows prevalence estimates and 95% CIs for willingness to be vaccinated for all age categories in the adult general population in S2007 and S2010. This figure clearly shows the overall decline in willingness to be vaccinated over this time period, with statistically significant reductions among those aged 35–44, 45–54, and 65–74 years.
Our study indicates substantial changes in public attitudes to a future influenza pandemic between S2007 and S2010. The greatest change was the increase in those who considered a future influenza pandemic likely to occur. The simplest explanation for this change was the intervening H1N1 influenza pandemic in 2009. In contrast, levels of concern about being directly affected by a future influenza pandemic decreased substantially in S2010. Australian research conducted during the 2009 H1N1 pandemic noted declines in public perceptions of the severity of the pandemic during the first 6 months; in May, 43% considered that the H1N1 2009 pandemic could affect their health very seriously, compared with 25% in September and October.11,12
There are at least two plausible explanations for this decrease in concern for personal vulnerability to a future pandemic; both linked to changes in expectations of severity. First is the overwhelming public sense that the 2009 pandemic was mild, and second is that the effective response of health authorities and the public to the H1N1 2009 pandemic may have reduced the perception that it was a significant personal health threat and that it was possible to limit spread through non-pharmaceutical approaches. Both these explanations also link to public understanding of the term “pandemic”. Australian research in 2007 indicated that people had a poor understanding of the term “pandemic influenza”,13 and European data suggested lay people perceived a pandemic as something frightening, prevalent and severe. The H1N1 2009 pandemic did not match these expectations.14 In Australia and New Zealand, challenges in communicating the mild nature of the disease in most with the potential for severe disease in a few were noted.15
It has been widely reported that the public regarded the response to the 2009 pandemic as excessive, with claims that it was a false pandemic, and that governments had overreacted.16,17 Australian health professionals have raised questions about the level of the response in relation to the intensity of H1N1 2009.18 With regard to future pandemics, there is now a greater public sense of personal and collective control over the threat, and of lowered trust and confidence in health authorities to take a measured approach. Future influenza pandemics will be framed by the H1N1 2009 experience.
The level of willingness to be vaccinated in response to a future pandemic found in our study (64.6%) was slightly higher than the proportion reporting anticipated uptake of influenza vaccine before the vaccine became available for the 2009 pandemic; 55% in Australia,11 46%–57% and 58% in the United States.18,19 One Australian study found that anticipated uptake of pandemic influenza vaccine in 2007 dropped considerably in the context of the 2009 pandemic, from 88% to 67%.20 Our S2010 data clearly indicate that willingness to be vaccinated in a future pandemic was associated with higher concern for respondents themselves or their families being affected and greater level of current life changes. Similar findings have been reported in two other recent Australian studies.12,20 In this context, the reported decline in willingness to be vaccinated among those aged 35–44 years is notable, particularly as this group may have oversight of the vaccination of children and adolescents in a future pandemic. It is also worth noting that eventual actual vaccine uptake is likely to be lower than anticipated uptake. Uptake of the H1N1 2009 pandemic vaccine has been reported as only 18.1% nationally,21 which is far lower than indicated in studies of anticipated uptake.11,20 Reasons for lower levels of uptake were, largely, that the pandemic was perceived as a low health risk and there were concerns about potential side effects of the vaccine;21 however, other factors, such as uncertainties about the effectiveness of influenza vaccine in certain age groups,22 might also influence uptake.
1 Prevalence estimates for 2007 and 2010 influenza pandemic threat perception and anticipated behavioural response indicators and multiple logistic regression adjusted odds ratios
How likely do you think it is that an influenza pandemic will occur in Australia? |
|||||||||||||||
Received 20 December 2011, accepted 14 August 2012
- Melanie R Taylor1
- Garry J Stevens2
- Kingsley E Agho3
- Sheree A Kable4
- Beverley Raphael5
- School of Medicine, University of Western Sydney, Sydney, NSW.
Both studies were funded by the Australian Government. The 2007 study was funded by Emergency Management Australia, Attorney-General’s Department and the 2010 study was funded by National Security Science and Technology Branch of the Department of the Prime Minister and Cabinet. We would like to thank Margo Barr, Matthew Gorringe and Lindy Fritsche, Centre for Epidemiology and Research, New South Wales Ministry of Health, who provided assistance with question development, validation, and data collection.
No relevant disclosures.
- 1. Department of Health and Ageing. Australian health management plan for pandemic influenza (2009). Canberra: Commonwealth of Australia, 2010. http://www.health.gov.au/internet/panflu/publishing.nsf/Content/ahmppi-2009 (accessed Oct 2011).
- 2. Lauder S. Swine flu response described as over-reaction. ABC News AM [radio program] 2009; 13 Jun. http://www.abc.net.au/am/content/2009/s2597343.htm (accessed Nov 2011).
- 3. Sweet M. Swine flu, vaccination and other matters of trust. Inside Story [internet] 2010; 3 Feb. http://inside.org.au/swine-flu-vaccination-and-other-matters-of-trust/ (accessed Nov 2011).
- 4. Barr M, Raphael B, Taylor M, et al. Pandemic influenza in Australia: using telephone surveys to measure perceptions of threat and willingness to comply. BMC Infect Dis 2008; 8: 117.
- 5. NSW Department of Health. Pandemic (H1N1) 2009 influenza update [media release]. 3 Sep 2009. http://www.health.nsw.gov.au/news/2009/20090903_00.html (accessed Nov 2011).
- 6. Department of Health and Ageing. Australian influenza surveillance summary report. No. 30, 2009, reporting period: 28 November – 4 December 2009. http://www.health.gov.au/internet/main/publishing.nsf/Content/2379DC9A34A8CB0FCA 25770D001B8540/$File/ozflu-no30-2009.pdf (accessed Nov 2011).
- 7. Barr M, Baker D, Gorringe M, Fritsche L. NSW population health survey: description of methods. Sydney: Centre for Epidemiology and Research, NSW Health, 2008. http://www.health.nsw.gov.au/resources/publichealth/surveys/health_survey_methods.pdf (accessed Nov 2011).
- 8. Steel, D. NSW Health Survey: review of weighting procedures. Sydney: Centre for Epidemiology and Research, NSW Health, 2008. http://www.health. nsw.gov.au/pubs/2006/pdf/review_weighting.pdf (accessed Nov 2011).
- 9. Taylor M, Raphael B, Barr M, et al. Public health measures during an anticipated influenza pandemic: factors influencing willingness to comply. Risk Manag Healthc Policy 2009; 2: 9-20.
- 10. Jacobs J, Taylor M, Agho K, et al. Factors associated with increased risk perception of pandemic influenza in Australia. Influenza Research and Treatment 2010; 2010: 947906. doi: 10.1155/2010/947906. http://www.hindawi.com/journals/irt/2010/947906/ (accessed Aug 2012).
- 11. Seale H, McLaws ML, Heywood AE, et al. The community’s attitude towards swine flu and pandemic influenza. Med J Aust 2009; 191: 267-269. <MJA full text>
- 12. Seale H, Heywood AE, McLaws ML, et al. Why do I need it? I am not at risk! Public perceptions towards the pandemic (H1N1) 2009 vaccine. BMC Infect Dis 2010; 10: 99.
- 13. Eastwood K, Durrheim D, Francis JL, et al. Knowledge about pandemic influenza and compliance with containment measures among Australians. Bull World Health Organ 2009; 87: 588-594.
- 14. Hanquet G, Van Damme P, Brasseur D, et al. Lessons learnt from pandemic A(H1N1) 2009 influenza vaccination. Highlights of a European workshop in Brussels (22 March 2010). Vaccine 2011; 29: 370-377.
- 15. Kotsimbos T, Waterer G, Jenkins C, et al; Thoracic Society of Australia and New Zealand H1N1 Influenza 09 Task Force. Influenza A/H1N1_09: Australia and New Zealand’s winter of discontent. Am J Respir Crit Care Med 2010; 181: 300-306.
- 16. Macrae F. The ‘false’ pandemic: drug firms cashed in on scare over swine flu, claims Euro health chief. Mail Online [internet] 2010; 10 Jan. http://www. dailymail.co.uk/news/article-1242147/The-false-pandemic-Drug-firms-cashed-scare-swine-flu-claims-Euro-health-chief.html#ixzz1UnTLDsW4 (accessed Dec 2011).
- 17. SteelFisher GK, Blendon RJ, Bekheit MM, Lubell K. The public’s response to the 2009 H1N1 influenza pandemic. N Engl J Med 2010; 362: e65.
- 18. Kelly HA. A pandemic response to a disease of predominantly seasonal intensity. Med J Aust 2010; 192: 81-83. <MJA full text>
- 19. Ibuka Y, Chapman GB, Meyers LA, et al. The dynamics of risk perceptions and precautionary behavior in response to 2009 (H1N1) pandemic influenza. BMC Infect Dis 2010; 10: 296-307.
- 20. Eastwood K, Durrheim DN, Jones A, Butler M. Acceptance of pandemic (H1N1) 2009 influenza vaccination by the Australian public. Med J Aust 2010; 192: 33-36. <MJA full text>
- 21. Australian Institute of Health and Welfare. 2010 Pandemic Vaccination Survey: summary results. Canberra: AIHW. 2010. (AIHW Cat. No. PHE 128.) http://www.aihw.gov. (accessed Aug 2012).
- 22. Osterholm MT, Kelley NS, Sommer A, Belongia EA. Efficacy and effectiveness of influenza vaccines: a systematic review and meta-analysis. Lancet Infect Dis 2012; 12: 36-44.
Abstract
Objective: To determine changes in public threat perception and anticipated compliance with health-protective behaviours in response to a future pandemic; using data collected before and after the H1N1 2009 influenza pandemic.
Design, setting and participants: Repeat cross-sectional computer-assisted telephone surveys with representative samples of the general New South Wales population in 2007 (2081 participants) and 2010 (2038 participants).
Main outcome measures: Perceived likelihood of a future pandemic in Australia; concern that respondents or their families would be affected; degree of change made to life because of the possibility of a pandemic; and willingness to comply with health-protective behaviours (to be vaccinated, to be isolated if necessary, and to wear a face mask).
Results: In 2007, 14.9% of the general population considered that an influenza pandemic would be highly likely to occur in future; this proportion rose to 42.8% in 2010 (odds ratio [OR], 4.96; 95% CI, 3.99–6.16; P < 0.001). Conversely, in the same period concern that respondents or their families would be directly affected by a future pandemic dropped from 45.5% to 32.5% (OR, 0.57; 95% CI, 0.44–0.74; P < 0.001). Willingness to be vaccinated against influenza in a future pandemic decreased from 75.4% to 64.6% (OR, 0.69; 95% CI, 0.55–0.86; P < 0.001). A general decrease in willingness to be vaccinated was noted across all age groups, most notably for those aged 35–44 years.
Conclusions: Data collected before and after the H1N1 2009 influenza pandemic indicated significant shifts in public threat perception and anticipated response to a future pandemic. The H1N1 2009 pandemic has altered public perceptions of the probability of a pandemic in the future, but has left the public feeling less vulnerable. Shifts in perception have the potential to reduce future public compliance with health-protective measures, including critical elements of the public health response, such as vaccination.