


Persistent (or chronic) pain will afflict one in five Australians during their lifetime1 and is estimated to cost the Australian economy $34 billion per annum.2 Chronic pain has significant effects on a person’s physical and psychological wellbeing, with poor fitness, high rates of psychological distress including suicidality,3 impaired work performance,4 and high use of health care services.5,6 Specialised assessment and treatment processes, including an interdisciplinary team approach and group pain management programs are an established standard of care.7
Substantial evidence exists for both the efficacy and effectiveness of cognitive behaviour therapy within a pain clinic environment,8,9 with consistent improvements in pain experience and interference, psychological wellbeing and physical functioning. Similarly, early cognitive,10 physical11 or pharmacological12 interventions have been shown to reduce the frequency and severity of some persistent pain states. Consistent with this, a systematic review of the influence of excessive waiting times for access to appropriate pain management found evidence of poorer outcomes in terms of patient quality of life and psychological wellbeing for people waiting up to 6 months for assessment by a pain management service.13
Level 2 — MDP clinic but without research and/or teaching;
Level 3 — Pain clinic without multi or interdisciplinary care;
Level 4 — Modality orientated clinic that uses a single practice or pain management method (subsequent revisions to these criteria have merged Levels 3 and 4 into a pain practice grouping).14
Twenty-two of the 57 participating services (39%) were associated with an acute pain service (PS), five (9%) services incorporated an acute PS, with the remaining 30 (53%) having no affiliation with an acute PS. Twenty-three services (40%) did not have access to inpatient care. Persistent pain management service provision by state, region, type of service, funding and use of pain management programs (PMPs) is described in Box 1.
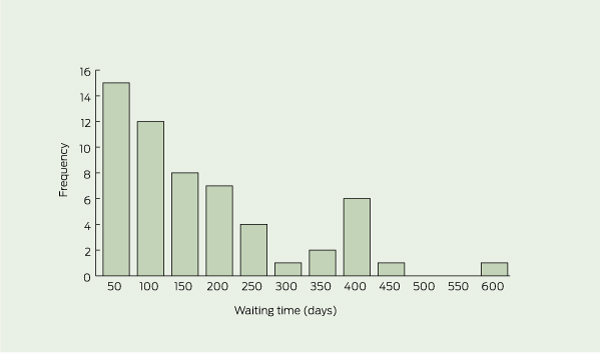
Median, ranges, and interquartile ranges for waiting time information based on region, funding and IASP classifications are presented in Box 2. Box 3 shows the frequency distribution of waiting times and demonstrates that the distribution was skewed (Shapiro–Wilk statistic, 0.845; P < 0.001). The waiting time for initial assessment for a new persistent pain outpatient referral was less for privately funded services (mean rank, 14.7) than publicly funded (mean rank, 35.7) or combination funded services (mean rank, 35.5; Kruskal–Wallis H(df, 2) = 19.5; P < 0.001).
The Waiting in Pain project provides a snapshot of current specialist pain management services throughout Australia. We have shown a range of service provision characteristics and waiting times, possibly reflecting their stages of development, location, or funding processes. The lack of both national benchmarks for quality and access to multidisciplinary care for patients suffering persistent pain are recognised as problems and are development goals in the National Pain Strategy.7 Our results on waiting times are similar to those reported from Canada, where an estimated 0.15% of the population used persistent pain services (incorporating paediatric services) each year.15 A subsequent analysis of a sample of patients on waiting lists of Canadian pain facilities showed that most report severe pain (scored > 7/10 in severity) with high levels of depression and suicidality.16
Based on our data and the Australian Bureau of Statistics June 2009 estimate of population (17 690 281 people aged > 15 years) for service activity estimations, 0.18% of the population were assessed by an adult persistent pain service.17 Activity rates per head of population are lower for non-capital city services, although many patients from these areas will travel to cities for access to specialist care. A telephone survey of an Australian sample population found high levels of pain-related disability in 27% of the 22% of their participants who reported chronic pain.5 Higher rates of disability were associated with greater use of health care resources and medications, suggesting that about 5% of the population could potentially benefit from access to MDP management services.
Our discussions with directors of specialist paediatric pain services revealed difficulties establishing these services, with subsequent limited capacity. When considering the services of the two states with the largest estimated populations of people aged less than 15 years,17 we estimate that new persistent pain assessments are being made for 0.01%–0.02% of this population; this is consistent with the Canadian assessment of underdeveloped services for this population.18 A moderate waiting time in the setting of low capacity reflects a limited referral base, despite chronic pain being reported as common in children and adolescents.19 Given the strong evidence of multidisciplinary care in reducing pain and disability in children with persistent pain,20 improving access by developing staff and services throughout Australia needs to be a priority.
At the other end of the population spectrum, older people are known to have a higher prevalence of persistent pain,21 yet only a small number of persistent pain services have programs designed for older people; demand for such programs may be expected to increase with the ageing of the population.
A consequence of poor geographical access and prolonged waiting times is a reluctance of general practitioners to refer patients for specialist services. In an analysis of referral patterns of 37 family practitioners in Ontario, the three most frequently cited reasons for referring patients to a pain service were requests for injections, desire for specialist expertise and concern about opioids, whereas long waiting lists, patient preference for other treatments and distance from pain services were the three most prevalent barriers to referral.22 Few of the existing pain services described a process for evaluating rural clients, although this practice may increase following the federal government’s 2011 Medicare-based initiative to support telemedicine.23
Participation and data quality can be limitations of surveys of this type. Although we had a high rate of participation among the multidisciplinary services we identified, we did not assess the significant services provided by single specialists, GPs with an interest in pain management, and other speciality areas that may provide pain management (eg, rheumatology). In terms of data quality, fewer than half of the persistent pain management services we surveyed had data that were systematically and electronically captured by their supporting organisation; data collection may improve if waiting times for outpatient services are part of mandatory reporting data within activity-based funding agreements. In addition, our questionnaire was not assessed for reliability or validity. Since we completed this project, a number of developments have targeted access issues at a local level. These include the plan initiated by the Queensland Government to develop regional pain management services, the introduction of a “preclinic” self-management education program by the Freemantle pain management service24 and a process of engagement with community-based services initiated in the Hunter region of NSW, with a subsequent reduction in waiting times for MDP service assessment.25 Given that excessive waiting in pain is associated with worsening health, that early access to pain management improves outcomes, and that the Australian population is ageing, greater national political support to improve access to pain management services is required.
1 Data on persistent pain management services relative to the Australian adult population, state, region, type of service, funding and use of pain management programs (PMPs)
International Association for the Study of Pain classification level† |
|||||||||||||||
Received 23 January 2012, accepted 5 March 2012
- Malcolm N Hogg1,2
- Stephen Gibson3,2
- Amal Helou4
- Jacklyn DeGabriele5
- Michael J Farrell6
- 1 Department of Anaesthesia and Pain Management, Royal Melbourne Hospital, Melbourne, VIC.
- 2 Australian Pain Society, Sydney, NSW.
- 3 National Ageing Research Institute, Melbourne, VIC.
- 4 Pain Management Unit, Royal Prince Alfred Hospital, Sydney, NSW.
- 5 Royal Women’s Hospital, Melbourne, VIC.
- 6 Florey Neurosciences Institute, Melbourne, VIC.
We, on behalf of the APS, thank all the participating services. Jacklyn DeGabriele’s participation was supported by a grant from the APS and the Department of Anaesthesia and Pain Management, Royal Melbourne Hospital.
Malcolm Hogg and his employer have received honoraria for GP education services and advisory board participation from Mundipharma and Janssen-Cilag. The APS receives sponsorship for its Annual Scientific Meeting and Research Scholarship Program from a range of pharmaceutical and medical device companies. These include Mundipharma, Janssen-Cilag, Pfizer Australia, and Medtronic Australasia.
- 1. Blyth FM, March LM, Brnabic AJM, Cousin MJ. Chronic pain in Australia: a prevalence study. Pain 2001; 89: 127-134.
- 2. The high price of pain: the economic impact of persistent pain in Australia in 2007. Report by Access Economics Pty Limited for MBF Foundation in collaboration with the University of Sydney Pain Management Research Institute. November 2007. http://www.bupa.com.au/staticfiles/BupaP3/Health%20and%20 Wellness/MediaFiles/PDFs/MBF_Foundation_the_price_of_pain.pdf (accessed Nov 2011).
- 3. Yang NK, Crane C. Suicidality in chronic pain: a review of the prevalence, risk factors and psychological links. Psychol Med 2006; 36: 575-586.
- 4. Van Leeuwen MT, Blyth FM, Nicholas MK, Cousins MJ. Chronic pain and reduced work effectiveness: the hidden costs to Australian employers. Eur J Pain 2006; 10: 161-166.
- 5. Blyth FM, March LM, Nicholas MK, Cousins MJ. Chronic pain related disability and use of analgesia and health services in a Sydney community. Med J Aust 2003; 179: 84-87. <MJA full text>
- 6. Blyth FM, March LM, Brnabic AJ, Cousins MJ. Chronic pain and frequent use of health care. Pain 2004; 111: 51-58.
- 7. National Pain Summit initiative. National Pain Strategy. Pain management for all Australians. March 2010. http://www.anzspm.org.au/c/anzspm?a=sendfile&ft=p&fid=1320268502&sid= (accessed Nov 2011).
- 8. Morley S, Williams A, Hussain S. Estimating the effectiveness of cognitive behavioural therapy in the clinic: evaluation of a CBT informed pain management programme. Pain 2008; 137: 670-680.
- 9. Eccleston C, Williams AC, Morley S. Psychological therapies for the management of chronic pain (excluding headache) in adults. Cochrane Database Syst Rev 2009; (2): CD007407.
- 10. Linton SJ, Anderson T. Can chronic disability be prevented? A randomised trial of a cognitive-behavoural intervention and two forms of information for spinal pain patients. Spine 2000; 25: 2825-2831.
- 11. Cedraschi C, Desmeules J, Rapiti E, et al. Fibromyalgia: a randomised controlled trial of a treatment programme based on self management. Ann Rheum Dis 2004; 63: 290-296.
- 12. Bowsher D. Factors influencing the feature of postherpetic neuralgia and outcome when treated with tricyclics. Eur J Pain 2003; 7: 1-7.
- 13. Lynch ME, Campbell F, Clark AJ, et al. A systematic review of the effect of waiting for treatment for chronic pain. Pain 2008; 136: 97-116.
- 14. International Association for the Study of Pain. Recommendations for pain treatment services. http://www.iasp-pain.org/AM/template.cfm? Section=Pain_Treatment_Facilities (accessed Jun 2008).
- 15. Peng P, Choiniere M, Dion D, et al. Challenges in accessing multidisciplinary pain treatment facilities in Canada. Can J Anaesth 2007; 54: 977-984.
- 16. Choiniere M, Dion D, Peng P, et al. The Canadian STOP-PAIN project. Part 1: Who are the patients on the waitlists of multidisciplinary pain treatment facilities? Can J Anaesth 2010; 57: 539-548.
- 17. Australian Bureau of Statistics, Australian demographic statistics. June quarter 2009. Released 3 Dec, 2009. (ABS Cat No. 3101.1.) http:// www.ausstats.abs.gov.au/Ausstats/subscriber.nsf/0/FB52766C453652E1CA 25768000196B47/$File/31010_jun% 202009.pdf (accessed Feb 2010).
- 18. Peng P, Stinson JN, Choiniere M, et al. Dedicated multidisciplinary pain management centres for children in Canada: the current status. Can J Anaesth 2007; 54: 985-991.
- 19. van Dijk A, McGrath PA, Picket, et al. Pain prevalence in nine to 13 year-old school children. Pain Res Manag 2006; 11: 234-240.
- 20. Palermo TM, Eccleston C, Lewandowski AS, et al. Randomised controlled trials of psychological therapies for the management of chronic pain in children and adolescents: an updated meta-analytic review. Pain 2010; 148: 387-397.
- 21. Jones G, Macfarlane G. Epidemiology of pain in older persons. In: Gibson S, Weiner D, editors. Pain in older persons: progress in pain research and management. Vol 35. Seattle: IASP Press, 2005: 3-22.
- 22. Lakha SF, Yegneswaran B, Furlan JC, et al. Referring patients with chronic noncancer pain to pain clinics: survey of Ontario family physicians. Can Fam Physician 2011; 57: e106-e112.
- 23. Telehealth — modernising medicine by providing rebates for online consultations. MBS Online. Medicare Benefits Schedule. http://www. mbsonline.gov.au/internet/mbsonline/publishing.nsf/Content/mbsonline-telehealth-landing.htm (accessed Mar 2012).
- 24. Davies S, Quintner J, Parsons R, et al. Pre-clinic group education sessions reduce waiting times and costs at public pain medicine units. Pain Med 2011; 12: 59-71.
- 25. Hayes C, Hodson FJ. A whole person model of care for persistent pain: from conceptual framework to practical application. Pain Med 2011; 12: 1738-1749.
Abstract
Objectives: To document and describe outpatient persistent pain management services in Australia.
Design, participants and setting: Systematic survey conducted between 1 December 2008 and 31 January 2010 of 57 services providing outpatient care to adult clients with persistent pain, plus five specialised paediatric services throughout Australia.
Main outcome measures: Service structure, including funding processes; activity, including client numbers, access to specialised services (inpatient care, pain relief interventions); waiting times; and use of allied-health-professional-based pain management programs.
Results: Of 68 services identified, 57 participated in the study. The median waiting time from referral receipt to initial clinical assessment for a publicly funded outpatient adult pain management service was 150 days, compared with 38.5 days for a privately funded service (P < 0.05). There was substantial variability among providers in range of services offered, including provision and duration of allied-health pain management programs. The level of service provision for children and rural patients is notably lower than that reported for urban adult constituents.
Conclusions: Persistent pain management services are currently unable to meet service requirements adequately, and waiting times are more prolonged for publicly funded than privately funded services. Greater service provision is required in rural areas and for children.