


Chronic diseases such as cardiovascular disease and cancer are the most common public health threats in the 21st century. Cancer accounted for about 19% of the total disease burden in Australia in 20101 and the Australian community pays about $3.8 billion per year in direct health system costs.2 With the increasing and ageing population, the burden caused by cancer and the direct costs to the community will only increase. More and more people are now living with a diagnosis of cancer, and this also has indirect costs in support and follow-up services.
Fortunately, in spite of the large and increasing impact of chronic diseases, they are also the most preventable diseases.3 Only about 5%–10% of cancers are due to genetic or inherited disorders, with the remainder being due to external factors (environmental factors or those related to human behaviour).4 The best evidence for this is from studies of people who have migrated.5,6 Clearly, not all external factors associated with cancers are understood or quantified.
Recognising the need to address this lack of knowledge, the World Cancer Research Fund (WCRF) and the American Institute for Cancer Research (AICR) assembled an international group of cancer experts in 2004. Experts in cancer epidemiology, nutrition, public health and cancer biology systematically examined the association between food, nutrition and physical activity (including body fatness) and the prevention of cancer.3 They then calculated population-attributable fractions (PAFs) for the specific cancers included in their review.7 These PAFs represent the proportion of cancer incidence that could be prevented if poor nutrition and diet, physical inactivity and obesity were eliminated, while leaving other risk factors unchanged.
While the theoretical impact of primary prevention is substantial, motivating populations to improve their health status is difficult. Therefore, unless a concerted and significant effort is made to invest in and implement powerful preventive measures, the impact of primary prevention on reducing total cancer incidence over the coming decades will probably be relatively small.8 Preventive measures are unlikely to be initiated by governments and policymakers in Australia unless they are viewed as high priority. Typically, this requires quantitative evidence.
Cancer incidence data between 1982 and 2007 were obtained,9 with data grouped by cancer site, 5-year age group (up to 85 years or more) and sex. We focused on the cancer types included in the WCRF/AICR report that were therefore demonstrated to have some proportion of cases preventable by improved nutrition and physical activity. These comprised 12 types of cancers: mouth and laryngeal (C00–C02, C32), oesophageal (C15), lung (C33 and C34), stomach (C16), pancreatic (C25), gallbladder (C23 and C24), liver (C22), bowel (C18–C20), breast (C50), uterine (C54 and C55), prostate (C61) and kidney (C64) cancers, along with all cancer types combined (C00–C97, D45, D46, D47.1, D47.3). We did not include male breast cancer cases due to the small number of cases diagnosed each year.
We were unable to match two categories of cancer in this study to the definitions in the WCRF/AICR report, due to the availability of Australian cancer incidence data. Therefore, instead of mouth, pharyngeal and laryngeal cancers (C00–C09, C10–C14, C32), we reported mouth and laryngeal cancers only (C00–C02, C32). Based on unpublished data,10 mouth and laryngeal cancers comprised about 54% of the original mouth, pharyngeal and laryngeal cancers group. Similarly, we included all uterine cancers (C54 and C55), although the WCRF/AICR report only included endometrial cancers (C54.1), representing about 82% of all uterine cancers.10
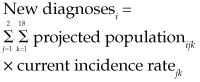
We used a two-stage process to estimate the number of cancers that would be diagnosed in 2025 and that could be prevented by diet and physical activity. First, we estimated the number of cancers that would be diagnosed in 2025 by applying the current age- and sex-specific incidence rates to the age- and sex-specific population projections. This method assumes that the age- and sex-specific cancer incidence rates, averaged over the years 2005–2007, will remain constant until 2025. The eventual validity of this assumption cannot be determined, but a similar modelling process was used recently for a major study,11 and the overall Australian cancer incidence rates have increased by less than 2% per year since 1998.9 Second, we multiplied the projected numbers of cancers by the published PAF estimates (percentages) from the WCRF/AICR report.
The Australian Bureau of Statistics (ABS) has published three main series (A, B and C) of population projections for the Australian population from 2006–2101.12 Series B largely reflects current trends in fertility, life expectancy at birth, net overseas migration and net interstate migration, and series A and C are based on high and low assumptions of these variables, respectively.
To estimate the number of preventable cancer cases for each cancer type, we multiplied the year-specific projected number of cancer cases by the corresponding PAF for that cancer. These data were obtained from the WCRF/AICR report (see Box 1).13 Separate estimates were published for the United States and the United Kingdom, and we applied the average of those two estimates to the Australian data since they shared similar socioeconomic, cultural and environmental characteristics.
Based on current trends in cancer incidence, population growth and ageing, our projections suggest that about 170 000 Australians will be diagnosed with cancer in 2025. This is an increase of almost 60% on the incidence in 2007 (almost 110 000) (Box 1 and Box 2). As shown in Box 1, the ageing of the population means that the gradient for cancer incidence projections is steeper than for population projections. By applying the WCRF/AICR preventability estimates, we suggest that by 2025, almost 43 000 of these cancers could be prevented through improvements in diet and physical activity levels, including their impact on obesity. The different population projection series had only a minimal impact on these projections of cancer incidence (Box 2). There were some differences between 2007 and 2025 in the ranking of cancer types according to the number of preventable cancers, reflecting the number of projected cancers and the preventable fraction of them.
We estimated that bowel cancer would have the most cases in 2025 that would be preventable by changes in nutrition and physical activity. The middle estimate was 10 049 cases (Box 2). This was followed by female breast cancer with 7273 preventable cases. While only a relatively small proportion of prostate cancers are considered preventable (16%), the very high number of projected cases in 2025 meant that 4882 cases would have been preventable by 2025. Lung cancer (5736) and mouth and laryngeal cancers (2054) were also in the top five cancers whose incidence could be reduced by changes in diet and physical activity.
More complex and comprehensive methods of calculating projections have been developed,14,15 but even these are based on current knowledge, much of which is likely to change over the next 15 years. With our focus on the impact of population increases and ageing, we have consciously chosen a methodology that is intuitive and transparent.
Cancer incidence projections in a recent major US study11 were also based on assumptions of stable age- and sex-specific cancer incidence rates. In separate unpublished analyses applying statistical methods described elsewhere,15 we found that about 85% of the change in overall cancer incidence since 1982 is due solely to population increase and ageing. This strong impact of population change is due to the incidence of most cancers being highest among older Australians, and there is no suggestion that the current pattern of an ageing and increasing population in Australia will change. Therefore our results are consistent with the expectation that cancer will affect the lives of a rapidly increasing number of Australians.
We have interpreted the published PAF estimates as being the proportion of disease risk that could be eliminated if the excess risk associated with exposure to poor diet and inadequate physical activity were to be eliminated. As has been discussed by others, this interpretation does make some assumptions; including that the elimination of the risk factor has no effect on the distribution of other relevant risk factors.16
The risk factors of poor diet and low physical activity are generally increasing in prevalence, which increases the need to intervene in diet and activity levels. Latest trend estimates suggest that more of the Australian population is sedentary than ever before, with percentages increasing from 31.5% in 200117 to 35.2% in 2007–08.18 Similarly, the prevalence of overweight and obesity in adults aged 18 years and over increased from 56.3% in 1995 to 61.4% in 2007–08 (excluding those for whom height and weight were not stated or not known).18 The level of harmful alcohol consumption has increased from 8.3% in 1995 to 12.6% in 2007–08, although the latest estimate does represent a slight decrease from a peak in 2004–05.18 There is also substantial scope for improvement in diet, with only 8.8% of Australians having the recommended amount of vegetable intake (five serves per day) and 6.1% having adequate fruit and vegetable consumption in the 2007–08 survey.18
Prevention is just one of several methods for reducing the burden of cancer in the community. Earlier detection and diagnosis of cancers, and improved treatments once a diagnosis is made are also important. Advances in treatment have been responsible for much of the improvement in survival outcomes and mortality rates for many cancers,19,20 but along with their increasing effectiveness, cancer treatments are still associated with a variety of side effects21,22 and are becoming more expensive. Based on the estimated lifetime treatment costs in 2000–01 (which included hospital admissions, out-of-hospital medical services and prescription pharmaceuticals)23 for the 12 specific cancers in this study, and ignoring inflation, prevention of these 37 776 cancers could save in excess of $674 million in 2025, a substantial annual figure, given the current pressures on health expenditure.
There is a growing body of evidence highlighting the inequities in cancer outcomes, which vary with remoteness or area disadvantage.24,25 There are similar inequities in the prevalence of poor diet, lower physical activity and higher obesity levels, by geographical location.26,27 Increasingly, the poor are becoming obese faster than the rich. In Australia in 2004–05, the self-reported obesity rate in disadvantaged areas (22%) was nearly double that in least disadvantaged areas (13%).28 The combined burden of obesity, poor diet and reduced physical activity is growing among the poor. In one survey, adults in rural and remote areas were more likely to have consumed fats and oils,29 and those living in the most disadvantaged areas had the lowest average intake of vegetable products and dishes.29 It has been suggested that cost is one of the main reasons that Australians with lower incomes are less likely to buy and eat healthy foods,30 and between 1999 and 2011 the cost of healthy food increased more than the consumer price index for all foods, and more than that for non-healthy food.31,32 A sharper focus on prevention and removing existing barriers, particularly in disadvantaged areas, has the potential to reduce these current inequities in cancer outcomes among population groups.
Interventions in diet, nutrition, physical activity and obesity at a population level are not simple, nor are they inexpensive. However, just over 2% of Australia’s total health expenditure in 2007–08 was spent on preventive services or health promotion.33 When compared with the costs of treatment, prevention efforts in the area of nutrition and physical activity can be a very cost-effective investment for governments.34 Another challenge is that the time lag between intervention and outcome is also likely to be substantial, but the example of declining cigarette smoking and lower lung cancer incidence among males demonstrates that interventions can be successful over the long term when government policies work in conjunction with other efforts.
1 Observed population and cancer incidence, 1982–2007, and projected population and cancer incidence for all cancers, 2008–2025
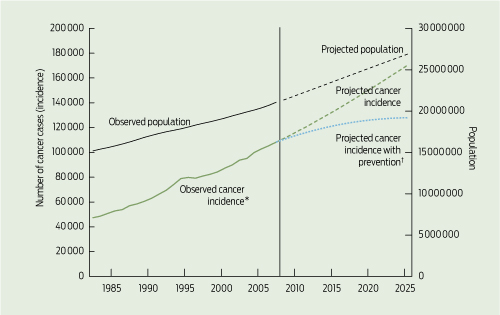
*All invasive cancers combined). † Up to 2025 after excluding preventable cancers.
2 Observed, projected and preventable cancer cases due to poor nutrition and diet, physical inactivity and obesity
Estimated preventable cancer cases, 2025 |
|||||||||||||||
ICD = International Classification of Diseases. * Low, medium and high projections are based on the three main series (A, B and C, respectively) of population projections published by the Australian Bureau of Statistics.12 † The values for preventability are mean values of United States values and United Kingdom values.3 ‡ See Methods for details of approximations used for these cancer types. § Total for these 12 cancers is based on the sum of the cancer-specific estimates of preventable cancers.
Received 22 August 2011, accepted 23 January 2012
- Peter D Baade1
- Xingqiong Meng1
- Craig Sinclair2
- Philippa Youl1
- 1 Viertel Centre for Research in Cancer Control, Cancer Council Queensland, Brisbane, QLD.
- 2 Cancer Prevention Centre, Cancer Council Victoria, Melbourne, VIC.
Peter Baade is supported by a National Health and Medical Research Council Career Development Fellowship.
No relevant disclosures.
- 1. Australian Institute of Health and Welfare. Cancer in Australia 2010: an overview. Canberra: AIHW, 2010. (AIHW Cat. No. CAN 56; Cancer Series No. 60.) http://www.aihw.gov.au/publication-detail/?id=6442472459 (accessed Feb 2012).
- 2. Australian Institute of Health and Welfare. Health expenditure Australia 2007–08. Canberra: AIHW, 2009. (AIHW Cat. No. HWE 46; Health and Welfare Expenditure Series No. 37.) http://www.aihw.gov.au/publication-detail/?id=6442468286 (accessed Feb 2012).
- 3. World Cancer Research Fund; American Institute for Cancer Research. Food, nutrition, physical activity and the prevention of cancer: a global perspective. Washington DC: WCRF and AICR, 2007. http://www.wcrf.org/cancer_research/expert_report/index.php (accessed Feb 2012).
- 4. Anand P, Kunnumakkara AB, Sundaram C, et al. Cancer is a preventable disease that requires major lifestyle changes. Pharm Res 2008; 25: 2097-2116.
- 5. Ali R, Barnes I, Kan SW, Beral V. Cancer incidence in British Indians and British whites in Leicester, 2001–2006. Br J Cancer 2010; 103: 143-148.
- 6. McCormack VA, Mangtani P, Bhakta D, et al. Heterogeneity of breast cancer risk within the South Asian female population in England: a population-based case–control study of first-generation migrants. Br J Cancer 2004; 90: 160-166.
- 7. World Cancer Research Fund; American Institute for Cancer Research. Policy and action for cancer prevention: food, nutrition, and physical activity: a global perspective. Washington DC: WCRF and AICR, 2009. http://www.dietandcancerreport.org/policy_report/index.php (accessed Feb 2012).
- 8. Møller H, Fairley L, Coupland V, et al. The future burden of cancer in England: incidence and numbers of new patients in 2020. Br J Cancer 2007; 96: 1484-1488.
- 9. Australian Institute of Health and Welfare. Australian Cancer Incidence and Mortality (ACIM) books. Canberra: AIHW, 2011. http://www.aihw.gov.au/acim-books (accessed Feb 2012).
- 10. Queensland Cancer Registry. Cancer in Queensland 1982–2007: incidence, mortality, survival and prevalence. Brisbane: Cancer Council Queensland, 2011. http://www.cancerqld.org.au/icms_docs/60012_Cancer_in_QLD_-_incidence_and_mortality.pdf (accessed Feb 2012).
- 11. Smith BD, Smith GL, Hurria A, et al. Future of cancer incidence in the United States: burdens upon an aging, changing nation. J Clin Oncol 2009; 27: 2758-2765.
- 12. Australian Bureau of Statistics. Population projections, Australia, 2006–2101. Canberra: ABS, 2008. (ABS Cat. No. 3222.0.) http://www.abs.gov.au/ausstats/abs@.nsf/mf/3222.0 (accessed Feb 2012).
- 13. World Cancer Research Fund; American Institute for Cancer Research. Policy and action for cancer prevention: food, nutrition, and physical activity: a global perspective. Washington DC: WCRF and AICR, 2009: 12-26. http://www.dietand cancerreport.org/policy_report/index.php (accessed Feb 2012).
- 14. Australian Institute of Health and Welfare; Australasian Association of Cancer Registries; National Cancer Strategies Group. Cancer incidence projections, Australia 2002 to 2011. Canberra: AIHW, AACR and NCSG, 2005. (AIHW Cat. No. CAN 25; Cancer Series No. 30.) http://www.aihw.gov.au/publication-detail/?id=6442467752 (accessed Feb 2012).
- 15. Canadian Cancer Society Steering Committee on Cancer Statistics. Canadian cancer statistics 2011. Toronto: CCS, 2011. http://www.cancer.ca/Canada-wide/Cancer%20research/Cancer%20statistics.aspx?sc_lang=en (accessed Feb 2012).
- 16. Levine B. What does the population attributable fraction mean? Prev Chronic Dis 2007; 4: A14.
- 17. Australian Bureau of Statistics. National health survey: summary of results, 2001. Canberra: ABS, 2001. (ABS Cat. No. 4364.0.) http://www.abs.gov.au/AUSSTATS/abs@.nsf/Lookup/4364.0Main+Features12001 (accessed Feb 2012).
- 18. Australian Bureau of Statistics. National health survey: summary of results, Australia 2007–2008. Canberra: ABS, 2009. (ABS Cat. No. 4364.0.) http://abs.gov.au/AUSSTATS/abs@.nsf/mf/4364.0 (accessed Feb 2012).
- 19. Australian Bureau of Statistics. Measures of Australia’s progress, 2010. Canberra: ABS, 2010. (ABS Cat. No. 1370.0.) http://www.abs.gov.au/ausstats/abs@.nsf/mf/1370.0 (accessed Feb 2012).
- 20. Baade PD, Youlden DR, Valery PC, et al. Population-based survival estimates for childhood cancer in Australia during the period 1997–2006. Br J Cancer 2010; 103: 1663-1670.
- 21. Body JJ, Bergmann P, Boonen S, et al. Management of cancer treatment-induced bone loss in early breast and prostate cancer — a consensus paper of the Belgian Bone Club. Osteoporos Int 2007; 18: 1439-1450.
- 22. Viale PH, Yamamoto DS. Cardiovascular toxicity associated with cancer treatment. Clin J Oncol Nurs 2008; 12: 627-638.
- 23. Australian Institute of Health and Welfare. Health system expenditures on cancer and other neoplasms in Australia, 2000–01. Canberra: AIHW, 2005. (AIHW Cat. No. HWE 29; Health and Welfare Expenditure Series No. 22.) http://www.aihw.gov.au/publication-detail/?id=6442467719 (accessed Feb 2012).
- 24. Baade PD, Youlden DR, Coory MD, et al. Urban–rural differences in prostate cancer outcomes in Australia: what has changed? Med J Aust 2011; 194: 293-296. <MJA full text>
- 25. Australian Institute of Health and Welfare. Rural, regional and remote health: a study on mortality (2nd edition). Canberra: AIHW, 2007. (AIHW Cat. No. PHE 95; Rural Health Series No. 8.) http://www.aihw.gov.au/publication-detail/?id=6442468054 (accessed Feb 2012).
- 26. Preventative Health Taskforce. Obesity in Australia: a need for urgent action. Canberra: Commonwealth of Australia, 2009. (ABS Cat. No. 4894.0.) http://www.preventative health.org.au/internet/preventativehealth/publishing.nsf/Content/tech-obesity (accessed Feb 2012).
- 27. Australian Institute of Health and Welfare. Rural, regional and remote health: indicators of health status and determinants of health. Canberra: AIHW, 2008. (AIHW Cat. No. PHE 97; Rural Health Series No. 9.) http://www.aihw.gov.au/publication-detail/?id=6442468076 (accessed Feb 2012).
- 28. Australian Bureau of Statistics. Overweight and obesity in adults, Australia, 2004–2005. Canberra: ABS, 2008. http://www.abs.gov.au/ausstats/abs@.nsf/mf/4719.0 (accessed Feb 2012).
- 29. Australian Bureau of Statistics. National nutrition survey: foods eaten, Australia, 1995. Canberra: ABS, 1999. (ABS Cat. No. 4804.0.) http://www.abs.gov.au/AUSSTATS/abs@.nsf/Lookup/4804.0Main+Features11995 (accessed Feb 2012).
- 30. Kettings C, Sinclair AJ, Voevodin M. A healthy diet consistent with Australian health recommendations is too expensive for welfare-dependent families. Aust N Z J Public Health 2009; 33: 566-572.
- 31. South Australian Council of Social Service. Cost of living update, No. 6. Adelaide: SACOSS, 2011. http://www.sacoss.org.au/online_docs/110517%20Cost%20of%20 Living%20Update%20No%206.pdf (accessed Feb 2012).
- 32. Australian Bureau of Statistics. Consumer price index, Australia, Mar 2011. Table 7. Canberra: ABS, 2011. (ABS Cat. No. 6 401.0.) http://www.abs.gov.au/AUSSTATS/abs@.nsf/DetailsPage/6401.0Mar%202011 (accessed Feb 2012).
- 33. Australian Institute of Health and Welfare. Australia’s health 2010. Canberra: AIHW, 2010. (AIHW Cat. No. AUS 122; Australia’s Health Series No.12.) http://www.aihw.gov.au/publication-detail/?id=6442468376 (accessed Feb 2012).
- 34. Vos T, Carter R, Barendregt J, et al. Assessing cost-effectiveness in prevention (ACE–prevention): final report. Brisbane: University of Queensland, 2010. http://www.sph.uq.edu.au/bodce-ace-prevention (accessed Feb 2012).
Abstract
Objective: To estimate the number of cancers to be diagnosed in 2025 that could be prevented solely due to changes in diet and physical activity.
Design and setting: We used an Australian population-based cancer database to estimate the total number of cancers to be diagnosed in 2025, by applying published age- and sex-specific population projections to current cancer incidence rates, and multiplying the projected numbers of cancers by estimates of population-attributable fractions.
Main outcome measures: Projected number of preventable cancers that would be diagnosed in 2025.
Results: Our projections suggest that there will be about 170 000 Australians diagnosed with cancer in 2025. This represents an increase of about 60% on the 2007 incidence. Almost 43 000 of these cancers (low estimate, 42 295; middle, 42 657; high, 43 990) could be prevented through improvements to diet and physical activity levels, including through their impact on obesity. It is likely that this is an underestimate of the true figure. The most preventable cancer types in 2025 were estimated to be bowel cancer and female breast cancer (10 049 and 7273 preventable cases, respectively).
Conclusions: About 25% of cancers, or about 43 000 cancers in 2025, can potentially be prevented through improvements in diet and physical activity. It is imperative that governments, clinicians and researchers act now if we are to reduce the significant future human and financial burden of cancer.