




Volume 196 - Issue 2
Impact of incident location on long-term pedestrian mortality and major trauma in inner Sydney
Authors: Matthew Oliver, Michael M Dinh, Susan Roncal, Soufiane Boufous, Bernardino Branco and Christopher M Byrne
Med J Aust 2012; 196 (2): 110-111. || doi: 10.5694/mja11.11147
Published online: 6 February 2012
Published online: 6 February 2012
To the Editor: Significant mortality and morbidity occur among pedestrians involved in road traffic incidents.1 The National Road Safety Strategy 2001–20102 aimed to achieve a 40% decrease in pedestrian fatalities in Australia through road safety measures, including urban speed limit reductions. To assess the impact of such measures, we examined the long-term mortality trend in pedestrians presenting to an inner Sydney major trauma centre and determined whether incident location was a predictor of major trauma (defined as in-hospital mortality, intensive care unit admission and/or Injury Severity Score > 15).
We identified 1944 trauma registry records of adult patients admitted to Royal Prince Alfred Hospital between 1992 and 2010 as the result of a pedestrian incident within the hospital’s catchment area, excluding transfers from other facilities (Box 1). Incident locations noted on clinical and ambulance records were classified as city or suburban according to current City of Sydney local government area boundaries. Population data were obtained from the Australian Bureau of Statistics.
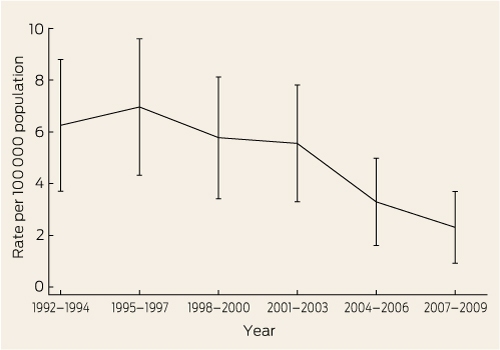
From 1992–1994 to 2007–2009 (population data for 2010 were unavailable at time of analysis), the age-adjusted mortality rate fell from 6.25 to 2.31 per 100 000 population (Box 2), a relative decrease of 63% (incidence rate ratio [IRR], 0.94; 95% CI, 0.91–0.98; P = 0.003). Negative binomial regression analysis showed that the reduction in mortality was statistically significant for incidents in the city (IRR, 0.91; 95% CI, 0.86–0.96; P = 0.01) but not suburban areas (IRR, 0.96; 95% CI, 0.92–1.00; P = 0.09). Multivariable logistic regression showed the odds of major trauma were 70% higher for suburban incidents than city incidents after adjusting for age, sex and time of presentation (after hours and weekends) (adjusted odds ratio, 1.7; 95% CI, 1.1–2.6; P = 0.02).
The decrease in pedestrian mortality appeared most prominent after 2003, around the time the urban speed limit was reduced from 60 km/h to 50 km/h, and to 30–40 km/h in areas with high pedestrian activity.3 The 10 km/h speed limit reduction alone is estimated to have resulted in a 6% decrease in pedestrian fatalities.4 However, the trend appears to be limited to city incidents, with an annual reduction of 10% in the city versus 3% in suburban areas (Box 1).
The observed improvement in outcomes, particularly in the City of Sydney, is likely a result of speed-limit reductions, drink-driving laws and improvements in clinical care. However, more needs to be done to protect pedestrians in suburban areas.
1 Baseline characteristics and outcomes of pedestrian incidents
Competing interests
No relevant disclosures.
References
- Peng RY, Bongard FS. Pedestrian versus motor vehicle accidents: an analysis of 5,000 patients. J Am Coll Surg 1999; 189: 343-348. 0_CHDECAGB
- The National Road Safety Strategy 2001–2010. Canberra: Australian Transport Council, 2000. http://www.atcouncil.gov.au/documents/files/strategy.pdf (accessed Jan 2012).
- NSW Centre for Road Safety. NSW speed zoning guidelines. Version 3.0. Sydney: Roads and Traffic Authority NSW, 2009. http://ols2.rta.nsw.gov.au/ebus/docs/rescat/pdf/10/1179/45094834spd zoneguide0409.pdf (accessed Jan 2012).
- Kloeden CN, McLean AJ, Moore VM, Ponte G. Travelling speed and the risk of crash involvement. Adelaide: Centre for Automotive Safety Research, University of Adelaide,1997. http://casr.adelaide.edu.au/speed/ (accessed Jan 2012).
Designing Housing to Reduce Overcrowding-Related Harms: Rheumatic Heart Disease as the Canary in the Coal Mine
Simon Quilty, Veronica Matthews, Angus Baumann, James Marangou, Bo Remenyi, Gavin Wheaton, Serena Morton Nabanunga, Norman Frank Jupurrurla, Simon Robinson, Steve Mintern, Cary Duffield, Joshua R. Francis, Paul C. Memmott
Australian Climate Leadership in 2026: COP-Out or Step-Up for Health?
Catherine G. A. Pendrey, Angie Bone, Aletha Ward, Francis Nona, Michelle Isles, Paul M. Kelly, Nicholas J. Talley
The impact of the Breast Screen NSW transition from film to digital mammography, 2002–2016: a linked population health data analysis
Rachel Farber, Nehmat Houssami, Katy J L Bell
Shifting focus to adolescent wellbeing and inclusive participation in the digital age
Allyson R Todd, Elena Wang, Stephanie R Partridge
The CURE Asthma roadmap
Gary P Anderson, Anthony Flynn, Phil G Bardin, John D Blakey, Shyamali C Dharmage, Paul Foster, Peter G Gibson, Adam Jaffe, Alan James, Christine R Jenkins, Sundram Sivamalai, Peter D Sly, Guy B Marks, Vanessa M McDonald, Judy Wetttenhall
Protecting public interest journalism as a public health good
Bronwyn Fredericks, Neha Lalchandani, Melissa A Sweet, Alex Cramb, Carmel Williams