


The demand for hospital beds often exceeds supply, especially in winter. This may result in overcrowded emergency departments, cancellation of elective surgery, and other disruptions to patient care. These crises now seem to be occurring throughout the year, and often without any obvious increase in the number of patients presenting to the emergency department. However, it is possible that the usual methods of analysis may not be sensitive enough to reveal important trends in admissions, discharges and occupancy. This prompted us to consider alternative methods of analysis, and in particular, the cusum technique.
In essence, the cumulative sum technique tracks the cumulative sum of consecutive differences, whether positive or negative, between an individual measurement and a given standard or target.1 This allows the early detection of small incremental changes. This type of analysis has been shown to be of value in monitoring trends in hospital-acquired infection,2 and in assessing progress in the acquisition of procedural and surgical skills.3,4 It has also been used to demonstrate poor clinical outcomes, and even criminal behaviour, decades before they were otherwise apparent.5,6
The main purpose of this study, therefore, was to investigate the potential of cusum analysis in monitoring trends in hospital admissions, discharges and related variables.
The Royal Brisbane and Women’s Hospital provides tertiary services along with secondary hospital services for a local population of about 500 000. Internal Medicine Services (IMS) admits all acutely ill medical patients and, at the start of the study, had about 212 of the 700 hospital beds. The Emergency Department (ED) manages over 70 000 presentations each year, and has responsibility for a 16-bed short-stay ward.
Medical ward data were collected and entered into a spreadsheet each day by the IMS bed coordinator. The data included patient identification, daily admissions, discharges, occupancy, and the number of medical patients occupying beds in non-medical wards. Retrospective data on elective surgical admissions, final length of stay and occupied bed days (OBDs [number of admissions multiplied by length of stay]) for all patients discharged on a given day were obtained from the hospital clinical costing system. Elective, day-only admissions were excluded from analysis. ED data (presentations, admission rates and delays in admission, with a delay of more than 8 hours being considered access block) were extracted from the hospital patient information system. Data were collected over 24 months, commencing on 1 March 2002, and were analysed and compared over four consecutive 6-month periods.
At the commencement of this study, the average lengths of stay of medical patients in some diagnostic categories were significantly longer than those at equivalent peer-group hospitals. Various interventions designed to improve bed use were therefore implemented, including a rigorous search for alternatives to admission by both ED and IMS medical staff, integrated daily multi-disciplinary case review within IMS, and specific review of patients who had a prolonged length of stay.
At the start of the study it had been assumed that the level of available beds would remain essentially constant, but as detailed below, this did not prove to be the case.
Cusum and all other statistical analyses were performed with Minitab software (Minitab Inc, State College, Pa, USA). Cusum analysis requires that targets be specified, from which upper and lower control limits are derived1 to determine whether any changes are significant. For this study, these targets were derived from average baseline values for each parameter at the start of the study, with an adjustment in the case of average length of stay, medical patients occupying beds in non-medical wards, and elective surgical admissions, based on a desired level of change for each activity. As several of the datasets were not normally distributed, Mann–Whitney two-sample rank tests were used for comparisons between the first 6 months in 2002 and the same period in 2003.
The results for the variables of interest are summarised in Box 1 with statistical comparisons of the same two periods for each year.Box 2 and Box 3 show paired analyses to demonstrate the capacity of cusum analysis to reveal trends that were not immediately obvious in the time-series data. The graphs in Box 2 and Box 3 have been selected to show the impact of interventions by ED and IMS staff, but cusum analysis of all other datasets also showed trends that were not clearly seen in the standard time series.
As shown in Box 1, over the duration of the study there was a significant increase in the number of patients presenting to the ED. Initially, the medical staff responded by significantly reducing the percentage of patients admitted, thus keeping the total admission numbers constant at around 54 per day, while significantly reducing the number of medical admissions from an average of 19.8 to 16.6 per day. The cusum analysis (not shown) revealed an early drop in ED presentations followed by a progressive increase with the upper control limit being transgressed around the end of the first year. The initial drop in the percentage admitted probably reflected an early decline in presentation rate, but the cusum graph (Box 2) shows that this was maintained even after the presentation rate subsequently increased, demonstrating a substantial and sustained change in medical practice in response to the increased load.
The average length of stay was also reduced significantly when the March to August data for the 2 years were compared. The cusum analysis in Box 3 clearly shows the initial failure to achieve the desired target reduction in length of stay for the first 35 weeks, but with a complete reversal in direction with consequent improvement over the next 20 weeks. These changes were not apparent in the standard time series in Box 3.
OBDs were reduced by 9500 in the second year of the study compared with the first. This decline was seen on the cusum chart (not shown) to have commenced at around week 40, and to have been sustained thereafter.
As shown in Box 1, the end result of the imbalance between the demand for and supply of medical beds was a significant increase in the level of access block and recurrent interruptions in the elective surgical admissions. The development of these problems was progressive, except for some minor periods of improvement in both these variables in the first year.
Our primary objective in this study was to determine whether cusum analysis could reveal important trends in patient flow data that were not apparent in the conventional time-series displays. We believe that we have shown this to be the case, and that cusum analysis has several additional advantages.
Firstly, it is simple. Although we used a commercial statistical software package, it is possible to use spreadsheet programs to calculate and display trends, albeit at the loss of the automated control limit plotting facility.
Secondly, it allows the detection of trends at an early stage when minor corrective adjustments are often still possible. This may remove the need for major and disruptive interventions at a later date.
Thirdly, it provides a clear demonstration of the progressive impact of apparently minor individual changes. This can be used both to demonstrate to staff the importance of vigilance for negative changes, however small, and conversely, the power of small positive changes to achieve particular goals. In the present study, this was exploited through a campaign to find only one extra patient each day who could be discharged a day earlier than otherwise planned. This was a useful contribution to the overall program designed to reduce length of stay, as it presented all staff with a small manageable task rather than an overwhelming problem of occupancy overload.
Fourthly, the requirement to set a target provides a useful means of focusing attention on the requisite size of any type of measurable service improvement.
Fifthly, cusum analysis provides immediate, statistically valid, graphically comprehensible, locally useable, and thus persuasive, information. It also avoids the complexity and delays of the more familiar controlled and randomised comparisons, and the frequently associated disputes about comparability of the populations under investigation. It is also worth noting that all the necessary key variables are already available in most hospital information systems.
The fact that access block and other markers of occupancy overload persisted or recurred despite major improvements in bed use was disappointing, but not altogether surprising. Predictive models show that hospital occupancy of more than 90% will precipitate regular crises that are slow to resolve.7 This study confirmed the validity of this model, at least at occupancy levels that were invariably in excess of 90%, and usually greater than 100%. It also reinforced the need to closely integrate the control of the three critical decisions of bed management — to admit, to discharge and to open or close beds. If, as in our institution, authority over each of these decisions is vested in different semi-autonomous departments, fine control is likely to be elusive. This situation is not unlike a car park in which the inflow and outflow of cars and the number of available parking bays are managed separately. The problem, of course, is the perception, sometimes justified, that any available bed in a public hospital will soon be filled, and that the only way to drive efficiency changes and maintain budget integrity is to close beds. This is reasonable as long as there is capacity for improved bed use, but not beyond that point.
Congestion may also induce secondary inefficiency, as a prolonged stay in the ED has been shown to lengthen the subsequent inpatient length of stay.8,9 This may be caused, in part, by the increased time that it takes for staff to manage medical patients when they are widely dispersed in unfamiliar non-medical wards and/or by the deterioration in the level of care that is possible when, for instance, the frail elderly have to be kept for long periods on trolleys in EDs.
There is no single, simple, answer to the problem of meeting high demand for scarce beds in a complex and ever-changing environment. The first requirement is obviously to ensure that bed use is fully optimised, but a small amount of spare capacity is essential if recurrent crises and secondary inefficiency are to be avoided. Cusum analysis cannot solve this problem, but it can give valuable early warning of overload. It can also assist in predicting the size of the buffer that is needed to manage fluctuations in demand, and in highlighting the need for integrated management of admissions, discharges and the number of beds available. Without this level of fine control and an adequate buffer, inpatients are at risk of being managed unsafely and inappropriately on trolleys in the crowded corridors of the emergency departments, or in wards distant from the requisite skills and resources.
1 Results for variables pertaining to bed occupancy and access block
|
Period |
|
|||||||||||||
Variable |
1 (Mar 02 to Aug 02) |
2 (Sept 02 to Feb 03) |
3 (Mar 03 to Aug 03) |
4 (Sept 03 to Feb 04) |
P * (for periods 1–3) |
||||||||||
No. of samples |
184 |
181 |
182 |
184 |
|
||||||||||
Emergency Department |
|
|
|
|
|
||||||||||
Presentations |
179.4 ± 18.3 |
186.0 ± 20.3 |
196.0 ± 19.6 |
197.1 ± 19.6 |
0.001 |
||||||||||
Admissions |
54.7 ± 8.9 |
54.8 ± 8.5 |
53.2 ± 7.7 |
54.4 ± 9.1 |
0.124 |
||||||||||
% admitted |
30.6 ± 4.7 |
29.5 ± 3.8 |
27.3 ± 3.9 |
27.6 ± 3.7 |
0.021 |
||||||||||
% with more than 8-hour delay† |
4.3 ± 2.8 |
3.5 ± 2.8 |
6.4 ± 3.2 |
8.2 ± 4.2 |
0.002 |
||||||||||
Internal Medicine Services |
|
|
|
|
|
||||||||||
Admissions |
19.8 ± 6.2 |
16.3 ± 4.8 |
16.6 ± 5.0 |
16.7 ± 6.0 |
0.000 |
||||||||||
Average length of stay (days) |
10.0 ± 3.4 |
8.9 ± 3.5 |
8.5 ± 2.5 |
8.3 ± 2.4 |
0.000 |
||||||||||
Occupied bed days |
233.6 ± 113.6 |
194.2 ± 103.7 |
182.3 ± 82.3 |
171.7 ± 81.3 |
0.007 |
||||||||||
Available beds |
212 |
195 ± 7.6 |
186 ± 8.9 |
166.2 ± 5.3 |
— |
||||||||||
% beds occupied |
106.44 ± 8.1 |
102.5 ± 9.1 |
99.9 ± 8.1 |
104.3 ± 6.4 |
0.000 |
||||||||||
Patients in non-medical wards |
8.4 ± 7.5 |
5.5 ± 4.0 |
7.7 ± 4.4 |
6.6 ± 4.9 |
0.471 |
||||||||||
Elective surgical admissions |
15.7 ± 9.8 |
16.3 ± 10.9 |
16.0 ± 10.1 |
13.7 ± 9.3 |
0.600 |
||||||||||
Results are given as values ± SD. * Mann–Whitney two-sample rank test. †More than 8-hour delay considered access block. |
|||||||||||||||
2 Percentage of patients presenting to the Emergency Department who were admitted
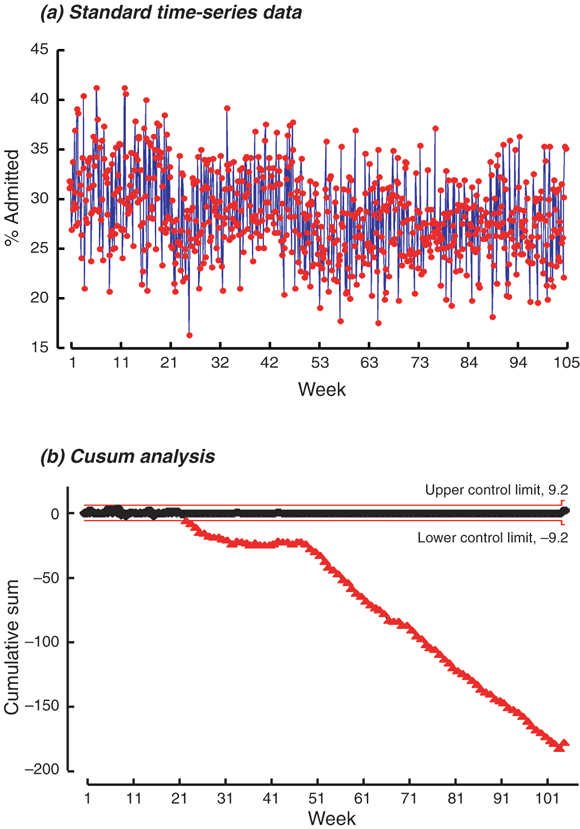
The initial fall in the percentage admitted probably reflected the early decline in presentation rate, but the trend was maintained after the presentation rate increased, showing change in medical practice in response to the increased load.
Cusum analysis subgroup size, 7; target, 31%. A change in symbol shape and colour indicates that control limits have been transgressed.
3 Average length of stay for patients discharged from Internal Medical Services
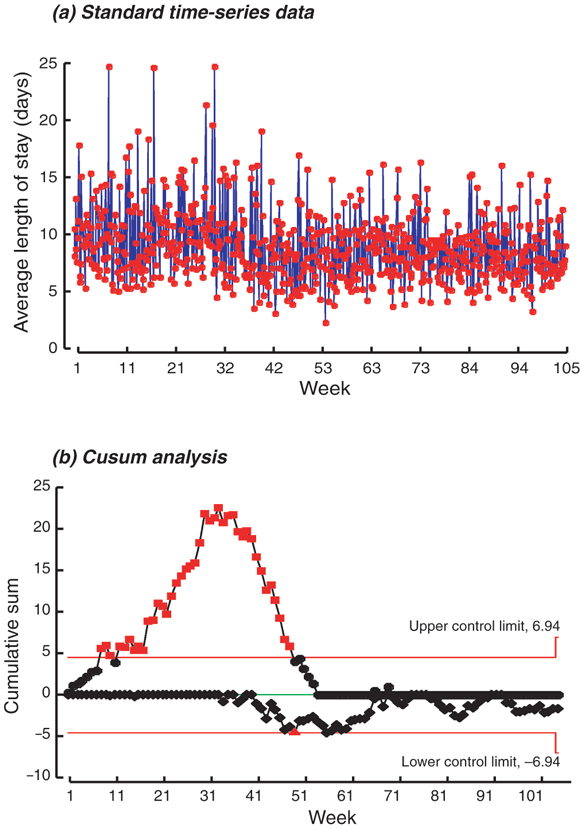
There is an initial failure to achieve the desired target reduction in length of stay for the first 35 weeks, but thereafter there is a complete reversal in trend with significant improvement over the next 20 weeks.
Cusum analysis subgroup size, 7; target, 8.9 days. A change in symbol shape and colour indicates that control limits have been transgressed.
Received 3 September 2004, accepted 25 July 2005
- Claire M Burns1
- Cameron J Bennett2
- Colin T Myers3
- Michael Ward4
- 1 Queensland Clinical Practice Improvement Centre, Queensland Health, Brisbane, QLD.
- 2 Royal Brisbane and Women’s Hospital, Brisbane, QLD.
- 3 School of Medicine, University of Queensland, Brisbane, QLD.
We thank the many staff who assisted in the collection of data, especially Kathleen Richter and Ian Bishop.
None identified.
- 1. Hawkins DM, Olwell DH. Cumulative sum charts and charting for quality improvement. New York: Springer-Verlag, 1998.
- 2. Morton AP, Whitby M, McLaws ML, et al. The application of statistical monitoring process control charts to the detection and monitoring of hospital acquired infections. J Qual Clin Pract 2001; 21: 112-117.
- 3. Bolsin S, Colson B. The use of the cusum technique in the assessment of trainee competence in new procedures. Int J Qual Health Care 2000; 12; 433-438.
- 4. Lim TO, Soraya A, Ding LM, Morad Z. Assessing doctors’ competence: application of cusum technique in monitoring doctors’ performance. Int J Qual Health Care 2002; 14: 251-258.
- 5. Spigelhalter D, Grigg O, Kinsman R, Treasure T. Risk adjusted probability ratio tests: application to Bristol, Shipman and adult cardiac surgery. Int J Qual Health Care 2003; 15; 7-13.
- 6. Mohammmed M, Cheng KK, Marshall T. Bristol, Shipman, and clinical governance: Shewart’s forgotten lesson. Lancet 2001; 357: 463-467.
- 7. Bagust A, Place M, Posnett JW. Dynamics of bed use in accommodating emergency admissions: stochastic simulation model. BMJ 1999; 319: 155-158.
- 8. Richardson D. The access-block effect: relationship between delay reaching an inpatient bed and inpatient length of stay. Med J Aust 2002; 177: 492-495. <MJA full text>
- 9. Liew D, Liew D, Kennedy MP. Emergency department length of stay independently predicts excess inpatient length of stay. Med J Aust 2003; 179: 524-526. http://www.mja.com.au/public/issues/179_10_171103/lie10159_fm.html
Abstract
Objective: To assess the value of cusum analysis in hospital bed management.Design: Comparative analysis of medical patient flows, bed occupancy, and emergency department admission rates and access block over 2 years.
Setting: Internal Medicine Services and Emergency Department in a teaching hospital.
Interventions: Improvements in bed use and changes in the level of available beds.
Main outcome measures: Average length of stay; percentage occupancy of available beds; number of patients waiting more than 8 hours for admission (access block); number of medical patients occupying beds in non-medical wards; and number of elective surgical admissions.
Results: Cusum analysis provided a simple means of revealing important trends in patient flows that were not obvious in conventional time-series data. This prompted improvements in bed use that resulted in a decrease of 9500 occupied bed-days over a year. Unfortunately and unexpectedly, after some initial improvement, the levels of access block, medical ward congestion and elective surgical admissions all then deteriorated significantly. This was probably caused by excessive bed closures in response to the initial improvement in bed use.
Conclusion: Cusum analysis is a useful technique for the early detection of significant changes in patient flows and bed use, and in determining the appropriate number of beds required for a given rate of patient flow.