


Estimating risks of inheriting a genetic disease is an important skill for healthcare professionals, usually clinical geneticists and genetic counsellors. In the absence of genetic testing, risk estimation is a fairly simple process. However, when genetic testing has shown that certain relatives are non-carriers, estimating an individual’s risk is more complex, requiring conditional probabilities and use of Bayes’ theorem (see references 1 and 2 for simple explanations of Bayes’ theorem).
We noticed that healthcare professionals in clinical genetics, when counselling individuals or couples for predictive testing for Huntington’s disease, sometimes ignore the importance of favourable test outcomes in first-degree relatives of the person being counselled.3 To investigate this potential problem, we conducted an anonymous survey among healthcare professionals involved in genetic counselling prior to, and thus unbiased by, our earlier report.3
Huntington’s disease (HD) is a hereditary, neuropsychiatric disorder showing autosomal dominance, late onset, a wide range in age at onset, and complete penetrance. The estimated prevalence in the general population varies between less than 1 and more than 15 per 100 000.4 Predictive testing for HD was introduced in 1987, and when the genetic mutation was identified in 1993 testing became technically more simple, reliable, and available for every person at risk.5
We aimed to determine the extent to which the principles of probability theory and, if necessary, Bayes’ theorem1,2 were followed when respondents estimated the risk status of a particular individual in a family tree.
We designed 10 pedigrees of families with Huntington’s disease in which one or two individuals had recently been informed of their mutation test outcomes. All pedigrees contained at least one carrier of the HD gene. (The survey with all 10 pedigrees is available upon request.)
Original surveys were sent to contact people in 12 centres (United Kingdom, 6; The Netherlands, 4; Italy, 1; Australia, 1). These people were asked to copy and distribute the survey to staff in their centres. The survey was conducted in May–June 2002.
Respondents were asked to estimate, for each pedigree, the probability that a particular, clearly indicated individual “is a gene-carrier for Huntington’s disease”, indicating their answers on a visual analogue scale with markers at 0, 10%, 20%, ... 100%. Respondents were also asked to indicate how sure they were of each estimate (varying from 1 = “very unsure” to 5 = “completely sure”).
Our pedigrees included predictive test results of individuals at 25% a priori risk or prenatal test results on fetuses at 25% a priori risk. Although these scenarios are less frequent than predictive testing for individuals at 50% risk,6 these are the situations where favourable results may affect other relatives’ risks.
Other parameters, such as age, are important for establishing the actual risk status of individuals at risk for HD.7,8 For the sake of simplicity and feasibility of the survey, we asked our respondents to disregard these factors. This simplification allowed any neglect of conditional probabilities to be seen more clearly than if age-dependent penetrance had also been included. Furthermore, given the age at onset of HD, diminution of risk in an asymptomatic at-risk individual is not a major factor until middle life.
Six simple pedigrees and one, more complicated pedigree (not presented here) mainly served as distractions. These pedigrees depicted individuals for whom risk estimation was quite straightforward without making use of conditional probabilities or Bayes’ theorem. The remaining three pedigrees (Box 1) were our investigation targets (at positions #4, #7, and #9 in the sequence of 10 pedigrees), in which risks were to be estimated using conditional probabilities because of favourable genetic test results already obtained in close relatives. Box 2 gives an example of the correct calculation. For further information and easy calculation of conditional probabilities, see <members. aol.com/johnp71/bayes.html>.
Because the survey used a visual analogue scale, we considered risk estimates for the target pedigrees as reasonably correct if they were within a range around the correct risk: #4, 28%–38%; #7, 14%–19%; #9, 3%–7%.
For this anonymous survey, we neither sought nor obtained ethical approval.
Seventy-one clinical geneticists (registered or in training) and 41 other healthcare professionals (mainly genetic counsellors) participated voluntarily in our survey. They worked in 12 clinical genetics centres: six in The Netherlands, four in the United Kingdom, one in Italy, and one in Australia. The respondents had a median of 6.5 years’ experience in genetic counselling and 2 years’ experience with HD.
Risk estimates for the simple distraction pedigrees were 95%–99% correct. However, risks in the target pedigrees were estimated incorrectly as being about equal to the prior risks by more than half of the respondents (Box 3). Twenty respondents gave reasonably correct estimates for all three targets.
The respondents’ discipline (clinical geneticist or other) was not significantly related to the accuracy of their target estimates.
Most of our respondents appeared to be unaware of how favourable test outcomes in first-degree relatives may alter risks. They did not appreciate the need to apply Bayes’ theorem in calculating conditional probabilities, as has been described for X-linked recessive disorders such as Duchenne muscular dystrophy. 1,2 We concluded this from the high proportion of respondents indicating confidence in their erroneous risk calculations.
The changes in probabilities described here are not only important for individuals who are considering prenatal or presymptomatic DNA testing for autosomal dominant, hereditary, late-onset diseases such as Huntington’s disease; they also apply to hereditary forms of cancer such as breast cancer (BRCA1/2) and colorectal cancer (FAP or HNPCC).
Our findings raise several important questions about the adequacy of continuing educational and training programs for clinical geneticists and genetic counsellors, and the mathematical expertise available in clinical genetics centres. Perhaps clinical geneticists and genetic counsellors are easily misled by the less complicated risk calculations, and less ambiguous implications, after unfavourable test results compared with favourable test results. Consider, for instance, the plight of a parent at 50% risk who has two children or fetuses tested consecutively, with the first one being negative but the next one positive. Such a parent’s risk status would have changed from a prior risk of 50% to 33.3% after the favourable first test result, but subsequently to 100% (as an obligate carrier) after the adverse second test result.
Provision of full and adequate information is one of the essential conditions to be fulfilled in genetic counselling. If, in appropriate circumstances, such as in our target scenarios, the risk is overestimated, then the individual at risk may remain unnecessarily anxious. Learning that the risk of carrying the HD gene has diminished to a large extent may reduce the anxiety about this distressing disorder.
The perceived risk may also influence a couple’s decisions. For example, in pedigree #9, the risk for the father of the unborn child has decreased from a prior risk of 25% to 10% — a change in risk of this magnitude is quite likely to affect the decision about whether to have children. Furthermore, with the risk of miscarriage after a prenatal test at 1%–2%, parents at risk may consider not having a prenatal test in later pregnancies, knowing that favourable test results in previous pregnancies have considerably reduced their own risk.
It is important to remember that, although these parents have been informed correctly of their diminished risk based on their children’s favourable test results, their carrier status is still unknown. Especially in cases of autosomal-dominant, hereditary disorders with late onset, such as Huntington’s disease, revealing a parent’s obligate carrier status can be very distressing. Thus, people may choose prenatal testing to avoid passing the disease to their children while avoiding testing themselves, as they may not wish to learn their own status. Of course, they must realise and accept that an unfavourable result in a child will reveal their own status as a carrier.
There is a further potential problem if healthcare professionals in clinical genetics continue to use prior risks inappropriately: the “bystander effect”. This refers to the situation when, as more professionals fail to take appropriate action (ie, they do not take the favourable test results of close relatives into account), others will be inclined to ignore such results. Bystanders (colleagues) can thus become the victims of “pluralistic ignorance”.9
Our survey shows that there is a continuing need for improvement in genetic risk assessment. Our findings underline that healthcare professionals in clinical genetics are often using prior risks in situations where Bayes’ theorem should be applied. We recommend that greater attention be paid to genetic risk calculations in continuing education and training programs for clinical geneticists and genetic counsellors.
1 Pedigrees requiring Bayes’ theorem for calculating risks
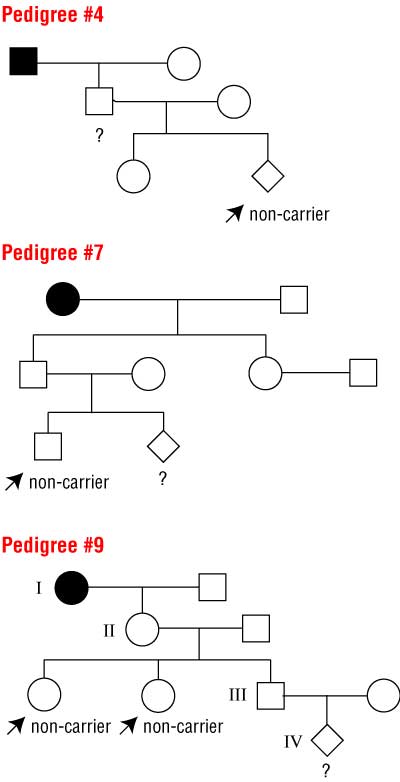
Squares are males, circles are females. Solid symbols indicate people with the disease. Respondents were asked to calculate the probabilities that individuals marked with ? are carriers, disregarding age at time of testing and age-related penetrance.
Prior probabilities (in absence of test results) are #4, 50%; #7, 25%; #9, 12.5%. The correct probabilities (taking into account the known non-carrier status of the marked individuals) are #4, 33%; #7, 16.7%; #9, 5%.
See Box 2 for example calculation for pedigree #9.
2 Example calculation for pedigree #9 (Box 1)
Task
Calculate probability individual IV is a carrier, denoted as P(IV carrier).
Prior probability (no test results known)
There is a 50% chance of the gene being passed to a child.
Thus, P(IV carrier) = 0.5 × P(III carrier)
= 0.5 × 0.5 × P(II carrier)
= 0.5 × 0.5 × 0.5
= 0.125 (12.5%)
Posterior probability (when two children of individual II are known to be non-carriers, and no other children have been tested)
P(IV carrier) = 0.5 × 0.5 × P(II carrier)
The results of testing II’s children change P(II carrier).
Status of II |
Non-carrier |
Carrier |
Prior probability (A) |
0.5 |
0.5 |
Probability of two non-carrier children (B) |
1.0 |
0.25 (0.5 for each child; independent events so multiply: 0.5 × 0.5) |
Joint probability (A × B) |
0.5 |
0.125 |
Posterior probability |
0.5 / (0.5 + 0.125) = 0.8 |
0.125 / (0.5 + 0.125) = 0.2 |
P(II carrier) = 0.2
Therefore, P(IV carrier) = 0.5 × 0.5 × 0.2 = 0.05 (5%)
3 Summary of respondents’ accuracy in estimating risk for our target pedigrees (Box 1)
Pedigree #4 |
Pedigree #7 |
Pedigree #9 |
|||||||||||||
Respondents estimating reasonably correctly* |
24% (26/107) |
25% (28/112) |
26% (28/108) |
||||||||||||
Respondents estimating incorrectly, as if prior risk |
61% (65/107) |
64% (72/112) |
50% (54/108) |
||||||||||||
Respondents who used prior probability and were “sure” or “completely sure” of their estimate† |
91% (59/65) |
85% (58/68) |
77% (39/51) |
||||||||||||
* Within range specified in Methods. †Some respondents failed to answer the question about being sure. |
|||||||||||||||
Received 24 May 2004, accepted 30 November 2004
- Benno Bonke1
- Theo Stijnen2
- Aad Tibben3
- Dick Lindhout4
- Angus J Clarke5
- 1 Erasmus MC, Rotterdam, The Netherlands.
- 2 Leiden University Medical Centre, Leiden, The Netherlands.
- 3 University Medical Centre Utrecht, Utrecht, The Netherlands.
- 4 University of Wales College of Medicine, Cardiff, UK.
We thank Cecile Janssens and Reinier Timman for help and support, and the anonymous reviewers, who provided valuable suggestions. We also gratefully acknowledge all those who kindly cooperated by enlisting colleagues in the project and/or by participating in the survey. We thank Jackie Senior for critical reading of the manuscript.
None identified.
- 1. Bridge PJ. The calculation of genetic risks. Baltimore: Johns Hopkins University Press; 1994.
- 2. Gelehrter TD, Collins FS, Ginsburg D. Principles of medical genetics. 2nd ed. Baltimore: Williams & Wilkins; 1998.
- 3. Bonke B, Tibben A, Lindhout D, Stijnen T. Favourable mutation test outcomes for individuals at risk for Huntington disease change the perspectives of first-degree relatives. Hum Genet 2002; 111: 297-298.
- 4. Harper PS. The epidemiology of Huntington’s disease. In: Bates G, Harper P, Jones L, editors. Huntington’s disease. 3rd ed. Oxford: Oxford University Press; 2002: 159-197.
- 5. Maat-Kievit A, Vegter-van der Vlis M, Zoeteweij M, et al. Paradox of a better test for Huntington’s disease. J Neurol Neurosurg Psychiatry 2000; 69: 579-583.
- 6. Benjamin CM, Lashwood A. United Kingdom experience with presymptomatic testing of individuals at 25% risk for Huntington’s disease. Clin Genet 2000; 58: 41-49.
- 7. Brinkman RR, Mezei MM, Theilman J, et al. The likelihood of being affected with Huntington disease by a particular age, for a specific CAG size. Am J Hum Genet 1997; 60: 1202-1210.
- 8. Maat-Kievit A, Losekoot M, Zwinderman K, et al. Predictability of age at onset in Huntington disease in the Dutch population. Medicine 2002; 81: 251-259.
- 9. Brehm SS, Kassin SM. Social psychology. Geneva, Illinois: Houghton Mifflin; 1996.
Abstract
Objectives: To assess whether healthcare professionals correctly incorporate the relevance of a favourable test outcome in a close relative when determining the level of risk for individuals at risk for Huntington’s disease.
Design and setting: Survey of clinical geneticists and genetic counsellors from 12 centres of clinical genetics (United Kingdom, 6; The Netherlands, 4; Italy, 1; Australia, 1) in May–June 2002. Participants were asked to assess risk of specific individuals in 10 pedigrees, three of which required use of Bayes’ theorem.
Participants: 71 clinical geneticists and 41 other healthcare professionals involved in genetic counselling.
Main outcome measures: Proportion of respondents correctly assessing risk in the three target pedigrees; proportion of respondents who were confident of their estimate.
Results: 50%–64% of respondents (for the three targets separately) did not include the favourable test information and incorrectly estimated the risks as being about equal to the prior risks; 77%–91% of these respondents were “sure” or “completely sure” that their estimations were correct. Twenty of the 112 respondents correctly estimated the risks for all three target pedigrees.
Conclusions: Clinical geneticists and genetic counsellors frequently use prior risks in situations where Bayes’ theorem should be applied, leading to overestimations of the risk for an individual.