




Volume 178 - Issue 7
Flow of participants in randomised studies
Authors: Burcu Cakir, Val J Gebski and Anthony C Keech
Med J Aust 2003; 178 (7): 348-349. || doi: 10.5694/j.1326-5377.2003.tb05232.x
Published online: 7 April 2003
Published online: 7 April 2003
In judging the results of randomised trials it is important to know from where and how participants were recruited, to what extent they received the intended interventions, whether they were followed up as planned, and whether their data were analysed as stated. These details are to ensure that readers of trial reports can appreciate both how closely participants reflect those more generally suffering from the condition under investigation, and how reliably the trial's results test its hypothesis.
Participant flow diagram
Enrolment
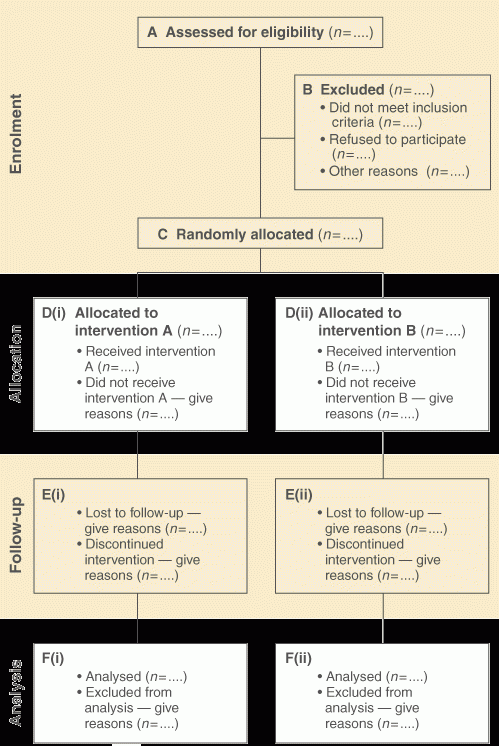
Item 13 of the CONSORT statement recommends a flow diagram to aid in the reporting of participant flow (see Box 1).1 Box 2 provides a checklist for tracking subject participation throughout the trial. In this scheme Part A refers to the number of participants with the condition of interest screened for eligibility criteria as specified in the trial protocol. For a recent example see the Second Australian National Blood Pressure trial.2 This study clearly details the process resulting in the final 6083 participants recruited. With 54 288 people screened to participate, 31 255 had the condition of interest (hypertension). Of these, 8273 were found to be ineligible and 16 899 refused to participate. The remaining 6083 were randomly allocated, corresponding to Part C of the flowchart in Box 2. The ratio of participants randomly allocated to those initially assessed helps determine how generalisable the results of the trial will be, and consequently may also affect the extent to which the results of the trial might influence health policy. Part B of Box 2 indicates assessed participants who do not subsequently participate, with reasons for non-participation given. Enough information should be given to identify separately the numbers who were deemed ineligible, refused to participate and those not randomly allocated to an intervention for other reasons.
The ratio of the number of participants to the number of people initially assessed for eligibility may also provide an insight into the acceptability and practicability of the intervention. For example, if 2000 people were assessed and only 300 recruited, such a low ratio might be the result of highly restrictive eligibility criteria, participant requirements that are too complicated or impractical, or an intervention too intrusive for participants to readily accept over standard care.
Allocation
Of the total number of participants randomly allocated, the number assigned to each of the study arms should be separately presented (Box 2, Part D). A breakdown of the number of participants who actually received the allocated treatment and those who did not (with reasons given) should be included. This information, together with details of participant follow-up (see below), helps determine how well the intentions of the protocol were met.
Follow-up details
During the trial, participants' status in terms of outcomes (both efficacy and safety) is usually ascertained at predefined time intervals. However, some participants may withdraw from the study before completion; these participants are classified as "lost to follow-up" from that point onwards. Details of the number of participants who are lost to follow-up in each of the study arms are essential (Box 2, Part E), as this provides information on the reliability of the study's conclusions. When participants cannot be accounted for at the end of the study, their outcome status cannot be determined. If substantial numbers of participants are lost to follow-up, concerns may arise about the integrity of any observed effect of an intervention.
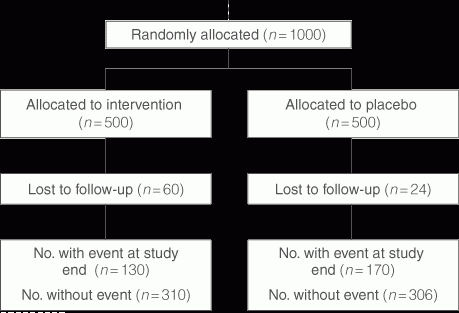
A common approach to evaluating the potential influence of losses to follow-up is to use a sensitivity analysis, where worst-case and best-case scenarios relating to these losses are examined. For example, at one extreme, it could be assumed that all the control-arm and none of the intervention-arm participants who were lost to follow-up suffered the outcome of interest. At the other extreme, the opposite (ie, all intervention-arm participants lost to follow-up and none of the control participants lost to follow-up have suffered the outcome of interest) could be assumed. This provides bounds for the maximum possible influence of such losses on the observed treatment effect. Less extreme (more plausible) scenarios can also be examined. If this results in the effect of treatment disappearing or reversing direction, the robustness of the results should be questioned. Box 3 provides an example.
Compliance losses
A further issue in interpreting study results is the degree to which participants adhered to their allocated treatment during the study period. Participants who stop or never take their allocated treatment are usually called "drop-outs", and those who begin active treatment when they have been allocated to the control group are called "drop-ins"; all are considered compliance losses. Compliance losses reduce the study power and dilute the observed effects of treatment, and should be documented in the participant flow (Box 2, Part E). Where such non-compliance can be predicted in advance, its potential effect on the power of the study may be reduced by increasing the study sample size.3 Differential compliance rates may offer clues as to the real side-effects of an intervention, or about the success of methods used to blind participants or clinicians to treatments.4
Analysis
Part F of Box 2 relates to the number of participants who were included in the statistical analyses. If any other than those lost to follow-up have been excluded from analysis, both the number in each treatment arm and the reasons should be detailed. As excluding patients from analysis can potentially undermine the effectiveness of the randomisation4 and produce comparisons which may no longer conform to the intention-to-treat principle,5 the nature of, and justification for, any such exclusions should also be provided.
Conclusions
Different study types may slightly alter the participant flow diagram. For example, a cluster-randomised study will enumerate the clusters of randomised subjects (ie, the units of randomisation, such as whole communities, schools, hospital departments) rather than the number of individuals.
Participant flow diagrams are an effective method of summarising all stages of key trial processes. They suggest how these processes should be reported in the trial, specifying separately trial enrolment, treatment allocation, subject follow-up and statistical analysis. In reporting the results of randomised studies, all individuals originally considered for participation in the study should be accounted for in the participant flow diagram. The diagram also provides an overview of many aspects of study quality that can have a major influence on the generalisability and reliability of the conclusions.
1: CONSORT checklist of items to report when reporting a trial
Section and topic |
Item no. |
Descriptor |
|||||||||
Participant flow |
13 |
Flow of participants through each stage of a clinical study (a diagram is strongly recommended). Specifically, for each group, report the numbers of participants randomly assigned, receiving intended treatment, completing the study protocol, and with data analysed for the primary outcome. Describe deviations from the planned study protocol, together with reasons. |
|||||||||
3: Sensitivity analysis for a hypothetical study of 1000 participants with 300 events observed, but 84 participants lost to follow-up
Patient no. |
|||||||||||
Basis of analysis |
Intervention |
Control |
Odds |
95% CI |
P |
||||||
Observed events only (lost subjects excluded) |
130/440 |
170/476 |
0.76 |
0.57–0.996 |
0.047 |
||||||
All lost participants in placebo group, but none in intervention group assumed to have suffered an event |
130/500 |
194/500 |
0.55 |
0.42–0.73 |
< 0.001 |
||||||
All lost participants in intervention group, but none in placebo group assumed to have suffered an event |
190/500 |
170/500 |
1.19 |
0.92–1.54 |
0.19 |
||||||
Comment: The study had lost enough participants to follow-up to potentially nullify any conclusion of a significant treatment benefit based on the most extreme assumptions about event occurrence in lost subjects. A more plausible scenario might be to assume that the event rate among lost subjects was twice that seen in those with full follow-up. In this instance, up to 35 of the 60 lost subjects in the intervention arm and 17 of the 24 in the placebo arm could be anticipated to have experienced the event. The boundaries this yields (odds, 0.59; 95% CI, 0.45–0.77; P < 0.001 to odds, 0.96; 95% CI, 0.74–1.24; P = 0.74) again calls into question whether a definite effect of treatment can be concluded. |
|||||||||||
Competing interests
None identified.
References
- Moher D, Schulz K, Altman D. The CONSORT statement: revised recommendations for improving the quality of reports of parallel group randomised trials. Lancet 2001; 357: 1191-1194. i1082403
- Wing LMH, Reid CM, Ryan P, et al, for the Second Australian National Blood Pressure Study Group. A comparison of outcomes with angiotensin-converting enzyme inhibitors and diuretics for hypertension in the elderly. N Engl J Med 2003; 348: 583-592. i1082405
- Kirby A, Gebski VJ, Keech AC. Determining the sample size in a clinical trial. Med J Aust 2002; 177: 256-257. http://www.mja.com.au/public/issues/177_05_020902/kir10425_fm.html i1082407
- Beller EM, Gebski VJ, Keech AC. Randomisation in clinical trials. Med J Aust 2002; 177: 565-567. <eMJA full text>
- Fisher LD, Dixon DO, Herson J, et al. Intention to treat in clinical trials. In: Peace KE, editor. Statistical issues in drug research and development. New York: Marcel Dekker; 1990. i1082411
Interpreting Australian Stillbirth Rate Trends: Implications for Surveillance and Continuous Quality Improvement
Aleena M. Wojcieszek, Kirstine Sketcher-Baker, Christine Andrews, Michael Coory, Imogen Kettle, Melissa Malivoire, David Ellwood, Vicki Flenady
Paracetamol in Pregnancy: Uncertain Evidence, Certain Consequences
David J. Tunnicliffe, Miranda Cumpston, Debra Kennedy, Margie Danchin, Armando Teixeira-Pinto
Fatty Liver Disease in Australia: A Narrative Review on the Epidemiology, Natural History, Prognostication and Management in People With Metabolic Dysfunction
Karl Vaz, Daniel Clayton-Chubb, William W. Kemp, Stuart K. Roberts, Ammar Majeed
Birth prevalence, clinical sequelae, and management of congenital cytomegalovirus infections in Australia, 1999–2023: a national prospective study
Ece Egilmezer, Suzy M Teutsch, Carlos Nunez, Stuart T Hamilton, Adam W Bartlett, Pamela Palasanthiran, Elizabeth J Elliott, William D Rawlinson
The number of cancer‐related deaths that could be attributable to spatial disparities in survival in Australia, 2010–2019: a retrospective population‐based cohort study
Charlotte K Bainomugisa, Jessica Cameron, Paramita Dasgupta, Peter Baade
Mandatory research projects during medical specialist training in Australia and New Zealand
Paulina Stehlik, Caitlin Brandenburg, David A Henry