


Recent changes restricting residential aged care facility (RACF) admissions according to need have resulted in increased numbers of high-care-dependent residents with complex, multiple medical conditions.1,2 From 1998 to 2000, while RACF resident numbers increased by 1.6% to 135 991, the number of high-care-dependent residents increased by 7.6%, compared with an 8.7% decrease in low-care-dependent resident numbers. Excluding respite-care admissions, average length of stay increased from 128.2 to 137 weeks.3-5
Knowledge of the organisation and standards of care and morbidity of elderly people in the community and RACFs remains limited.1,6,7 Increased frailty may not necessarily result in increased GP visits. There is recent evidence of a decrease of 2.8% in Medicare non-referred attendances at RACFs between 1998 and 2000.8 It could be argued that high-care-dependent residents (who may exhibit phthisical deterioration, including dementia, and receive high levels of nursing care) are less likely than low-care-dependent residents (who are not provided with nursing support) to receive GP visits. In addition, GP interactions with RACFs may be dependent on individual RACF protocols and procedures. The decreased service provision by GPs may also be associated with RACF efforts at GP care substitution.8
There is a need to understand the link between general practice care and RACF quality of care and health outcomes. The RACGP's Standards for general practices require that practices make provision for RACF visits where medically indicated.9 Nonetheless, GPs generally are not involved in clinical and quality-of-care issues associated with RACF management.10,11 This article examines Medicare data since 1984 to determine what change there has been in the cohort of GPs servicing RACFs.
We used the Easytrieve data retrieval system12 to extract from the Medicare datasets from 1984 to 2000 all non-procedural nursing home services claimed by non-specialist practitioners. All the RACF non-referred attendance item numbers included in the Medicare Benefits Schedule (MBS) since February 1984 were included (Box 1). We retrieved 24 566 889 Medicare claim observations for analysis.
The SAS statistics system13 was used to derive data summaries of the number of RACF services claimed and number of GP claimants by age group and sex from 1984 to 2000. Of the 773 335 GP demographic observations, 18 351 were adjusted for year of birth where this had been incorrectly entered in the Medicare provider demography databases. In these cases, GP age was estimated based on year of basic qualification.
The non-parametric Cochran–Mantel–Haenszel statistics, which test the null hypothesis that there is no association between stratified variables,14 were used to test for any confounding effects of GP sex on RACF services by GP age group.
The Mantel–Haenszel χ2 tests for the significance of linear trends of frequency distributions.14 It was used to test the significance of changes in the summary distributions of aggregate GP age group and sex values and RACF services by GP age group and sex from 1984 to 2000.
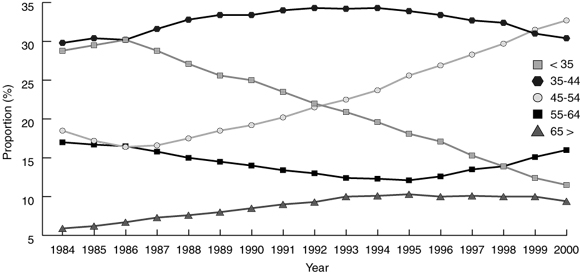
RACF GPs increased in absolute terms from 8586 in 1984 to 12 651 in 1999. Nonetheless, as a proportion of all Medicare-billing GPs, RACF GP numbers remained at just over 50% (52.9% in financial year 1984–85, compared with 52.7% in 1998–99).15 Over all years, GPs aged between 35 and 44 years have formed an average of around 32.5% of the RACF GP workforce. The proportion of GPs younger than 35 years peaked at 30.2% of all RACF GPs in 1986, and fell to 11.5% in 2000. GPs in age groups 45 years and older comprised 58.1% of all RACF GPs in 2000, compared with 41.4% in 1984. The proportion of RACF GPs aged 65 years and older rose from 5.9% in 1984 to 9.4% in 2000 (P < 0.001) (Box 2).
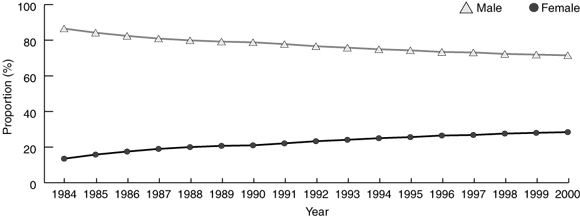
In 1984, 22.7% of the non-specialist practitioner workforce was female — by 1999 this had increased to 33.3%.15 Consistent with these trends, women comprised 28.4% of all RACF GPs in 2000, compared with 13.5% in 1984 (Box 3). While the number of male GPs who provided RACF services as a proportion of all male GPs declined marginally between financial years 1984–85 (58.4%) and 1998–99 (57.0%), the number of female RACF GPs as a proportion of all female GPs increased by 9.7 percentage points (to 43.9%).
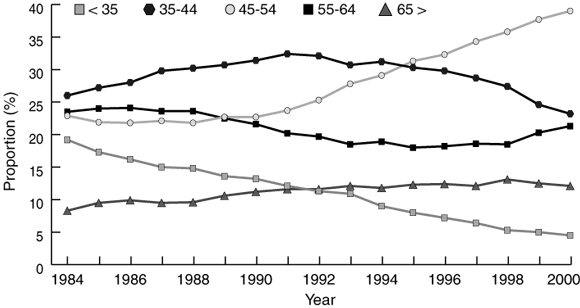
The proportion of RACF services by GPs younger than 35 years fell from 19.2% of all services in 1984 to 4.5% in 2000. GPs aged 45 years and older provided 72.4% of all services in 2000, compared with 54.7% in 1984 (P < 0.001) (Box 4).
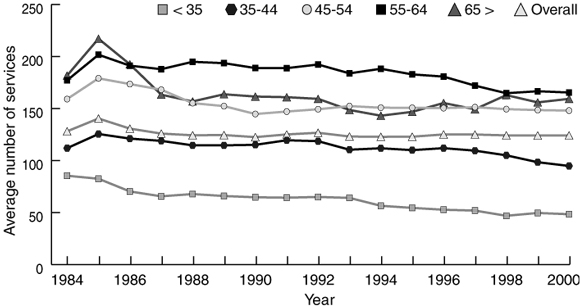
The average number of RACF services per GP has remained stable at about 125.9 services per year. The average number of RACF services per year provided by GPs younger than 35 years fell from 85.4 in 1984 to 48.4 in 2000. Between 1984 and 2000, GPs aged 55 years and older have been the most active in servicing RACFs (Box 5).
Female GPs accounted for 15.9% of all RACF services in 2000, compared with 8.9% in 1984 (P < 0.001), but the average number of services per female GP declined by 15.6 services per year (to 69.6) and the average number of services per male GP increased by 11.2 services per year (to 146.0).
The increasing rate of RACF service provision by older GPs is independent of the declining rate among female GPs (P < 0.001 for age group, after controlling for sex).
The Medicare database represents the most comprehensive dataset of medical services in Australia. Although analysis of Medicare claim payment data does not address the nature of the services provided or the quality of clinical care, it is important in describing the current rate of GP RACF services and trends over time.
Our results suggest that there is a decreasing engagement of the GP workforce with RACFs. Younger GPs have declined considerably as a proportion of all RACF GPs, and, although female RACF GP numbers have increased, average servicing levels of both female GPs and GPs younger than 45 years are considerably reduced compared with older GPs. It would seem that RACFs have become increasingly reliant on an established cohort of older, male GPs.
The increasing proportion of female GPs in the workforce and the declining involvement of female GPs with RACFs has implications for the maintenance of RACF services over the longer term, particularly given the trend for residents to be frailer and have more complex care needs. Female GPs typically prefer practice-based consultations involving the clinical management of acute conditions and younger patients, and work fewer hours than male GPs.16,17 About 60% of the GP trainee workforce was female in 1999.15 The Australian Medical Workforce Advisory Committee has suggested that an expected rapid increase in female GP numbers is likely to have a major impact on supply of general practice services.18 While increased female GP participation is desirable on equity grounds, it is clear that the work preferences of female GPs will impact on supply of services as older, generally male, GPs reduce their professional commitment and eventually retire.
The current arrangements for general practice RACF services have been described as ineffective, lacking in outcome-oriented medical standards, and poorly remunerated.11 Further research is needed on models of RACF care that can underpin the provision of quality general practice and meet potential inadequacies in supply of RACF services. Important areas to explore are flexibility of funding of GP support of RACFs, and organisational structures that would support improved clinical and outcome standards and enable part-time and other alternative employment opportunities that are likely to be more attractive to women.19 It will also be important to ensure that postgraduate training programs include specific exposure to RACF residents and the range of clinical problems and other care issues they may have.
1: Medicare Benefits Schedule (MBS) Residential Aged Care Items, 1984–2001
Year |
Item |
||||||||||
1984–1987 |
41, 42, 45, 46 |
||||||||||
1988–1990 |
77, 78, 79 |
||||||||||
1991–1999 |
20, 35, 43, 51, 92, 93, 95, 96 |
||||||||||
2000–2001 |
20, 35, 43, 51, 92, 93, 95, 96, 730, 734, 736, 738, 775, 778, 779 |
||||||||||
These MBS items are for all time-limited categories of non-specialist consultations at residential aged-care facilities. |
|||||||||||
- Gregory A Lewis1
- Robert W Pegram2
- Commonwealth Department of Health and Ageing, Canberra, ACT.
The Commonwealth Department of Health and Ageing supported the production of this article. We thank Gordon Calcino and Bronwen Harvey of the Commonwealth Department of Health and Ageing for their assistance in preparing this article.
None identified.
- 1. Flicker L. Healthcare for older people in residential care — who cares? Med J Aust 2000; 173: 77-79. <MJA full text>
- 2. McCallum J, Simons L, Simons J, et al. The continuum of care for older people. Aust Health Rev 1995; 18(2): 40-55.
- 3. Australian Institute of Health and Welfare. Residential aged care facilities in Australia 1998: a statistical overview. Canberra: AIHW, 1999.
- 4. Australian Institute of Health and Welfare. Residential aged care facilities in Australia 1998–99: a statistical overview. Canberra: AIHW, 2000.
- 5. Australian Institute of Health and Welfare. Residential aged care in Australia 1999–00: a statistical overview. Canberra: AIHW, 2001.
- 6. Byles JE. A thorough going over: evidence for health assessments for older persons. Aust N Z J Public Health 2000; 24: 117-123.
- 7. Korten AE, Jacomb PA, Jiao Z, et al. Predictors of GP service use: a community survey of an elderly Australian sample. Aust N Z J Public Health 1998; 22: 609-615.
- 8. Lewis GA, Pegram RW. Primary medical care services to residents of aged care facilities. Part one: current patterns of service provision. Canberra: Commonwealth Department of Health and Aged Care, 2001.
- 9. Standard 1.1, criterion 1.1.5. The Royal Australian College of General Practitioners. Standards for general practices. Melbourne: RACGP, 2000.
- 10. Miller DK, Coe RM, Morley JE, Gettman J. Total Quality Management and geriatric care. Aust J Ageing 1978; 17(1) Suppl: 60-65.
- 11. Draper BM. Medical care in aged-care facilities: new directions. Med J Aust 1999; 171: 94-96.
- 12. Easytrieve Plus [computer program]. Version 6.0D. Oak Brook, Illinois: Pansophic Systems Inc., 1990.
- 13. SAS Information Delivery System [computer program]. Version 8. Cary, North Carolina: SAS Institute Inc., 1999.
- 14. Cody RP, Smith JK. Applied statistics and the SAS programming language. Upper Saddle River, New Jersey: Prentice Hall, 1997; 88-92.
- 15. Commonwealth Department of Health and Aged Care. General practice in Australia: 2000. Canberra: The Department, 2000: 46-47.
- 16. Britt H, Miller GC, Charles J, et al. General practice activity in Australia 1999–2000. Canberra: Australian Institute of Health and Welfare, 2000 (AIHW Cat. No. GEP-5).
- 17. Australian Medical Workforce Advisory Committee. Characteristics of students entering Australian medical schools 1989 to 1997. Sydney: AMWAC, 1997: 46.
- 18. Australian Medical Workforce Advisory Committee. Medical workforce supply and demand in Australia — a discussion paper. Sydney: AMWAC, 1998; 59.
- 19. Australian Medical Workforce Advisory Committee. Female participation in the Australian medical workforce. Sydney: AMWAC, 1996; 87-89.
Abstract
Objective: To examine the demographic changes in the cohort of general practitioners servicing residential aged-care facilities (RACFs) from 1984 to 2000.
Design: Quantitative analysis of Medicare datasets from 1984 to 2000.
Participants and setting: All GPs who provided Medicare-claimed RACF services from 1984 to 2000.
Main outcome measures: Aggregate data on RACF GPs by age group and sex; total and average number of RACF services by GP age group and sex.
Results: The proportion of RACF GPs younger than 35 years has declined from a peak of 30.2% in 1986 to 11.5% in 2000. GPs aged 45 years and older made up 58.1% of all RACF GPs in 2000, compared with 41.4% in 1984. In 2000, 28.4% of RACF GPs were female, compared with 13.5% in 1984. The proportion of RACF services provided by GPs younger than 35 years fell from 19.2% in 1984 to 4.5% in 2000, and the proportion provided by GPs aged 45 years and older increased from 54.7% to 72.4%. Female GPs' RACF services as a proportion of all RACF services increased from 8.9% to 15.9% between 1984 and 2000, but the average number of RACF services per female GP declined by 15.6 services per year. In contrast, the average number of RACF services per male GP increased by 11.2 per year. The increasing rate of RACF servicing by older GPs is independent of female GPs' declining involvement.
Conclusion: Our results suggest an increasing reliance on older, male GPs in the supply of RACF services. Although the proportion of female RACF GPs has increased, average services by these GPs, who are generally younger, has declined. The personal and work preferences of female GPs may have implications for future RACF services supply as older, generally male, GPs retire.