


As in most parts of the Western world, the incidence of end-stage renal disease (ESRD) in Australia has been steadily increasing over the past decade, with an annual average increase of 7% between 1991 and 1998. In 1991, there were 57 new cases per million population; by 1998, that had increased to 85 cases per million.1 Likewise, prevalence increased by an average 6% per year from 382 per million population in 1991 to 555 per million in 1998.
The situation in the Northern Territory (NT) is significantly worse. In 1998, the incidence was 299 and the prevalence was 726 per million population. The reason for this is the very high rates of ESRD in the NT's Aboriginal population (72% of all ESRD in the NT). Among patients undergoing dialysis, transplant rates since 1992 in Aboriginal patients (2.2%–5.8%) were lower than the national average (12.2%–14.5%).1,2 NT Aboriginal patients were also more likely to receive haemodialysis (HD) and less likely to receive continuous ambulatory peritoneal dialysis. In 1997, only 8% of dialysis patients received continuous ambulatory peritoneal dialysis in the NT, compared with the national average of 28%.
Although huge costs are incurred every year in providing renal replacement treatments for patients with renal failure, there has been no research to identify the actual annual cost for patients receiving dialysis treatment in the NT. Further, because of differences in study populations, methods and dialysis settings (hospital, satellite or home-based treatment) in various countries, there are no consistent international findings on the costs of these treatments.
We examined the costs associated with ESRD in patients receiving HD treatments in the region of the Northern Territory known as the "Top End" (the Darwin, Katherine and East Arnhem regions). We aimed to:
establish whether there are differences between Aboriginals and non-Aboriginals receiving HD in terms of patient demographics, comorbidities or episodes of care and costs;
identify the relationship between costs and cause of admissions;
develop a time-series model to forecast volumes of dialysis treatments; and
project future costs on the basis of these forecasts.
We used patient data from the three public hospitals in the Top End of the NT (Royal Darwin, Katherine and Gove) for the fiscal years 1996–97 and 1997–98. The Royal Darwin Public Hospital and the urban dialysis unit were the only two dialysis facilities in the Top End in the study period. The study population was selected based on their procedure (International classification of diseases, 9th revision, clinical modification [ICD-9-CM]3 code 39.95 —haemodialysis) and their diagnosis-related group (DRG-3 572 — admit for renal dialysis).4 All hospitalisations of patients in the study cohort were included in the study dataset. Thus, episodes of care for these patients included both routine dialysis and hospitalisations that may or may not have been related to the patient's renal disease. In addition, monthly data on the number of dialysis treatments from January 1995 to December 1999 were used for the projection. There were no home-based dialysis programs in the Top End during the study period. A seven-day rule was applied to adjust the patient-year-at-risk (PYAR) to allow for patients moving from one program to another. Intervals of more than seven days between any two treatments were excluded from the calculation of the PYAR.
Episodes of care were costed from expenditure data from the three public hospitals for the same period. A top-down method known as cost modelling was used to allocate costs from the hospital general ledger to patient episodes grouped according to the DRG-3 classification. This method has been described in detail by various authors,5,6 and is widely used in Australian public hospitals. In line with the national hospital costing study methods, 13 cost components were included.7 These were costs in nursing, medical, allied health, pathology, imaging, pharmacy, emergency, intensive care, operating theatre, on-costs, prostheses, goods/supplies and "other". Capital costs and depreciation were excluded, as the hospitals did not have accrual accounting systems in place during the study period.
We used Stata 6 statistical software8 to apply a t-test for analysing the difference in the number of admissions, length-of-stay and costs between Aboriginal and non-Aboriginal patients. We used a multiple regression model to establish the relationship between cost and primary causes of admissions.9-11 Time-series modelling was used to forecast future demand for HD treatment. This method has been widely used in medicine,12,13 epidemiology14,15 and health economics,16-18 with the Autoregression Integrated Moving Average (ARIMA) model being shown to be useful in predicting future values when there is a significant random component.12,14-19 A dialysis-specific univariate ARIMA model was developed to project the future demand for HD treatment. Three steps were involved in developing the model — identification, estimation, and diagnostic checking (see detail in Peter, 1990).19 The projected future demand for dialysis treatment was converted to dollars, with a base-unit cost of $527 per treatment, with a 2.5% per annum adjustment for inflation.
Of the 165 patients (84 male, 81 female) in the cohort, 101 (61%) were Aboriginal (while Aboriginals comprised only 25% of the total population of 143 000 in the Top End in 1997). Most patients receiving dialysis were aged between 30 and 69 years. Only 4% were aged less than 20 years, another 4% were in the 20–29-years age group, and a further 4% were aged 70 years or more. The average age of patients receiving dialysis was 48 (SE, ± 14) years, with no difference between Aboriginal (average, 47 years) and non-Aboriginal (average, 49 years) patients (P > 0.05). Nor was there any age difference between females and males (P > 0.05).
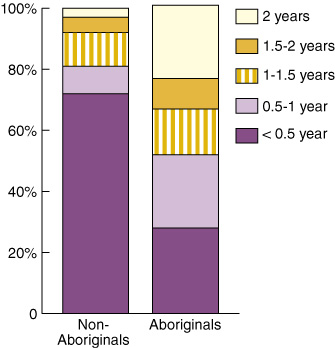
The average duration on the dialysis program was 0.95 (SE, ± 0.77) years. Aboriginals stayed in the HD program significantly longer than non-Aboriginals (1.1 years v 0.4 years; P < 0.05). As shown in Box 1, 72% of non-Aboriginals stayed in the dialysis program for less than half a year and only 3% stayed in the program for more than two years.
Of the 18 527 episodes of care recorded for the 165 patients, 18 039 (97.36%) were for routine haemodialysis and 488 (2.64%) for other hospitalisations. The actual number of dialysis treatments received by the cohort was more than 18 527, as patients continued to receive dialysis treatment during periods of hospitalisation for other reasons. The average number of routine haemodialysis treatments per patient in two years was 109 (SE, ± 105). Aboriginals had more routine dialysis treatments than non-Aboriginals (140 v 62; difference, 78; 95% CI, 48–110; P < 0.05). After adjusting for the number of routine dialysis treatments per PYAR, the values were 137 for Aboriginals and 146 for non-Aboriginals (P > 0.05).
One hundred and twelve patients (68%) accounted for all of the 488 hospitalisations for reasons other than dialysis; 87 of these were Aboriginal (86% of 105) and 25 were non-Aboriginal (39% of 64). These 112 patients consumed 4312 bed-days, with an average length of stay per episode of 8.83 days. There was a significant difference in the mean number of bed-days used by the 64 non-Aboriginals and the 101 Aboriginals (13 v 35 days per patient; P < 0.05). These data are summarised in Box 1. After adjusting for PYAR on this measure, differences in the number of admissions and bed-days for non-Aboriginals and Aboriginals remained statistically significant (P < 0.05).
A total of 25 663 patients were hospitalised in the three Top End public hospitals during the study period. These patients received a total of 59 568 episodes of care, at a total cost of $140.87 million. The study cohort comprised about 0.7% of all inpatients, but they received 31.1% of all inpatient episodes of care (18 527), and consumed 8.8% ($12.4 million) of total inpatient resources. Of the $12.4 million spent on the study population, $9.5 million (77%) was for routine dialysis and $2.9 million (23%) was spent on hospitalisations. The average cost per routine dialysis treatment was about $527. Aboriginals represented 61% of all patients in the study cohort, but consumed 79% of the total treatment costs ($9.5 million). The average cost per Aboriginal patient in the study period was $73 600, compared with $32 000 for non-Aboriginals. However, after adjusting for PYAR, the annual cost per patient was $71 000 for Aboriginals and $76 000 for non-Aboriginals.
Of the $2.9 million expended on hospitalisations, 87 Aboriginal patients incurred $2.4 million and 25 non-Aboriginal patients incurred $0.5 million. The crude average hospitalisation cost per patient was $23 834 in Aboriginal and $8229 in non-Aboriginal patients (P < 0.05). This difference remained significant after adjusting for PYAR, with the annual hospital cost per patient of $41 648 for Aboriginals and $21 295 for non-Aboriginals (P < 0.05).
Box 3 shows the causes, length of stay and costs of hospitalisations over the study period. Fluid, electrolyte and acid–base disorders (22%), respiratory (17%) and dialysis-related (17%) complications were the three most frequent reasons for admission. The most bed-days were attributed to dialysis-related access procedures, dialysis-related complications and respiratory diseases (17%, 17% and 15%, respectively), as were the highest costs (14%, 21% and 11%, respectively).
Across the entire cohort, cost was strongly related to respiratory and skin diseases, septicaemia, fluid, electrolyte and acid–base disorders and other morbidities. For Aboriginal patients, septicaemia, dialysis-related complications and respiratory diseases were significantly related to total cost. For non-Aboriginal patients, the diseases which significantly influenced cost were cardiovascular diseases, fluid, electrolyte and acid disorders, digestive diseases and other comorbidities.
Of the total $12.4 million consumed by the cohort, almost a third was in nursing costs and almost another third in goods, supplies and services (15%) and pharmacy (14%) costs. Relatively higher proportions were spent in routine haemodialysis than in intercurrent hospitalisations in nursing (33% v 23%), goods, supplies and services (16% v 11%), allied health professionals (6% v 4%), emergency department resources (5% v 1%) and staff salary oncosts (superannuation and termination payments, provision for long service leave and other payments) (12% v 8%).
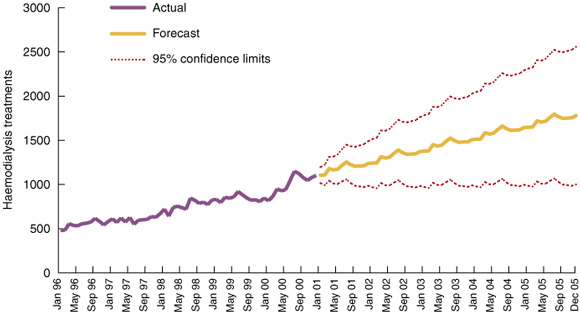
As illustrated in Box 4, the ARIMA model predicted that the number of haemodialysis treatments would increase by 19% in the first year and by 11%, 10%, 9% and 8% in the following years, giving an average increase of 12% per year between 2000 and 2004. This rate of increase would result in 87 710 treatments in 2004. The cost implications for the NT are significant, with the additional cost over five years estimated to be $49.8 million.
The study population represented 0.6% of inpatients in the three public hospitals in the Top End, but accounted for 8.8% of total inpatient costs ($12.4 million). A one-year study at a single medical centre in the United States reported that end-stage renal disease patients (25% of all inpatients) engendered 44% to 48% of total cost.20 Various reasons may contribute to the higher proportion of costs spent in our study population. Our Top End patients with end-stage renal disease cost 14.7 times the average, while those in the US study cost 1.8 times the average. This might be the result of differences in the methods and in the cost components included (eg, the US study did not document whether it included hospital overhead costs). Another reason might be the high proportion of Aboriginal patients in our study population. These patients had poorer health status and consumed more hospital resources. There has been no similar national study that could provide a comparison so far. A well-designed, Australia-wide study would be required to test these possibilities in the Australian context.
The higher costs of hospitalisation for Aboriginal patients can be partly explained by their longer period in the treatment program. One reason is that Aboriginal patients had lower rates of both renal transplant and continuous ambulatory peritoneal dialysis.2 Non-Aboriginal patients had more treatment options (eg, haemodialysis, peritoneal dialysis and transplantation) and were more likely to shift from one mode of treatment to another. Longer periods in the program inevitably result in more opportunities to incur costs in both routine haemodialysis treatments and hospitalisations. This has significant implications for forecasting future costs, as treatment duration will also increase if survival improves for people receiving treatment for end-stage renal disease.
However, even after adjusting costs for PYAR, hospitalisation costs are still significantly higher for Aboriginal patients. This is consistent with the recognised poorer health status of Aboriginal people. Further, there might also be social reasons for some hospitalisations and protracted length of stay, although further study is required to explore these issues.
Although some comorbid diseases and complications accounted for proportionately lower costs, they had a significant impact on total costs. For instance, the cost of fluid, electrolyte and acid–base disorders represented only 9% of total hospitalisation costs, but this was statistically significant in the regression model. More effective education is required on controlling water intake and managing dialysis volume in patients with end-stage renal disease. Cardiovascular disease is highly related to overall costs in non-Aboriginal patients and respiratory diseases to overall costs in Aboriginal patients. Appropriately targeted intervention and treatment programs for these diseases are required to reduce hospital admissions and costs.
The univariate time-series model has been recognised as one of the classic models in finance and economics. A well-constructed ARIMA model could truly represent the historical pattern. In general, the result of the projection needs to be interpreted in the context of changing interest rates and other factors which are not reflected in the historical data. From our model, an average annual 12% increase in haemodialysis treatment is expected in the next five years. The dramatic increase in the first year might be related to the opening of a new dialysis unit in one remote community in 1999. It might also be the reason for a true increase in incidence in 1999 (W H, NT ESRD Registry, unpublished data). The actual rate may need to be adjusted to take these into consideration. Adjustments to the cost projection would also be required if home-based programs were introduced.
If our projections are correct, an extra $50 million of services will be required in the next five years. More investment in primary, secondary and early tertiary prevention will be vital if hospitalisation costs are to be reduced. Primary care is important in reducing the incidence of risk factors for renal disease, such as diabetes, essential hypertension and skin infection. Reducing the risk factors for renal disease is a long-term strategy that could be achieved by community development, health promotion and effective early intervention. Screening and treatment programs for at-risk populations can reduce the incidence of renal failure by effectively retarding the progression of renal disease.21-25 Additionally, such programs can improve patients' quality of life. Various studies have shown that, if patients with end-stage renal disease are promptly referred to nephrologists and receive adequate dialysis treatment and treatment of anaemia, nutritional status, blood pressure and diabetes, both initial length of stay in hospital and morbidity can be reduced.26-27 The higher labour costs incurred in delivering dialysis through institutional units suggest that home-based or community-based dialysis might achieve great cost savings. An ambulatory care model that is appropriate in the NT context needs to be developed and evaluated in terms of both costs and outcomes.
In conclusion, a multipronged strategy designed to reduce the incidence and prevalence of end-stage renal disease, retard its progression and prevent medical complications is required. Significant new investment in primary care is required to achieve these goals.
2: Comparison of hospitalisations for the 64 non-Aboriginal and 101 Aboriginal patients
Parameter |
Non-Aboriginal |
Aboriginal |
|||||||||
Total |
|||||||||||
Total patient-years (mean) |
27 (0.42) |
104 (1.03) |
|||||||||
No. (%) of admitted patients |
25 (39%) |
87 (86%) |
|||||||||
Total bed-days |
821 |
3491 |
|||||||||
Total cost |
$500 000 |
$2 400 000 |
|||||||||
Crude average |
|||||||||||
No. of admissions per patient (of 165 patients) |
1 |
4* |
|||||||||
Bed-days per patient |
13 |
35* |
|||||||||
Cost per patient |
$8 229 |
$23 834* |
|||||||||
Adjusted average |
|||||||||||
No. of admissions per patient-year |
3 |
6* |
|||||||||
Bed-days per patient-year |
29 |
55* |
|||||||||
Cost per patient-year |
$21 295 |
$41 648* |
|||||||||
* Difference from non-Aboriginal significant at P < 0.05. |
|||||||||||
3: Causes, length of stay and costs of hospitalisations during the two-year period
Admissions |
Days of hospitalisation |
Costs |
|||||||||
Total |
488 |
4312 |
$2 933 917 |
||||||||
Diseases or disorders |
|||||||||||
Fluid, electrolyte and acid–base status |
105 (22%) |
382 (9%) |
$258 424 (9%) |
||||||||
Respiratory |
82 (17%) |
627 (15%) |
$329 734 (11%) |
||||||||
Dialysis-related complications |
81 (17%) |
730 (17%) |
$605 019 (21%) |
||||||||
"Other"* |
45 (9%) |
497 (12%) |
$397 024 (14%) |
||||||||
Kidney and urinary tract |
38 (8%) |
238 (6%) |
$213 910 (7%) |
||||||||
Dialysis-related access procedures |
33 (7%) |
722 (17%) |
$420 996 (14%) |
||||||||
Cardiovascular |
33 (7%) |
195 (5%) |
$150 107 (5%) |
||||||||
Septicaemia |
22 (5%) |
325 (8%) |
$254 104 (9%) |
||||||||
Digestive |
12 (2%) |
93 (2%) |
$59 115 (2%) |
||||||||
Skin |
11 (2%) |
139 (3%) |
$84 565 (3%) |
||||||||
Endocrine, nutritional and metabolic diseases |
8 (2%) |
120 (3%) |
$41 196 (1%) |
||||||||
Hepatobiliary and pancreas |
8 (2%) |
122 (3%) |
$28 900 (1%) |
||||||||
Musculoskeletal and connective tissue |
7 (1%) |
99 (2%) |
$82 910 (3%) |
||||||||
Reproductive system |
3 (1%) |
23 (1%) |
$7 913 (< 1%) |
||||||||
* Includes diseases such as those of the nervous system, eye, and ear, nose, mouth and throat. |
|||||||||||
- Jiqiong You1
- Yuejen Zhao2
- Carol Beaver3
- Wendy Hoy4
- Kathy Eagar5
- 1 Department of Health and Community Services, Casuarina, NT.
- 2 Menzies School of Health Research, Darwin, NT.
- 3 Centre for Health Service Development, Faculty of Commerce, University of Wollongong, Wollongong, NSW.
This study was jointly supported by the Menzies School of Health Research (MSHR) and the Northern Territory Department of Health and Community Services (DHCS). It was undertaken in parallel with "An evaluation of the cost-effectiveness of renal and cardiovascular screening and treatment program on the Tiwi Islands in the NT", conducted by Mr Philip Baker and Dr Wendy Hoy at MSHR. We acknowledge the support and help of research fellows at MSHR and staff of the Nightcliff Dialysis Unit and the renal unit at Royal Darwin Hospital.
None declared.
- 1. Disney APS, editor. The twenty second report. Australia and New Zealand Dialysis and Transplant Registry, 1999. Adelaide: The Registry, 2000.
- 2. Disney APS, Russ GR, Walker R. The twenty first report. Australia and New Zealand Dialysis and Transplant Registry, 1998. Adelaide: The Registry, 1998.
- 3. International classification of diseases, ninth revision, clinical modification (ICD-9-CM). 2nd ed. Sydney: National Coding Centre, Faculty of Health Sciences, University of Sydney, 1996.
- 4. Australian national diagnosis related groups (AN-DRGs). 3rd Version. Canberra: Commonwealth Department of Human Services and Health, 1993.
- 5. Hindle D. The costing bridge: data issues in product costing. The national casemix series. Canberra: Department of Human Services and Health, 1994.
- 6. Jackson T. Cost estimate for hospital inpatient care in Australia: evaluation of alternative sources. Aust N Z J Public Health 2000; 24: 234-241.
- 7. Commonwealth Department of Health and Aged Care. Report on the national hospital cost data collection. Canberra: Commonwealth Department of Health and Aged Care, 1998.
- 8. Stata statistical software [computer program]. Version 6. College Station, TX: Stata Corporation, 1999.
- 9. Krzanowski WJ. Principles of multivariate analysis: a user's perspective. Oxford: Clarendon Press. 1988: 516-528.
- 10. Sen A, Srivastava M. Regression analysis: theory, methods, and applications. New York: Springer-Verlag, 1990: 231-252.
- 11. Daniel WW. Biostatistics: a foundation for analysis in the health sciences. New York: John Wiley & Sons, 1999: 517.
- 12. Sumi A. Time series analysis of surveillance data of infectious diseases in Japan. Hokkaido Igaku Zasshi 1998; 73: 343-363.
- 13. Abdel-Aal RE, Mangoud AM. Modeling and forecasting monthly patient volume at a primary health care clinic using univariate time-series analysis. Comput Methods Programs Biomed 1998; 56: 235-247.
- 14. Quenel P, Dab W. Influenza A and B epidemic criteria based on time-series analysis of health services surveillance data. Eur J Epidemiol 1998; 14: 275-285.
- 15. Catalano R, Serxner S. Time series designs of potential interest to epidemiologists. Am J Epidemiol 1987; 126: 724-731.
- 16. Kendix M, Getzen TE. US health services employment: a time series analysis [see comments]. Health Econ 1994; 3: 169-181.
- 17. Radosch U. Provision of health care services in Austria. A time series approach. Health Econ 1995; 4: 479-483.
- 18. Gravelle HS. Time series analysis of mortality and unemployment. J Health Econ 1984; 3: 297-305.
- 19. Diggle PJ. Time series: a biostatistical introduction. Oxford: Clarendon Press, 1990.
- 20. Bruns FJ, Seddon P, Saul M, Zeidel ML. The cost of caring for end-stage kidney disease patients: an analysis based on hospital financial transaction records. J Am Soc Nephrol 1998; 9: 884-890.
- 21. Mackenzie HS, Brenner BM. Current strategies for retarding progression of renal disease. Am J Kidney Dis 1998; 31: 161-170.
- 22. Brenner BM, Mackenzie HS. Nephron mass as a risk factor for progression of renal disease. Kidney Int 1997; 63 Suppl: S124-S127.
- 23. Lafferty HM, Brenner BM. Are glomerular hypertension and "hypertrophy" independent risk factors for progression of renal disease? Semin Nephrol 1990; 10: 294-304.
- 24. Hoy WE, Mathews JD, McCredie DA. The multidimensional nature of renal disease: rates and associations of albuminuria in an Australian Aboriginal community. Kidney Int 1998; 54: 1296-1304.
- 25. Hoy WE, Baker P, Kelly A. Reducing premature death and renal failure in Australian aboriginals. A community-based cardiovascular and renal protective program. Med J Aust 2000; 172: 473-478. <eMJA full text>
- 26. Obrador GT, Pereira BJ. Early referral to the nephrologist and timely initiation of renal replacement therapy: a paradigm shift in the management of patients with chronic renal failure. Am J Kidney Dis 1998; 31: 398-417.
- 27. Hannah R, Levin NW, London R, Osheroff WJ. Renal disease in the managed care setting: selection and monitoring or outcome criteria. Am J Kidney Dis 1999; 33 Suppl: S4-S16.
Abstract
Objective: To compare hospital costs of Aboriginal and non-Aboriginal patients having haemodialysis treatment and forecast the future treatment cost.
Methods: The costs of patients with HD in the "Top End" of Australia's Northern Territory were estimated for the financial years 1996/97 and 1997/98 using a hospital costing model. We used an Autoregression Integrated Moving Average model to predict future demand.
Results: 165 patients (101 Aboriginal and 64 non-Aboriginal) were treated at a total cost of $12.4 million in this two-year period. These 165 patients represented 0.7% of inpatients, 8.8% of total inpatient costs and 31.6% of total inpatient episodes of care in the Top End region. $9.5 million (77%) was spent on routine haemodialysis treatment and $2.9m (23%) on other hospitalisations. The average cost per routine haemodialysis treatment over the two-year period was $527, or $78 600 per patient treatment year. Hospitalisations for comorbidities occurred in 86% of Aboriginal and 39% of non-Aboriginal patients. Average cost per patient, number of admissions and length of hospital stays were all significantly greater for Aboriginals. We predict an average increase in the number of treatments of 12% each year over the next five years and a five-year cost of $49.8m.
Conclusions: A multipronged strategy designed to reduce the prevalence and costs of renal failure is required.