Error rates in Australian chemical pathology laboratories
Mounira Khoury, Leslie Burnett and Mark A Mackay
MJA 1996; 165: 128-130
For editorial comment, see Bryant
Readers may print a single copy for personal use. No further
reproduction or distribution of the articles in whole or in part
should proceed without the permission of the publisher. For
copyright permission, contact the
Australasian Medical Publishing Company
Journalists are welcome to write news stories based on what they read here, but should acknowledge their source as "an article published on the Internet by The Medical Journal of Australia <http://www.mja.com.au/>".
Abstract - Introduction - Methods - Measurement criteria - Participants - Survey - Statistical analysis - Results - Participation - Transcription errors - Analytical performance - Combined error rates - Discussion - Acknowledgements - References - Authors' details
Register to be notified of new articles by email - - ©MJA1996
Abstract Objective: To measure transcription and analytical errors made by Australian chemical pathology laboratories.
Design: Retrospective data collection covering the period 1 November 1993 to 1 April 1994.
Setting and participants: Fourteen pathology laboratories in five Australian States (seven in the public sector, and seven in the private sector).
Main outcome measures: Error rates in transcribing information from request forms to computer record systems, and laboratory performance on chemical analysis.
Results: Pathology laboratories had a transcription-error rate of up to 39% and an error rate of up to 26% for analytical results. The worst-performing laboratory had errors (of patient identification or results of analysis) in 46% of requests. The three best-performing laboratories achieved 85% error-free reporting, with one achieving 95%.
Conclusions: Error rates in Australian pathology laboratories vary widely, but may be as high as 46% for all specimens in some laboratories. The types of errors reported were under the control of the laboratory, and would affect the accuracy of reported pathology test results, with potential adverse outcomes for patient care and inefficient use of health-care resources. There is a need to establish broader quality assurance programs and performance requirements to reduce these types of error.
MJA 1996; 165: 128-130
Introduction
T he Quality in Australian Health Care Study 1 described an unacceptable rate of preventable adverse events involving patients which occur in Australian hospitals. Errors introduced into the process of requesting pathology tests can adversely affect patient management and will detract from quality of care and services. 2 At best, a sample may need to be collected again to repeat the analysis, inconveniencing the patient, delaying treatment and increasing the cost. At worst, a doctor may act on incorrect results and the patient may be treated inappropriately.In its most common diagnostic setting, the process of requesting pathology tests seems simple: the doctor writes a request, the pathology laboratory interprets the request, transcribes information from the request form to its computer system, performs the analysis, and the pathologist produces a printed report for return to the doctor. This process assumes that the patient has been correctly identified, an appropriate specimen has been obtained, analysis has been correctly performed, and the results of analysis have been communicated to the original requesting practitioner.
We recently examined the accuracy of one part of the process of obtaining pathology test results in a hospital environment and found that the address of the referring doctor had been incorrectly recorded on 3% of all printed reports issued, delaying or preventing delivery of the final pathology report. 3 If this rate of error were typical for the many other steps of the requesting process for pathology tests, then the total error rate in obtaining results would be extremely high.
To address this question, we surveyed clinical pathology laboratories from both public and private sectors of five Australian States to determine whether error rates in pathology are as widespread and as clinically significant as our earlier study suggested.
Methods
Measurement criteria
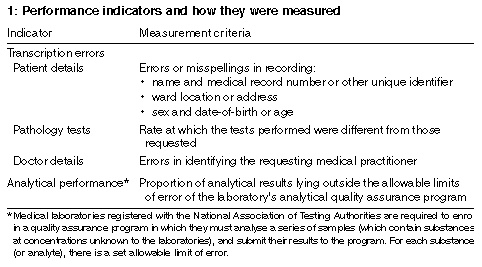
We identified potential indicators using national Quality Award
criteria for benchmarking indicators, 4 focusing on factors affecting
medical outcomes which arose from the pathology laboratory. In this
paper, we report on transcription errors and analytical performance
in chemical pathology quality assurance programs. Details of these
criteria and how they were measured are shown in Box 1. We did not
examine how laboratories functioned to deliver these outcomes.

Participants
We approached 18 large National Association of Testing
Authorities-registered laboratories, well recognised in the
industry, representing both public and private sectors, in
five Australian States (Queensland, New South Wales, Victoria,
Tasmania and South Australia).
Survey
Survey forms, which included detailed instructions and operational
defini tions of the information required, were completed by the
laboratories between 1 May and 31 July 1994.
One hundred hand-written pathology request forms dated between 1 November 1993 and 1 April 1994 were randomly selected by the participating laboratories. We excluded request forms which also contained requests for blood transfusion or tissue pathology because some laboratories adopt more stringent identification criteria for these types of specimens. Laboratories scored the number of transcription errors (defined as any instances where the data on individual request forms were not identical to the data entered into the laboratory's computer system 5 ).
Chemical pathology quality assurance (QA) data were from one cycle of analysis within the QA program (there are two or three cycles annually, depending on the program) during 1993 and 1994. Laboratories scored the total number of QA samples analysed, and the proportion of results of these analyses that lay outside the allowable limits of error of the QA program.
All data, as well as a summary of the relative performance of all other participants (each assigned a number so that they were not identifiable), were returned to each laboratory for validation before final analysis.
Statistical analysis Data analysis was based on the binomial distribution. 5 Calculation of combined error rates was based on the product of constituent error-free components, with the standard deviation calculated from the sum of variances of individual component errors. Results
Participation Fourteen laboratories (seven public and seven private, numbered 1-14 to preserve anonymity) completed the entire benchmarking study; all five States were represented.
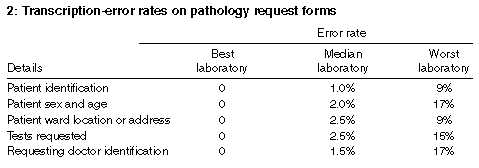
Transcription errors Box 2 shows our findings for particular types of transcription errors. Most laboratories lay within a tight distribution clustered around median error rates of 1% to 3%. For each transcription error listed, a single outlier -- a different laboratory in each case -- performed particularly badly.

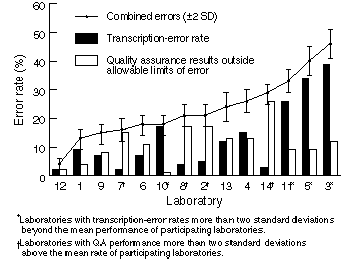
The Figure shows that, while two laboratories were able to achieve
overall transcription-error rates of less than 3%, four had error
rates more than two standard deviations above the mean error rate
(13%) of participating laboratories ( P < 0.05). The
laboratory with the poorest performance reported a
transcription-error rate of 39%.

Analytical performance Laboratories recorded errors outside the allowable limits of error in up to 26% of analytical results. As shown in the Figure, four laboratories reported unacceptable performance more than two standard deviations above the mean rate (11.4%) of participating laboratories ( P < 0.05).
Combined error rates By matching the transcription-error rate with analytical performance, we were able to measure the proportion of all pathology requests that would have been free of either type of error (Figure). Three laboratories showed superior performance compared with peers, achieving 85% error-free reporting, with one achieving 95% error-free reporting (a total error rate of less than 5%). These three laboratories represented both the public and private sectors, were all from different States, and each used a different computer system and clinical chemistry analyser.
The two laboratories which showed the poorest performance reported transcription errors or unacceptable ana lytical performance in more than a third of all requests. They were both hospital laboratories from the same State. Their high total error rates were particularly influenced by transcription errors.
Discussion This pilot survey of laboratory performance is the first of its kind to have been done in Australia. Previous studies have reported particular types of laboratory errors (e.g., patient ward location or address) in 0.08% 6 to 3% 3,6,7 of requests.
We have confirmed that median error rates for individual types of errors in routine pathology requests are of the order of 3% 3 (see Box 2), and overall error rates can be as high as 46%.
While some of the laboratories operated with few or no errors, eight of the fourteen reported significantly inferior performance (Figure). Further, our findings indicate that some laboratories may be making transcription errors in up to 39% of all request forms, and can have error rates of 9% in patient identification data and 17% in data such as sex and date-of-birth. Such error rates should be a cause of clinical concern.
Risk management in pathology laboratories recognises the relationship between proper identification of specimens and the prevention of adverse patient-care-related incidents. 2 Our study was not designed to trace particular errors to final clinical outcomes, or to distinguish between errors on the basis of severity. However, it would be surprising if transcription-error rates of the magnitude we encountered did not contribute to adverse clinical outcomes.
Are the errors caused by the requesting doctor, or by the laboratory? Several laboratories used direct electronic capture of patient data from a database, which should minimise errors in patient identification data arising from illegible handwriting. These laboratories did not have lower rates of transcription error for patient identification data than those relying solely on handwritten pathology requests. Indeed, the two laboratories with the highest overall rates of transcription error both obtained their patient identification data from a central database. This leads us to conclude that poor handwriting by the requesting doctor was not the major factor in high rates of transcription errors.
Errors in pathological tests come at a considerable cost to the community. Expenditure on pathology investigations in Australia amounts to some $1.4 billion -- approximately 4% of total health services expenditure (Australian Association of Pathology Practices, personal communication). Incorrect tests being performed in up to 15% of cases wastes medical resources. Requesting doctors being incorrectly identified on up to 17% of requests will result in laboratories incurring unnecessary delivery costs and doctors incurring additional costs, as they will need to obtain duplicate copies of reports not delivered, and will request repeat testing for results unable to be located.
We believe that most of these errors could have been prevented by the laboratories. The three best-performing laboratories in our study used different equipment and computer systems, and operated in both public and private sector environments. We therefore suggest that superior overall performance can be achieved by controlling error rates at each step in the process, and that this can be done in diverse ways.
All recognised medical testing laboratories within Australia are required to be accredited, and to participate in QA programs for analytical quality. However, there are no minimum standards of performance which laboratories are required to maintain within these QA programs. There are also no Australian QA programs which monitor non-analytical aspects of pathology laboratories, such as transcription errors. We recommend that QA programs should be introduced for a range of clinically important areas of laboratory performance, such as request transcription accuracy, transport and analysis times for key analytes (e.g., potassium), rapid reporting of critical patient data, and client satisfaction, in addition to existing programs for analytical quality. We also recommend that summaries of actual and achievable performance in these QA programs be published.
Without laboratory participation and satisfactory performance in such programs, doctors cannot be confident that test results are correct. Indeed, they cannot even be confident that the result was obtained for the correct patient. Lower error rates in pathology tests should lead to improved patient outcomes and less wastage of health resources.
Acknowledgements
We thank the staff of the participating laboratories for their
assistance with this study. We are grateful to Elizabeth Benson, Jon
Currie, Jeremy Chapman, Doug Chesher and Ruth Pojer for their
critical comments on the manuscript.
References
- Wilson RM, Runciman WB, Gibberd RW, et al. The Quality in Australian
Health Care Study. Med J Aust 1995; 163: 458-471.
-
Lord JT. Risk management in pathology and laboratory medicine.
Arch Pathol Lab Med 1990; 114: 1164-1167.
-
Banning J, Brown J, Hooper L, et al. Reduction of errors in
laboratory test reports using continuous quality improvement (CQI)
techniques. Clin Lab Management Rev 1993; 7: 424-437.
-
Australian Quality Awards Foundation. Assessment criteria and
application guidelines. Sydney: Australian Quality Council, 1994.
-
Grant EL, Leavenworth RS. Statistical quality control. 6th ed.
Singapore: McGraw-Hill. 1988.
-
Burnett L, Banning J. Reduction of errors in laboratory test
reports: comparison of continuous quality improvement techniques
with laboratory information system techniques. In: Parkany M,
editor. Quality assurance and TQM for analytical laboratories.
Cambridge, UK: The Royal Society of Chemistry, 1995: 97-101.
-
Chambers AM, Elder J, O'Reilly DStJ. Blunder-rate in a clinical
biochemistry service. Ann Clin Biochem 1986; 23: 470-473.
(Received 20 Nov 1995, accepted 22 May 1996)
Authors' details
Faculty of Clinical Chemistry, School of Life Sciences, University
of Technology (Gore Hill Campus), Sydney, NSW.
Mounira Khoury, MSc(Clin Biochem), Graduate Student.
Institute of Clinical Pathology and Medical Research, Westmead
Hospital, Sydney, NSW.
Leslie Burnett, PhD, FRCPA, Director of Clinical Chemistry.
Mark A Mackay, MSc, Hospital Scientist and Quality
Facilitator.
Reprints: Associate Professor Leslie Burnett, Assistant
Director, Institute of Clinical Pathology and Medical Research,
Westmead Hospital, Westmead, NSW 2145.
< URL: http://www.mja.com.au/> © 1996 Medical Journal of Australia.
Received 7 February 2026, accepted 7 February 2026
- Mounira Khoury
- Leslie Burnett
- Mark A Mackay


