


Abstract
Objectives: Hospital data used to assess regional variability in disease management and outcomes, including mortality, lack information on disease severity. We describe variance between hospitals in 30-day risk-adjusted mortality rates (RAMRs) for stroke, comparing models that include or exclude stroke severity as a covariate.
Design: Cohort design linking Australian Stroke Clinical Registry data with national death registrations. Multivariable models using recommended statistical methods for calculating 30-day RAMRs for hospitals, adjusted for demographic factors, ability to walk on admission, stroke type, and stroke recurrence.
Setting: Australian hospitals providing at least 200 episodes of acute stroke care, 2009–2014.
Main outcome measures: Hospital RAMRs estimated by different models. Changes in hospital rank order and funnel plots were used to explore variation in hospital-specific 30-day RAMRs; that is, RAMRs more than three standard deviations from the mean.
Results: In the 28 hospitals reporting at least 200 episodes of care, there were 16 218 episodes (15 951 patients; median age, 77 years; women, 46%; ischaemic strokes, 79%). RAMRs from models not including stroke severity as a variable ranged between 8% and 20%; RAMRs from models with the best fit, which included ability to walk and stroke recurrence as variables, ranged between 9% and 21%. The rank order of hospitals changed according to the covariates included in the models, particularly for those hospitals with the highest RAMRs. Funnel plots identified significant deviation from the mean overall RAMR for two hospitals, including one with borderline excess mortality.
Conclusions: Hospital stroke mortality rates and hospital performance ranking may vary widely according to the covariates included in the statistical analysis.
The known Variance in patient outcomes between hospitals treating acute stroke needs to be reliably assessed. Methodology for standardising risk adjustment is evolving and requires field testing. The data in hospital admission databases are limited with regard to risk adjustment.
The new Since 2009, the Australian Stroke Clinical Registry has captured data on stroke severity and other variables. The data have been used to improve risk adjustment when comparing hospital mortality rates; they can also be reliably linked to death registrations to compare methods for assessing risk-adjusted hospital mortality.
The implications Including appropriate risk adjustment variables will ensure that comparisons of hospital performance regarding important patient outcomes for stroke are reliable.
Stroke imposes a major health care burden, but the adoption of effective interventions varies widely.1 Efforts to improve the quality of stroke management rely on rigorous outcomes data2 for avoiding misleading comparisons of hospitals. To identify potentially modifiable factors, analyses must account for casemix differences and random error.3 In particular, analyses must take stroke severity into consideration, as it is one of the strongest predictors of stroke mortality.2,4,5
Although the methodology is still evolving, standardised risk adjustment2 is highly relevant to health care consumers and policy makers. In a recent report of routinely collected hospital admissions data, significant variation in 30-day stroke mortality was found after adjusting for age, sex and comorbidities (including hypertension and diabetes), but there was no adjustment for stroke severity.6 The National Health Performance Authority (NHPA) has identified stroke as a condition for which inter-hospital differences in models of care (eg, patterns of patient transfers) and inconsistent recording of clinical information and procedures (eg, palliative care coding) may distort comparisons of mortality.7 Because hospital data must be complete, accurate and consistent, the NHPA is currently unable to support public reporting of inter-hospital disease mortality rates, as such comparisons could be unreliable.7 In contrast, the ability to reliably compare hospital performance with respect to patient outcomes has rapidly accelerated improvements in health care overseas.7
Our aim was to describe variance in 30-day stroke mortality between hospitals using risk-adjusted mortality rates (RAMRs), as part of our trialling a recently recommended new statistical method that includes stroke severity as a covariate.2
Methods
Study design
The Australian Stroke Clinical Registry (AuSCR) is a voluntary, prospective, clinical quality registry that captures standardised data for nationally agreed variables for all patients admitted to participating hospitals with acute stroke or transient ischaemic attack (TIA).8 AuSCR includes personal information (eg, name, address), clinical characteristics (eg, type of stroke), quality of care indicators (eg stroke unit treatment), and outcomes measured at discharge and at 90–180 days (eg, survival and quality of life).8 Stroke severity is captured using a simple, validated prognostic measure, the “ability to walk unaided at the time of hospital admission”.9 In the original statistical modelling by Counsell and colleagues,9 this criterion was associated with a relative risk for 30-day survival of 1.63 (95% confidence interval [CI], 1.15–2.31). In our earlier work, the strongest predictor of independence at time of hospital discharge was the ability to walk on admission (odds ratio [OR], 2.84; 95% CI, 2.18–3.71).10
Data from participating hospitals were obtained for the period from 15 June 2009 (six participating hospitals) until 31 December 2014 (40 participating hospitals). We included all stroke types (ischaemic, intracerebral haemorrhage, and undetermined) in our analyses, as well as demographic variables, as stroke mortality is higher at all ages for Indigenous than for non-Indigenous Australians,11 varies according to country of birth,12 and is greater for people of lower socio-economic status.13 Socio-economic status was assessed by matching patients’ addresses with the corresponding Index of Relative Socio-economic Advantage and Disadvantage (IRSAD) score,14 collated as quintiles. Whether the stroke was the first or subsequent stroke experienced by the patient was included as a covariate, as the risk of death is greater for recurrent events.15 Age was included as a continuous measure in all models. All episodes occurring within 30 days of admission were included. Harrell’s concordance statistic (C-statistic) was used to determine how well the variable “ability to walk on admission” predicted 30-day mortality in our models.
We excluded patients who experienced a stroke while in hospital for another condition or when transferred from another hospital, as the different patterns of care may distort mortality ratios.7,16 Data for stroke care in a paediatric hospital were also excluded because of the small sample size (fewer than 50 care episodes).
Mortality data
Survival status at 30 days was obtained by probabilistic matching of AuSCR registrant identifiers with the National Death Index (NDI) by the Australian Institute of Health and Welfare. AuSCR staff undertook the review of non-exact matches; for discordant dates, we used NDI data as the reference. Based on this linkage method, in-hospital death reporting in the AuSCR had 98.8% sensitivity and 99.6% specificity, compared with an in-hospital death determined with the NDI date of death.
Outcome measures and analyses
The primary outcome was the risk-adjusted mortality rate (RAMR) at 30 days after admission, using the method recommended by the American Heart (AHA) and Stroke Associations (ASA).2 To maximise the reliability of our estimates,17 analyses were conducted for individual hospitals that provided data on at least 200 episodes of care for stroke between 2009 and 2014. The stages in deriving each model were:
-
entering the observed values;
-
generating estimates from generalised linear latent and mixed models (GLLAMM) by maximum likelihood;
-
generating expected probabilities;
-
generating predicted probabilities;
-
generating ratios predicted as expected; and
-
generating the RAMR.
The RAMR for each hospital was calculated by dividing the overall RAMR by the risk-adjusted average hospital mortality, and then multiplying by the overall crude (unadjusted) proportion of deaths in the whole sample.
The results were compared in models with covariates corresponding to those available in hospital admissions data (the hospital admissions model) and after also including covariates corresponding to those available only in the AuSCR (the Registry model). A model adjusted only for age and sex was also estimated. The hospital admissions model was adjusted for age, sex, year of data, stroke subtype, IRSAD quintile, Indigenous status, and place of birth (Australia v elsewhere). The Registry model was adjusted for the same variables, as well as for stroke history and severity. Differences between the models in the ranking of individual hospitals were explored.
Data are provided on the calibration and discrimination of the models,2 using the likelihood ratio test, the Akaike information criterion (AIC), the Bayesian information criterion (BIC), and the C-statistic. A smaller AIC or BIC indicates a better fitting model; a C-statistic of 1 indicates a perfect fit model, while a C-statistic of 0.5 indicates that fit is no better than chance. Multilevel models were used, with one level defined as the hospital unit, to account for correlations between patients who were managed in the same hospital, and the other representing patients as individual units.
P < 0.001 (two-sided) was deemed statistically significant because of the large sample size. Analyses were performed in Stata 12.1 (StataCorp).
Identifying significant mortality variation and differences in mortality outcomes
According to standard practice, hospitals within two standard deviations (SDs) of the overall average RAMR were deemed to lie within normal variation, and those outside three SDs were deemed to vary significantly from the other hospitals in the sample.18 Funnel plots were used to investigate deviations from the average hospital mortality rate.19 The direction of the change was also explored by graphing the difference between the age- and sex-adjusted hospital admissions and Registry RAMR estimates.
Ethics approval
Appropriate ethics and governance approvals were obtained for all participating hospitals in AuSCR, and from the Human Research Ethics Committee of Monash University (reference, CF11/3537–2011001884). Ethics approval was obtained from the Australian Institute of Health and Welfare to conduct data linkage to the National Death Index (reference, EO 2013/2/16).
Results
Between 2009 and 2014, 26 302 episodes of care for 24 806 individual patients from 45 hospitals were recorded; 3151 patients (12%) died within 30 days of admission (excluding TIAs, 14%). The concordance of ability to walk on admission as an indicator of stroke severity with 30-day mortality was excellent (C-statistic, 0.97). Patients with intracerebral haemorrhage (29%) were more likely to die within 30 days than those with other stroke types (ischaemic, 12%; undetermined stroke, 14%; TIAs, < 1%) (online Appendix 1).
Data from hospitals reporting at least 200 episodes of stroke care
Eighteen hospitals located in metropolitan areas and ten in rural and regional areas, each with a stroke unit, provided data for at least 200 episodes of care. Hospitals in the eastern states contributed most data (Victoria, 40% of episodes; New South Wales, 17%; Queensland, 34%; Tasmania, 4%); in Western Australia (5% of episodes), only two hospitals participated. We excluded from our analysis 7509 patients who had a TIA or in-hospital stroke, or who were transferred from another hospital (online Appendix 1).
In total, 16 218 episodes of care were provided to 15 951 individual patients (median age, 77 years; women, 46%; ischaemic stroke, 79%). Compared with patients who were alive 30 days after admission, the proportion of women among those who died was greater; they were also older, fewer were able to walk on admission, and more had a history of stroke or TIA (Box 1). The characteristics of patients with stroke were similar across the 28 hospitals with respect to age, sex, and ability to walk on admission (online Appendix 2). The proportions of patients with severe strokes were similar for hospitals with more or fewer episodes of care (data not shown; P = 0.59).
Comparison of hospital 30-day mortality outcomes
The unadjusted (crude) mortality rates for the 28 hospitals with at least 200 episodes of care ranged between 7% and 23%. Excluding the 7509 patients who had a TIA or in-hospital stroke, the unadjusted mortality rates for hospitals ranged between 5% and 20%, and the age- and sex-adjusted mortality rates ranged between 8% and 20%. The RAMRs estimated by the hospital admissions model ranged between 9% and 20%, and those by the Registry model between 9% and 21% (Box 2). The overall RAMRs adjusted for different combinations of Indigenous status, country of birth and history of stroke are reported in online Appendix 3. According to the model fit statistics (BIC, AIC, likelihood ratio test, C-statistic), the Registry model had the best fit (Box 3, online Appendix 3). Correlations between the number of episodes contributed by a hospital and the differences between age- and sex-adjusted RAMRs and the Registry RAMR estimates (R2 = 0.021) or hospital admissions RAMRs (R2 = 0.001) were low. When the results of the hospital admissions and Registry models were compared, the variance ranged between 0% and 3%.
Although the ranges of estimates by the adjusted models were similar, the rank order of hospitals changed according to the initial crude estimate and simple age- and sex-adjusted models (Box 2; online Appendix 4). The change in ranks in the hospital admissions and full Registry models illustrates the possibility of a hospital attaining very different results. The models with the best fit were those that included stroke severity as a covariate (Box 3). Based on the funnel plot distribution, the estimated mortality for only two hospitals was more than three SDs from the mean, one with low mortality, and the other with borderline excess mortality relative to other hospitals (Box 4).
Quality of care and correlations with mortality rates
Adherence to processes of care was similar for all hospitals (online Appendix 2). Stroke unit admissions ranged from 99% for the hospital with lowest RAMR to 80% for the hospital with the highest RAMR (weak positive correlation between increased stroke unit access and lower RAMR: R2 = 0.138). A negligible positive correlation was noted between increased prescription of antihypertensive drugs at discharge and lower RAMR (R2 = 0.021).
Discussion
Assessing the quality of health care delivered by different health care providers is complicated by the variable quality of routinely collected hospital data.7 For burdensome conditions such as stroke, this problem is exacerbated by the inability to account for differences in stroke severity and by inaccuracies in the coding of diagnosis or cause of death.20 Clinical quality registries have emerged as important tools for resolving these problems, but support from government agencies is not as consistent in Australia as in comparable countries.
We have provided an important illustration of the value of a national clinical quality registry for stroke, using a new method for calculating mortality statistics. The models with the best fit for standardising mortality were those that included adjustment for stroke severity, a covariate routinely available only in AuSCR. The change in rank position according to different RAMRs was clearest for hospital 20, which was ranked number 12 in the full Registry model, but number 25 in the hospital admissions model. Rankings that are not based on models adequately adjusted for relevant risks can lead to interpretations that suggest that some hospitals provide substandard care, and thereby impugn their reputations and that of their clinicians. The funnel plot approach provides an alternative method for assessing performance, but the control limits associated with the assumption of a normal distribution of the data makes caution advisable, particularly if the data are skewed, as in our sample of only 28 hospitals. For the hospital with the lowest mortality in each of the models (Hospital 1), selection bias may have arisen because 99% of its patients were treated in a stroke unit (online Appendix 2), and other unmeasured factors may have also contributed to its better outcome.
Our findings differ from a previous investigation of hospital stroke mortality rates in NSW that applied more conventional modelling methods, without adjusting for stroke severity.6 Standardised 30-day mortality rates varied significantly, from 15% to 30%, and several hospitals were categorised as “poor performers”.6 Cases were sampled across different timeframes and with varying sample sizes, but there was a greater diversity of hospitals than in our study; for example, hospitals without stroke units were included.
Registry data that include disease severity risk-adjustment variables that supplement hospital data can be used to ensure that performance comparisons are more reliable. Given the growth in public reporting of hospital performance and the recognition of its potentially driving improvement of quality of care,21 it is essential that appropriate methods are employed. We estimated RAMRs using a new approach recommended by the AHA/ASA,2 replacing the observed number of deaths with a prediction of numbers of deaths estimated from the average number of deaths for hospitals in a risk-adjusted model. This reduces the influence of chance on the variation in RAMRs (predicted v expected). Our study is the first report on the application of this new approach, and our models predicted numbers of deaths within 0–9% of the actual number.
Our investigation has broader implications for Australia, in that it advances methods for hospital-level comparisons of risk-adjusted mortality, particularly on the basis of routinely collected registry data. We acknowledge, as a limitation of our study, that not all hospitals contribute data to AuSCR, and our findings may consequently not be generalisable to all hospitals. Further, our sample was restricted to hospitals reporting at least 200 episodes of care (10 084 episodes from 17 hospitals were therefore excluded from our analyses). Including all hospitals may have led to greater variance in our results, but our sample was broadly representative of the entire cohort (online Appendix 1). The overall crude 30-day death rate for eligible hospitals (with at least 200 episodes of care) was 15% (range, 7–23%), similar to reports from other countries (13–15%).4,17
Critical predictors of stroke mortality include age, sex, stroke severity, and comorbidities,18 and a further limitation of our study was the inability to adjust for comorbidities, but inconsistent reporting of International Classification of Diseases (ICD-10) coding of comorbidities is recognised.22 Future linking of AuSCR data with hospital admissions data will enable a greater range of variables to be explored. Several International stroke registries incorporate National Institutes of Health Stroke Scale (NIHSS) data that can be used for adjusting for stroke severity, but training is required to administer the NIHSS.23 The ability to collect NIHSS data was introduced in AuSCR in 2015, but the level of missing data currently undermines its usefulness, whereas “ability to walk on admission” information was available for 90% of episodes. In recent validation work,9 a model based on simple variables (including ability to walk) performed as well as one employing NIHSS and age data; the choice of measure should therefore be based on practical considerations.24 Because there were very few episodes of intracerebral haemorrhage, we included stroke type as a covariate rather than stratifying the dataset, as has been previously recommended by other authors.25
In conclusion, we highlight the importance of using appropriate risk adjustment variables and methods for comparing hospital outcomes for stroke, with particular emphasis on the need to account for stroke severity. Moreover, we have shown the value of clinical quality disease registry data for refining outcome performance measurement in health care. As this is an evolving field, further research into risk adjustment variables and comparison of mortality rates is encouraged.
Box 1 – Demographic and clinical characteristics for patients admitted to 28 hospitals with at least 200 episodes of care in the Australian Stroke Clinical Registry (AuSCR), 2009–2014
|
|
Status at 30 days |
P |
|||||||||||||
|
Died |
Living |
||||||||||||||
|
|
|||||||||||||||
|
Number of patients |
2372 |
13 846 |
|
||||||||||||
|
Sex (men) |
1043 (44%) |
7604 (55%) |
< 0.001 |
||||||||||||
|
Age (years)∗ |
|
|
< 0.001 |
||||||||||||
|
< 65 |
209 (9%) |
3485 (25%) |
|
||||||||||||
|
65–74 |
321 (14%) |
3292 (24%) |
|
||||||||||||
|
75–84 |
794 (34%) |
4291 (31%) |
|
||||||||||||
|
≥ 85 |
1048 (44%) |
2672 (20%) |
|
||||||||||||
|
Median (IQR) |
84 (76–89) |
75 (65–83) |
< 0.001 |
||||||||||||
|
Country of birth† |
|
|
< 0.001 |
||||||||||||
|
Australia |
1452 (67%) |
8622 (67%) |
|
||||||||||||
|
United Kingdom |
163 (8%) |
1005 (8%) |
|
||||||||||||
|
Italy |
133 (6%) |
615 (5%) |
|
||||||||||||
|
Other European countries |
240 (11%) |
1315 (10%) |
|
||||||||||||
|
Asia |
64 (3%) |
580 (5%) |
|
||||||||||||
|
Other countries |
108 (5%) |
782 (6%) |
|
||||||||||||
|
Identifies as Aboriginal and/or Torres Strait Islander∗ |
15 (1%) |
158 (1%) |
0.024 |
||||||||||||
|
Previous stroke/transient ischemic attack‡ |
550 (26%) |
2966 (23%) |
0.001 |
||||||||||||
|
Index of Relative Socio-economic Advantage and Disadvantage (IRSAD) |
|
|
0.016 |
||||||||||||
|
Quintile 1 (most disadvantaged) |
376 (16%) |
2078 (15%) |
|
||||||||||||
|
Quintile 2 |
444 (19%) |
2729 (20%) |
|
||||||||||||
|
Quintile 3 |
242 (10%) |
1712 (12%) |
|
||||||||||||
|
Quintile 4 |
527 (22%) |
3010 (22%) |
|
||||||||||||
|
Quintile 5 (least disadvantaged)) |
783 (33%) |
4317 (31%) |
|
||||||||||||
|
Type of stroke |
|
|
< 0.001 |
||||||||||||
|
Intracerebral haemorrhage |
765 (32%) |
1629 (12%) |
|
||||||||||||
|
Ischaemic |
1468 (62%) |
11 286 (82%) |
|
||||||||||||
|
Undetermined stroke type |
132 (6%) |
897 (7%) |
|
||||||||||||
|
Cause of stroke known§ |
1054 (47%) |
6511 (49%) |
0.027 |
||||||||||||
|
Stroke severity‡ |
|
|
|
||||||||||||
|
Able to walk on admission |
85 (4%) |
4857 (39%) |
< 0.001 |
||||||||||||
|
Patients with multiple episodes of stroke care recorded in AuCSR |
141 (6%) |
694 (5%) |
0.058 |
||||||||||||
|
|
|||||||||||||||
|
∗ Missing data: < 2%. † Missing data: 2–5%. ‡ Missing data: 6–10%. § Based on evidence of a structural, radiological, haematological, genetic or drug-related cause. 7509 patients with a transient ischemic attack or in-hospital stroke, or who were transferred from another hospital were excluded from analysis. |
|||||||||||||||
Box 2 – Comparison of ranking of hospitals according to 30-day mortality for stroke by the hospital admission and full registry models*
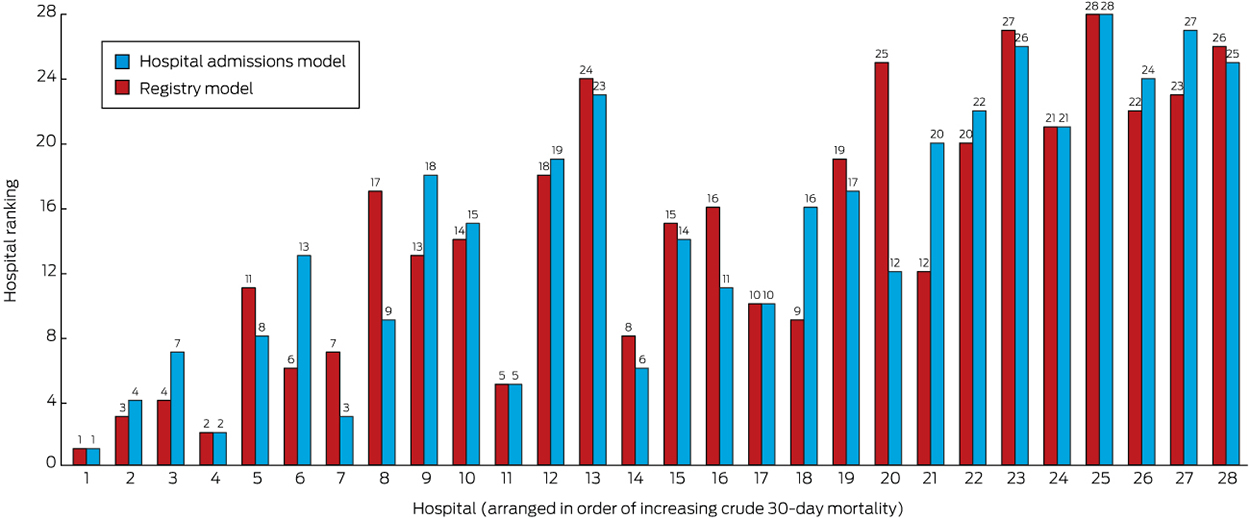
* The full data for this figure are included in online Appendix 4.
Box 3 – Summary statistics for goodness of fit of the three models of 30-day mortality rates for 28 hospitals providing at least 200 episodes of care in the Australian Stroke Clinical Registry, 2009–2014
|
|
Risk adjustment model |
||||||||||||||
|
Adjusted for age and sex |
Hospital admissions model* |
Registry model† |
|||||||||||||
|
|
|||||||||||||||
|
Association between risk-adjusted mortality rate and number of episodes |
P = 0.19 |
P = 0.29 |
P = 0.24 |
||||||||||||
|
Akaike information criterion (AIC) |
12 451 |
11 694 |
9322 |
||||||||||||
|
Bayesian information criterion (BIC) |
12 482 |
11 764 |
9405 |
||||||||||||
|
C-statistic (95% CI) |
0.69(0.68–0.71) |
0.74(0.73–0.75) |
0.80(0.79–0.81) |
||||||||||||
|
Likelihood ratio test |
P < 0.001 |
P < 0.001 |
Reference |
||||||||||||
|
|
|||||||||||||||
|
* Adjusted for age, sex, year of admission, stroke type, Index of relative Socio-Economic Advantage and Disadvantage, Indigenous status, and place or birth (Australia v elsewhere). † Adjusted for history of stroke, stroke severity, and other variables of the hospital admissions model. The likelihood ratio test compares the different models. |
|||||||||||||||
Box 4 – Funnel plot of risk-adjusted mortality rates for hospitals (Registry model)*
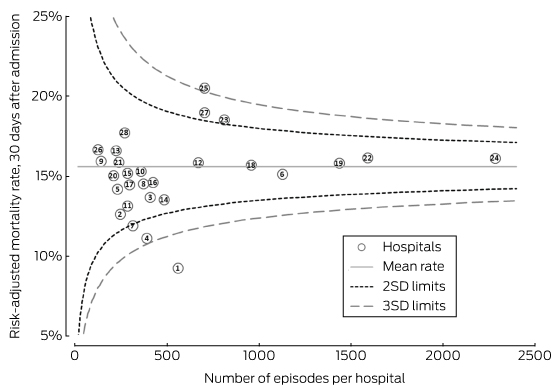
SD = standard deviation. * The numbers for the hospitals indicate their rank according to crude mortality rates (lowest to highest). Registry model was adjusted for age, sex, stroke type, index of relative socio-economic advantage and disadvantage, Indigenous status, country of birth, year of admission, history of previous stroke, and stroke severity.
Received 3 May 2016, accepted 11 October 2016
- Dominique A Cadilhac1,2
- Monique F Kilkenny1,2
- Christopher R Levi3
- Natasha A Lannin4
- Amanda G Thrift1
- Joosup Kim1,2
- Brenda Grabsch2
- Leonid Churilov2
- Helen M Dewey5
- Kelvin Hill6
- Steven G Faux7,8
- Rohan Grimley8
- Helen Castley9
- Peter J Hand10
- Andrew Wong11,12
- Geoffrey K Herkes13
- Melissa Gill14
- Douglas Crompton15
- Sandy Middleton16,17
- Geoffrey A Donnan2
- Craig S Anderson18,19,20
- 1 Monash University, Melbourne, VIC
- 2 Florey Institute of Neuroscience and Mental Health, Melbourne, VIC
- 3 John Hunter Hospital Campus, Newcastle, NSW
- 4 La Trobe University, Melbourne, VIC
- 5 Eastern Health Clinical School, Monash University, Melbourne, VIC
- 6 Stroke Foundation, Melbourne, VIC
- 7 St Vincent's Hospital, Sydney, NSW
- 8 Sunshine Coast Clinical School, University of Queensland, Birtinya, QLD
- 9 Royal Hobart Hospital, Hobart, TAS
- 10 Royal Melbourne Hospital, Melbourne, VIC
- 11 Royal Brisbane and Women's Hospital, Brisbane, QLD
- 12 University of Queensland, Brisbane, QLD
- 13 Royal North Shore Hospital, Sydney, NSW
- 14 Armidale Rural Referral Hospital, Hunter New England Local Health District, Armidale, NSW
- 15 Northern Health, Melbourne, VIC
- 16 St Vincent's Health Australia (Sydney), Sydney, NSW
- 17 Australian Catholic University, Sydney, NSW
- 18 The George Institute for Global Health, Sydney, NSW
- 19 Royal Prince Alfred Hospital, Sydney, NSW
- 20 The George Institute China at Peking University Health Science Center, Beijing, China
We acknowledge Joyce Lim and other staff from the George Institute for Global Health who contributed to establishing AuSCR. We also acknowledge staff from the Florey Institute of Neuroscience and Mental Health, including Karen Moss, Enna Salama, Kate Paice, Kasey Wallis, Adele Gibbs and Alison Dias from AuSCR Office, who contributed to AuSCR operations during this study period. Staff from the Stroke Foundation are acknowledged for their contributions to patient follow-up. We also thank the hospital staff for their diligence in collecting data for AuSCR, and hospital site investigators who provided data between 2010 and 2014. Dominique Cadilhac was supported by a fellowship from the National Health and Medical Research Council (NHMRC; 1063761; co-funded by the Heart Foundation), Amanda Thrift by an NHMRC fellowship (1042600), and Monique Kilkenny by an NHMRC Early Career Fellowship (1109426); Christopher Levi holds an NHMRC Practitioner Fellowship (1043913) and Craig Anderson an NHMRC Senior Principal Research Fellowship (1081356). AuSCR was supported by grants from the NHMRC (1034415), Allergan, Ipsen, Boehringer–Ingelheim, Monash University, Queensland Health, and the Stroke Foundation.
No relevant disclosures.
- 1. National Stroke Foundation. Clinical guidelines for stroke management 2010. Melbourne: Stroke Foundation, 2010. https://informme.org.au/guidelines/clinical-guidelines-for-stroke-management-2010 (accessed Sept 2016).
- 2. Katzan IL, Spertus J, Bettger JP, et al. Risk adjustment of ischemic stroke outcomes for comparing hospital performance: a statement for healthcare professionals from the American Heart Association/American Stroke Association. Stroke 2014; 45: 918-944.
- 3. Scott I, Youlden D, Coory M. Are diagnosis specific outcome indicators based on administrative data useful in assessing quality of hospital care? Qual Saf Health Care 2004; 13: 32-39.
- 4. Saposnik G, Hill MD, O’Donnell M, et al. Variables associated with 7-day, 30-day, and 1-year fatality after ischemic stroke. Stroke 2008; 39: 2318-2324.
- 5. Hankey GJ. Long-term outcome after ischaemic stroke/transient ischaemic attack. Cerebrovasc Dis 2003; 16 Suppl 1: 14-19.
- 6. Bureau of Health Information. Healthcare in focus 2012. How well does NSW perform? Looking out and looking in. Annual performance report: December 2012. Sydney: BHI, 2012. http://www.bhi.nsw.gov.au/?a=177202 (accessed Sept 2016).
- 7. National Health Performance Authority. Towards public reporting of standardised hospital mortality in Australia: Progress report. Feb 2016. http://www.aihw.gov.au/WorkArea/DownloadAsset.aspx?id=60129555679 (accessed Sept 2016).
- 8. Cadilhac DA, Lannin NA, Anderson CS, et al. Protocol and pilot data for establishing the Australian Stroke Clinical Registry. Int J Stroke 2010; 5: 217-226.
- 9. Counsell C, Dennis M, McDowall M, Warlow C. Predicting outcome after acute and subacute stroke: development and validation of new prognostic models. Stroke 2002; 33: 1041-1047.
- 10. Cadilhac D, Kilkenny M, Churilov L, et al. Identification of a reliable subset of process indicators for clinical audit in stroke care: an example from Australia. Clinical Audit 2010; 2: 67-77.
- 11. Katzenellenbogen JM, Vos T, Somerford P, et al. Burden of stroke in indigenous Western Australians: a study using data linkage. Stroke 2011; 42: 1515-1521.
- 12. Dassanayake J, Gurrin L, Payne WR, et al. Is country of birth a risk factor for acute hospitalization for cardiovascular disease in Victoria, Australia? Asia Pac J Public Health 2011; 23: 280-287.
- 13. Kapral MK, Wang H, Mamdani M, Tu JV. Effect of socioeconomic status on treatment and mortality after stroke. Stroke 2002; 33: 268-273.
- 14. Australian Bureau of Statistics. 2033.0.55.001. Census of population and housing: Socio-Economic Indexes for Areas (SEIFA), Australia, 2011. http://www.abs.gov.au/ausstats/abs@.nsf/mf/2033.0.55.001 (accessed Sept 2016).
- 15. Hardie K, Hankey GJ, Jamrozik K, et al. Ten-year risk of first recurrent stroke and disability after first-ever stroke in the Perth Community Stroke Study. Stroke 2004; 35: 731-735.
- 16. Ali SF, Singhal AB, Viswanathan A, et al. Characteristics and outcomes among patients transferred to a regional comprehensive stroke center for tertiary care. Stroke 2013; 44: 3148-3153.
- 17. Fonarow GC, Smith EE, Reeves MJ, et al. Hospital-level variation in mortality and rehospitalization for Medicare beneficiaries with acute ischemic stroke. Stroke 2011; 42: 159-166.
- 18. Feigin VL, Lawes CM, Bennett DA, et al. Worldwide stroke incidence and early case fatality reported in 56 population-based studies: a systematic review. Lancet Neurol 2009; 8: 355-369.
- 19. Spiegelhalter DJ. Funnel plots for comparing institutional performance. Stat Med 2005; 24: 1185-1202.
- 20. McCormick N, Bhole V, Lacaille D, Avina-Zubieta JA. Validity of diagnostic codes for acute stroke in administrative databases: a systematic review. PLoS One 2015; 10: e0135834.
- 21. Appelros P, Jonsson F, Asberg S, et al. Trends in stroke treatment and outcome between 1995 and 2010: observations from Riks-Stroke, the Swedish stroke register. Cerebrovasc Dis 2014; 37: 22-29.
- 22. Preen DB, Holman CDAJ, Lawrence DM, et al. Hospital chart review provided more accurate comorbidity information than data from a general practitioner survey or an administrative database. J Clin Epidemiol 2004; 57: 1295-1304.
- 23. Fonarow GC, Pan W, Saver JL, et al. Comparison of 30-day mortality models for profiling hospital performance in acute ischemic stroke with vs without adjustment for stroke severity. JAMA 2012; 308: 257-264.
- 24. Sim J, Teece L, Dennis MS, et al. Validation and recalibration of two multivariable prognostic models for survival and independence in acute stroke. PLoS One 2016; 11: e0153527.
- 25. Xian Y, Holloway RG, Pan W, Peterson ED. Challenges in assessing hospital-level stroke mortality as a quality measure: comparison of ischemic, intracerebral hemorrhage, and total stroke mortality rates. Stroke 2012; 43: 1687-1690.
Velandai Srikanth
1. Phan TG, Clissold B, Ly J, Ma H, Moran C, Srikanth V, for the VISTA collaboration. Stroke severity and comorbidity index for prediction of mortality after ischemic stroke from the virtual international stroke trials archive-acute collaboration. Journal of Stroke and Cerebrovascular diseases : the official journal of National Stroke Association. 2016;25:835-842
2. Pencina MJ, D'Agostino RB, Sr., D'Agostino RB, Jr., Vasan RS. Evaluating the added predictive ability of a new marker: From area under the roc curve to reclassification and beyond. Stat Med. 2008;27:157-172; discussion 207-112
3. Phan TG, Clissold B, Ly J, Ma H, Srikanth V, for the Vista Collaboration. Predicting disability after ischemic stroke based on comorbidity index and stroke severity. Frontiers Neurology. 2017, in press; (doi: 10.3389/fneur.2017.00192)
Competing Interests: No relevant disclosures
Prof Velandai Srikanth
Peninsula Clinical School, Central Clinical School, Monash University, Melbourne, Victoria