


Health care-associated bloodstream infections (HA-BSIs) are a major threat to patient safety and impose substantial burdens on health care systems. It has been estimated that for every 100 hospital admissions there are two nosocomial BSIs.1 Crude mortality rates for patients with hospital-acquired BSIs were as high as 30% in the late 1990s,2,3 and were still about 15% in recent years.4 Survivors of BSIs can experience long term reductions in health.2 HA-BSIs are associated with extended lengths of hospital stay: an extra 10 days for central line-associated BSIs (CLABSIs)5 and 12 days for Staphylococcus aureus BSIs.4
In Australia, all hospitals are required to report S. aureus BSI rates to the National Health Performance Authority (NHPA),6 and intensive care units (ICUs) can voluntarily participate in the national CLABSI surveillance program of the Australian and New Zealand Intensive Care Society.7 The Australian Commission on Safety and Quality in Health Care has led national initiatives for preventing and controlling health care-associated infections, through new accreditation standards and initiatives in areas such as hand hygiene and antimicrobial stewardship.8
Published surveillance data have recorded reductions in certain subsets of BSIs in hospitals. For instance, the National Healthcare Safety Network (NHSN) in the United States found that CLABSI rates in ICUs had decreased from 3.64 to 1.65 per 1000 central line-days between 2001 and 2009.9 Mandatory surveillance data from England showed that methicillin-resistant S. aureus (MRSA) BSI rates dropped from 4.3 to 1.2 per 100 000 bed-days between 2008–09 and 2012–13.10 A more complete and contemporary understanding of the epidemiology of all BSIs acquired in hospital settings is needed to direct future hospital-based prevention activities.
In this article we report on the epidemiology and rates of all HA-BSIs and of specific subsets acquired in Queensland public hospitals, based on active surveillance data.
Methods
Study setting and population
The Centre for Healthcare Related Infection Surveillance and Prevention (CHRISP) initiated a standardised, computerised surveillance system for health care-associated infections in Queensland in 2001.11,12 Twenty-three medium to large public hospitals (85% of public hospital activity in Queensland) contributed HA-BSI surveillance data. Some of the data collected from 2001 to 2007 have already been reported.11 In this article we report our analysis of HA-BSI data for 2008–2012.
Health care-associated BSI surveillance data collection and classifications
CHRISP BSI surveillance definitions, adapted from those of the Centers for Disease Control and Prevention (CDC)/NHSN,13 have been used by all participating hospitals since 2001. In contrast to surveillance by the NHSN and in some Australian states, all episodes of BSI in adults (≥ 14 years old) in Queensland were subject to prospective surveillance by infection control practitioners.
Bloodstream infections
A positive blood culture was labelled a BSI if it met the NHSN laboratory-confirmed bloodstream infection (LCBI) definitions (criteria 1, 2 or 3).13 However, positive blood cultures related to an infection at another body site were also included, although these would be excluded by NHSN LCBI definitions. During the period about which we are reporting, older NHSN definitions14 were used for criteria 2 and 3 episodes (ie, a single positive culture for a common commensal organism was labelled a BSI if treatment had been initiated). Episodes within 14 days of the first episode involving the same organism were excluded.
Health care-associated bloodstream infections (HA-BSIs)
Episodes were classified as HA-BSIs if:
they were acquired during hospitalisation and were not present or incubating at the time of admission;
they were a complication of the presence of an in-dwelling medical device (eg, intravenous or urinary catheter);
they occurred within 30 days of a surgical procedure and were related to a surgical site infection (or within one year if associated with an implanted medical device);
an invasive instrumentation or incision related to the BSI had been performed no earlier than 48 hours before the onset of the infection; or
they were associated with neutropenia (< 1 × 10⁹/L) following cytotoxic therapy.
Place of acquisition
HA-BSIs were classified as inpatient infections if they occurred more than 48 hours after hospital admission or less than 48 hours after discharge. Other HA-BSIs were classified as non-inpatient infections, including episodes that would fall under the NHSN “present on admission” exclusion.15
Focus of infection
The focus of HA-BSIs was classified as one of the following:
Intravascular catheter (IVC)-associated BSI (IVC-BSI): an IVC was present within 48 hours of the episode, and the organisms were not related to an infection at another site. A subset were further defined as CLABSIs according to CDC/NHSN definitions.15
Organ site focus: clinical or microbiological evidence that the infection arose at a specific organ site. These episodes could be further categorised as associated with an in-dwelling medical device, a medical implant, or an invasive procedure.
Neutropenic sepsis: a BSI occurring in a patient with a neutrophil count of less than 1 × 10⁹/L (1000/mm3) following cytotoxic chemotherapy. In patients with neutropenia, a BSI was considered IVC-associated only if there was strong evidence that an IVC was the source of the BSI (eg, a positive catheter tip culture with the same organism or an infected insertion site).
Unknown focus.
Microbiology
Microbiological testing was standardised across sites and conducted by Pathology Queensland. Antimicrobial susceptibility was tested using Clinical and Laboratory Standards Institute (CLSI) methods until June 2012, after which European Committee on Antimicrobial Susceptibility Testing (EUCAST) methods were used.
Statistical analysis
Rates were only calculated for inpatient HA-BSIs, expressed as the number of BSI cases per 10 000 patient-days (overnight admissions), with 95% confidence intervals calculated for Poisson distributed counts. The overall HA-BSI inpatient rate was calculated, as were specific subset rates: inpatient IVC HA-BSIs, inpatient S. aureus HA-BSIs, and inpatient MRSA HA-BSIs. Non-inpatient HA-BSI rates were not calculated because of the lack of a suitable denominator. Pearson χ2 and Fisher exact tests were used to compare the differences in proportions between two groups, adjusted for multiple testing. Hospitals were categorised into peer groups using NHPA classifications.6 Data were analysed in Stata 12.1 (StataCorp).
Ethics approval
Ethics approval was granted by the Queensland Health Central Health and Medical Research Ethics Committee (reference HREC/13/QHC/14).
Results
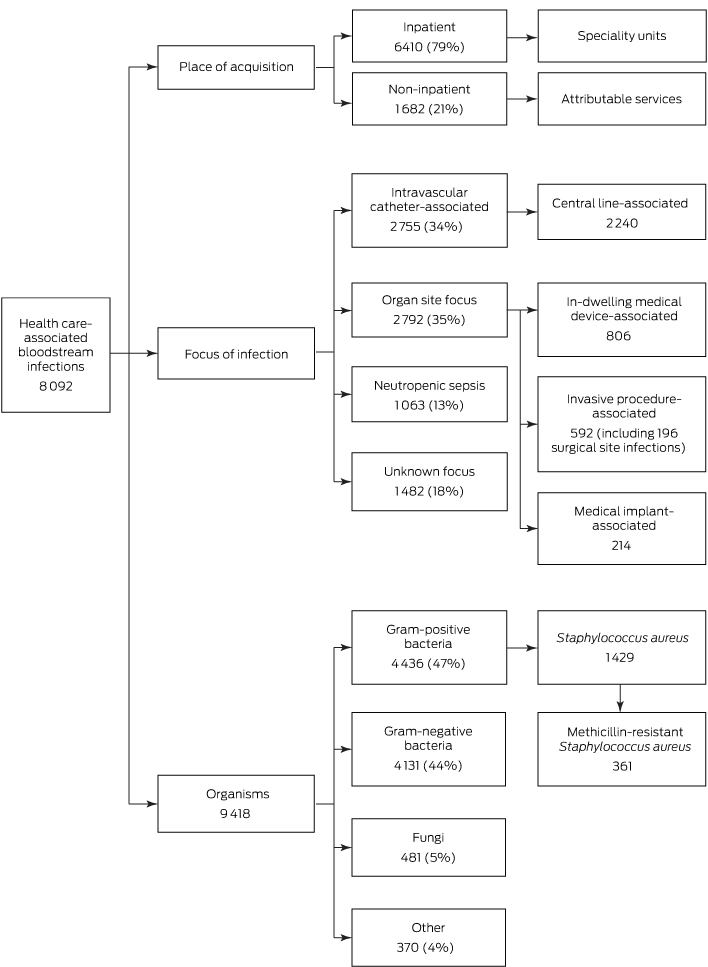
Twenty-three participating hospitals reported 8092 HA-BSIs and 9418 related organisms during 2008–2012 (Box 1); 60% of BSI cases involved males, and the median age of patients was 61 years (interquartile range, 47–71 years).
Place of acquisition
Of these HA-BSI episodes, 79% were inpatient health care-associated (Box 1); the majority (63%) were in patients in general medical, surgical, haematology, oncology and intensive care units (Box 2). Twenty-one percent of HA-BSI episodes were non-inpatient health care-associated BSIs, of which 77% were attributed to outpatient chemotherapy or same day admissions for haemodialysis (Box 2). The proportion of non-inpatient BSI episodes remained stable over time (data not shown).
Focus of infection
Thirty-five per cent of HA-BSIs (2792 episodes) had an organ focus, 34% an IVC-associated focus (2755 episodes), and 18% an unknown focus (1482 episodes); 13% involved neutropenic sepsis (1063 episodes) (Box 1).
The most common foci for HA-BSIs with an organ site focus were the urinary tract, intra-abdominal organs, respiratory tract, and skin and soft tissues (Appendix 1). Of the 2792 BSIs arising in specific organ sites, 806 (29%) were attributable to in-dwelling medical devices (the most common being urethral catheters [529 episodes], endotracheal tubes [78], and tracheostomy tubes [61]); 592 (21%) were attributable to invasive procedures (including 196 surgical site infections); and 214 (8%) were attributable to medical implants (the most common being permanent pacemakers [62], heart valves [48], and hip prostheses [16]).
The most common types of catheters associated with IVC-BSIs were peripherally inserted central venous catheters (37%), tunnelled/non-tunnelled central venous catheters (28%), and peripheral intravenous catheters (13%) (Appendix 2). Eighty-one per cent of IVC-BSIs were CLABSIs (2240 of 2755), but only 5% were attributable to ICUs (117 of 2240).
Organisms
Of the 9418 organisms reported, 47% were gram-positive bacteria, 44% were gram-negative bacteria, 5% were fungi, and 4% were other organisms (Box 1, Box 3).
Of 8092 HA-BSI episodes, 1429 (18%) were caused by S. aureus. The contribution of MRSA to S. aureus BSIs decreased from 29% in 2008 to 16% in 2012. Twenty-four per cent of S. aureus BSIs (344 of 1429) were acquired in non-inpatient settings. Compared with BSIs in non-neutropenic patients, BSIs in patients with neutropenia were less likely to be caused by S. aureus and Candida species, but more likely to be caused by E. coli (Box 3).
For HA-BSIs associated with IVCs, gram-positive bacteria accounted for 56% of pathogens, gram-negative bacteria for 33%, and fungi for 8%. The corresponding figures for HA-BSIs with an organ focus were 37%, 56%, and 5% respectively.
Inpatient health care-associated BSI rates
The total inpatient HA-BSI rate was 6.0 per 10 000 patient-days during 2008–2012 (Box 4). IVC-BSIs occurred at a rate of 1.9 per 10 000 patient-days. These figures were stable over time.
S. aureus BSIs occurred at a rate of 1.0 per 10 000 patient-days, including an MRSA BSI rate of 0.26 per 10 000 patient-days. Major hospitals with more vulnerable patients had higher S. aureus BSI rates than major hospitals with fewer vulnerable patients (1.34 per 10 000 v 0.82 per 10 000 patient-days). Although the total S. aureus BSI rate was stable over time, the MRSA BSI rate halved between 2008 (0.31 per 10 000) and 2012 (0.15 per 10 000 patient-days) (Box 4). There was no significant change in the rate of BSIs caused by gram-negative bacteria (2.78 per 10 000) or Enterobacteriaceae (1.97 per 10 000 patient-days) over time.
Non-inpatient health care-associated BSIs
Of 1682 non-inpatient HA-BSI episodes, 772 (46%) were IVC-BSIs, 431 (26%) involved neutropenic sepsis, 355 (21%) were organ site focus BSIs, and 124 (7%) had an unknown focus. Twenty per cent of non-inpatient HA-BSIs (344 of 1682) were caused by S. aureus.
Discussion
Our study provides important information on the epidemiology of all HA-BSIs, and is one of the few to be based on such complete data for multiple hospitals.16-19 Most HA-BSIs (79%) were associated with overnight inpatient stays in general medicine, general surgery, haematology, or oncology departments or in ICUs. However, a significant minority (21%) were acquired in outpatient or same day care settings, predominantly in haematology, oncology and haemodialysis units. About one-third of HA-BSIs were IVC-BSIs, mostly associated with central venous lines, but only 5% of CLABSIs were attributable to ICUs. S. aureus was responsible for 18% of HA-BSIs.
The inpatient HA-BSI rate in Queensland public hospitals (5.5–6.4 per 10 000 patient-days) was lower than reported in France (9.96–13.1 per 10 000 patient-days; 2005–2007),16 Italy (16 per 10 000 patient-days)19 or Taiwan (26.9–38.5 per 10 000 patient-days, 2000–2011).18 Although they involve differences in casemix and methodology, comparator studies18,19 and our study have each reported that 44–47% of all HA-BSIs were caused by gram-negative bacteria. Our further analysis indicated that gram-positive bacteria are the most common pathogens for primary HA-BSIs associated with IVCs; gram-negative bacteria are more frequently present in secondary HA-BSIs stemming from organ sites, such as urinary tract, intra-abdominal organ, respiratory tract or surgical site infections. This has implications for empiric therapy choice.
Our inpatient S. aureus BSI rate (1 per 10 000 patient-days) is comparable with data from England (0.9 per 10 000 bed-days)20 and with recently reported data from Victoria.21 In another Australian study of hospital-onset S. aureus BSIs (analogous to our inpatient health care-associated),22 there was a more marked decline in the S. aureus BSI rate over time, but the study started from a higher baseline at an earlier time point, and the hospitals assessed may have had a different casemix to ours. The decline in the contribution of MRSA to S. aureus BSIs mirrors what has been described elsewhere,21,22 possibly reflecting concurrent prevention strategies in hospitals (eg, improved catheter insertion and maintenance, hand hygiene programs, antimicrobial stewardship initiatives).21 During the financial year 2012–13, 1724 health care-associated S. aureus BSI cases were reported from Australian public hospitals.23 As S. aureus represented 18% of all HA-BSIs in our dataset, we estimate that about 10 000 HA-BSIs occur in Australian public hospitals each year.
One of the strengths of our surveillance system is the prospective inclusion of non-inpatient HA-BSI episodes that might otherwise have been discounted as present on admission or classified as community-onset infections. Non-inpatient episodes caused about 20% of HA-BSIs and one-quarter of all health care-associated S. aureus BSIs (consistent with other Australian data21); almost half were associated with IVCs. Non-inpatient episodes have the potential to play a more significant role as increasingly complex care is delivered in ambulatory settings.24 This suggests that non-inpatient episodes are worthy of surveillance and are a significant source of preventable HA-BSIs. Suitable denominators need to be determined; the majority of our episodes would be captured if divided into haemodialysis-associated events per same day admissions to haemodialysis, and neutropenic sepsis events per outpatient occasions of chemotherapy.
CLABSI rates are widely used performance metrics for assessing hospital care quality and patient safety. For example, hospitals in the US are required to submit CLABSI data to the NHSN, and financial reimbursement is linked to hospital-specific CLABSI rates.25 Eighty-one per cent of IVC-BSIs, or 28% of all HA-BSIs, were CLABSIs, but only 5% were contracted in ICUs. This emphasises the need to expand efforts to prevent CLABSIs outside the ICU. Further, for each IVC-BSI acquired in hospital there were two other HA-BSIs: this also has significant implications for prevention interventions.
The surveillance strategy in Queensland has had the benefit of classifying neutropenic sepsis separately from IVC-BSIs for more than a decade, but our definition is somewhat broader than the more recent NHSN mucosal barrier injury laboratory-confirmed bloodstream infection (MBI-LCBI) definition; based on the isolated organisms alone, about half of the episodes in our dataset classified as neutropenic sepsis would not meet the NHSN MBI-LCBI definition.15
Nevertheless, we identified clear differences in the microbiology of BSI cases with and without neutropenia. E. coli was a more common BSI pathogen in patients with neutropenic sepsis, while S. aureus and Candida species were less common. Customary antifungal prophylaxis in patients with neutropenia contributes to reducing the likelihood of BSIs caused by Candida species.26 Our findings support reporting MBI-LCBIs separately from CLABSIs and appropriately attributing the source of BSIs in patients with neutropenia to gastrointestinal translocation rather than IVCs.
Our surveillance data have some limitations. Firstly, although 23 medium to large hospitals (85% of public hospital activity in Queensland) participated in surveillance, our findings might not be applicable to the many small public hospitals in Queensland (more than 100). However, participating hospitals provided care for the most complex patients and those at greatest risk of health care-associated infections. Secondly, although local surveillance definitions were provided by Queensland Health to infection control practitioners, there was potential for variation between infection control practitioners and between hospitals in the application of these definitions. Thirdly, reports of coagulase-negative staphylococci were probably over-represented during the reporting period, as our surveillance used the older NHSN LCBI criterion 2 definition,14 which accepted a single positive culture for a common commensal organism as a BSI if treatment had been initiated.
Our data provide a broad overview of HA-BSIs, including the total burden, the relative contribution of CLABSIs, ICU CLABSIs and S. aureus BSIs in both the inpatient and ambulatory hospital care settings. It also illustrates the range of risks associated with HA-BSIs, each of which requires different prevention strategies. For instance, insertion bundles have proven benefits in preventing IVC-BSIs in the ICU setting. However, most of our CLABSIs occurred outside ICUs, where the benefit of insertion bundles is less certain; maintenance bundles may be more important in this setting. Peripherally inserted venous catheters also need attention, and, although attention to antisepsis is likely to be a key factor, the utility of insertion bundles in this regard is unknown. In contrast, prevention of secondary HA-BSIs associated with surgical site infections, implanted devices or procedures is probably best served by attending to modifiable factors, including appropriate antibiotic prophylaxis (when indicated) and antisepsis. Organ site focus infections not associated with surgery or procedures are less likely to be preventable, as are those associated with chemotherapy-induced neutropenia.
Box 1 – Distribution of health care-associated bloodstream infections reported by 23 Queensland public hospitals, 2008–2012
Box 2 – Distribution of health care-associated bloodstream infections in 23 Queensland public hospitals, 2008–2012, by place of acquisition
Place of acquisition |
Bloodstream infections |
||||||||||||||
Number |
% |
||||||||||||||
Inpatient acquisition: speciality units (total: 6410) | |||||||||||||||
General medicine |
1327 |
20.7% |
|||||||||||||
General surgery |
892 |
13.9% |
|||||||||||||
Haematology |
728 |
11.4% |
|||||||||||||
Oncology |
623 |
9.7% |
|||||||||||||
Intensive care |
473 |
7.4% |
|||||||||||||
Trauma and orthopaedic |
315 |
4.9% |
|||||||||||||
Neurosurgery |
221 |
3.5% |
|||||||||||||
Cardiology |
203 |
3.2% |
|||||||||||||
Gastroenterology |
194 |
3.0% |
|||||||||||||
Obstetrics |
174 |
2.7% |
|||||||||||||
Urology |
165 |
2.6% |
|||||||||||||
Cardiothoracic surgery |
160 |
2.5% |
|||||||||||||
Burns |
154 |
2.4% |
|||||||||||||
Nephrology |
140 |
2.2% |
|||||||||||||
Infectious disease |
91 |
1.4% |
|||||||||||||
Vascular |
89 |
1.4% |
|||||||||||||
Geriatric |
84 |
1.3% |
|||||||||||||
Respiratory medicine |
58 |
0.9% |
|||||||||||||
Neurology |
56 |
0.9% |
|||||||||||||
Rehabilitation |
53 |
0.8% |
|||||||||||||
Other |
210 |
3.3% |
|||||||||||||
Non-inpatient acquisition: attributable services (total: 1682) | |||||||||||||||
Haematology/oncology |
946 |
56.2% |
|||||||||||||
Haemodialysis |
352 |
20.9% |
|||||||||||||
Other ambulatory |
55 |
3.3% |
|||||||||||||
Home intravenous |
49 |
2.9% |
|||||||||||||
Day surgery |
29 |
1.7% |
|||||||||||||
Day therapy |
27 |
1.6% |
|||||||||||||
Peritoneal dialysis |
22 |
1.3% |
|||||||||||||
Other |
202 |
12.0% |
|||||||||||||
Box 3 – Organisms isolated in health care-associated bloodstream infections (HA-BSIs) of patients with and without neutropenia in 23 Queensland public hospitals, 2008–2012
Organism |
All HA-BSIs |
HA-BSIs in patients without neutropenia |
HA-BSIs in patients with neutropenia |
P |
|||||||||||
Number |
% |
Number |
% |
Number |
% |
||||||||||
Coagulase-negative staphylococci |
1731 |
18.4% |
1434 |
17.7% |
297 |
22.7% |
< 0.001* |
||||||||
Staphylococcus aureus |
1429 |
15.2% |
1391 |
17.2% |
38 |
2.9% |
< 0.001* |
||||||||
Methicillin-resistant S. aureus |
361 |
3.8% |
355 |
4.4% |
6 |
0.5% |
< 0.001* |
||||||||
Methicillin-susceptible S. aureus |
1068 |
11.4% |
1036 |
12.8% |
32 |
2.4% |
< 0.001* |
||||||||
Enterococcus spp |
639 |
6.8% |
578 |
7.1% |
61 |
4.7% |
0.001* |
||||||||
E. faecalis |
430 |
4.6% |
399 |
4.9% |
31 |
2.4% |
< 0.001* |
||||||||
E. faecium |
186 |
2.0% |
157 |
1.9% |
29 |
2.2% |
0.500 |
||||||||
Streptococcus spp |
384 |
4.1% |
278 |
3.4% |
106 |
8.1% |
< 0.001* |
||||||||
Enterobacteriaceae |
2817 |
29.9% |
2367 |
29.2% |
450 |
34.3% |
< 0.001* |
||||||||
Escherichia coli |
996 |
10.6% |
794 |
9.8% |
202 |
15.4% |
< 0.001* |
||||||||
Klebsiella pneumoniae/oxytoca |
762 |
8.1% |
624 |
7.7% |
138 |
10.5% |
< 0.001* |
||||||||
Enterobacter spp |
564 |
6.0% |
484 |
6.0% |
80 |
6.1% |
0.840 |
||||||||
Serratia marcescens |
234 |
2.5% |
226 |
2.8% |
8 |
0.6% |
< 0.001* |
||||||||
Citrobacter spp |
81 |
0.9% |
73 |
0.9% |
8 |
0.6% |
0.293 |
||||||||
Proteus mirabilis |
97 |
1.0% |
97 |
1.2% |
0 |
0 |
< 0.001* |
||||||||
Morganella morganii |
40 |
0.4% |
38 |
0.5% |
2 |
0.2% |
0.069 |
||||||||
Other |
43 |
0.4% |
31 |
0.4% |
12 |
0.8% |
0.008 |
||||||||
Pseudomonas spp |
844 |
9.0% |
686 |
8.5% |
158 |
12.1% |
< 0.001* |
||||||||
P. aeruginosa |
741 |
7.9% |
603 |
7.4% |
138 |
10.5% |
< 0.001* |
||||||||
Stenotrophomonas maltophilia |
152 |
1.6% |
133 |
1.6% |
19 |
1.5% |
0.615 |
||||||||
Acinetobacter spp |
129 |
1.4% |
123 |
1.5% |
6 |
0.5% |
0.002* |
||||||||
Candida spp |
480 |
5.1% |
468 |
5.8% |
12 |
0.9% |
< 0.001* |
||||||||
C. albicans |
231 |
2.5% |
223 |
2.8% |
8 |
0.6% |
< 0.001* |
||||||||
Other |
813 |
8.7% |
651 |
8.0% |
162 |
12.5% |
< 0.001* |
||||||||
Total number of organisms isolated |
9418 |
8109 |
1309 |
||||||||||||
* Statistically significant after adjusting for multiple testing (P < 0.0021 = 0.05/24). | |||||||||||||||
Box 4 – Inpatient health care-associated (HA) bloodstream infection (BSI) rates in 23 Queensland public hospitals, 2008–2012
Year |
Total patient-days* |
Inpatient HA-BSI |
Inpatient HA intravascular catheter-associated BSI |
Inpatient HA S. aureus BSI |
Inpatient HA methicillin-resistant S. aureus BSI |
||||||||||
Number |
Rate† (95% CI) |
Number |
Rate† (95% CI) |
Number |
Rate† (95% CI) |
Number |
Rate† (95% CI) |
||||||||
2008 |
2 068 590 |
1258 |
6.08 (5.75–6.43) |
364 |
1.76 (1.58–1.95) |
225 |
1.09 (0.95–1.24) |
65 |
0.31 (0.24–0.40) |
||||||
2009 |
2 111 899 |
1282 |
6.07 (5.74–6.41) |
391 |
1.85 (1.67–2.04) |
214 |
1.01 (0.88–1.16) |
68 |
0.32 (0.25–0.41) |
||||||
2010 |
2 158 752 |
1384 |
6.41 (6.08–6.76) |
464 |
2.15 (1.96–2.35) |
237 |
1.10 (0.96–1.25) |
73 |
0.34 (0.27–0.43) |
||||||
2011 |
2 181 920 |
1269 |
5.82 (5.50–6.15) |
374 |
1.71 (1.55–1.90) |
202 |
0.93 (0.80–1.06) |
41 |
0.19 (0.14–0.26) |
||||||
2012 |
2 212 986 |
1217 |
5.50 (5.20–5.82) |
390 |
1.76 (1.59–1.95) |
207 |
0.94 (0.81–1.07) |
34 |
0.15 (0.12–0.22) |
||||||
2008–2012 |
10 734 147 |
6410 |
5.97 (5.83–6.12) |
1983 |
1.85 (1.77–1.93) |
1085 |
1.01 (0.95–1.07) |
281 |
0.26 (0.23–0.29) |
||||||
* For those who stayed overnight or longer (same day discharges excluded). † Per 10 000 patient-days. | |||||||||||||||
Received 21 August 2015, accepted 12 January 2016
- Damin Si1
- Naomi Runnegar2,3
- John Marquess1
- Mohana Rajmokan1
- Elliott G Playford2,3
- 1 Communicable Diseases Branch, Queensland Health, Brisbane, QLD
- 2 Infection Management Services, Princess Alexandra Hospital, Brisbane, QLD
- 3 University of Queensland, Brisbane, QLD
We thank all infection control practitioners and teams from the participating hospitals who played a critical role in surveillance data collection, monitoring, feedback of results, and implementation of infection prevention and control programs. This work is supported by Queensland Health.
No relevant disclosures.
- 1. Al-Rawajfah OM, Stetzer F, Hewitt JB. Incidence of and risk factors for nosocomial bloodstream infections in adults in the United States, 2003. Infect Control Hosp Epidemiol 2009; 30: 1036-1044.
- 2. Cruickshank M, Ferguson J. Reducing harm to patients from health care associated infection: the role of surveillance. Canberra: Australian Commission on Safety and Quality in Health Care, 2008. http://www.safetyandquality.gov.au/wp-content/uploads/2008/01/Reducing-Harm-to-Patient-Role-of-Surveillance1.pdf
- 3. Wenzel RP, Edmond MB. The impact of hospital-acquired bloodstream infections. Emerg Infect Dis 2001; 7: 174-177.
- 4. Barnett AG, Page K, Campbell M, et al. The increased risks of death and extra lengths of hospital and ICU stay from hospital-acquired bloodstream infections: a case-control study. BMJ Open 2013; 3: e003587.
- 5. Zimlichman E, Henderson D, Tamir O, et al. Health care-associated infections: a meta-analysis of costs and financial impact on the US health care system. JAMA Intern Med 2013; 173: 2039-2046.
- 6. National Health Performance Authority. Compare hospitals [website]. Sydney: National Health Performance Authority. http://www.myhospitals.gov.au/compare-hospitals (accessed Oct 2014).
- 7. Australian and New Zealand Intensive Care Society. Central line associated blood stream infection (CLABSI) prevention [website]. http://www.anzics.com.au/Pages/CLABSI.aspx (accessed Nov 2014).
- 8. Australian Commission on Safety and Quality in Health Care. Healthcare associated infection. Sydney: ACSQHC, 2015. http://www.safetyandquality.gov.au/our-work/healthcare-associated-infection/ (accessed Nov 2015).
- 9. Srinivasan A, Wise M, Bell M, et al. Vital signs: central line-associated blood stream infections — United States, 2001, 2008, and 2009. MMWR Morb Mortal Wkly Rep 2011; 60: 243-248.
- 10. Public Health England. Annual counts and rates of meticillin resistant Staphylococcus aureus (MRSA) bacteraemia by acute trust and clinical commissioning group (CCG). https://www.gov.uk/government/statistics/mrsa-bacteraemia-annual-data (accessed June 2015).
- 11. Tong EN, Clements AC, Haynes MA, et al. Improved hospital-level risk adjustment for surveillance of healthcare-associated bloodstream infections: a retrospective cohort study. BMC Infect Dis 2009; 9: 145.
- 12. Morton AP, Clements AC, Doidge SR, et al. Surveillance of healthcare-acquired infections in Queensland, Australia: data and lessons from the first 5 years. Infect Control Hosp Epidemiol 2008; 29: 695-701.
- 13. Horan TC, Andrus M, Dudeck MA. CDC/NHSN surveillance definition of health care-associated infection and criteria for specific types of infections in the acute care setting. Am J Infect Control 2008; 36: 309-332.
- 14. Horan TC, Gaynes RP. Surveillance of nosocomial infections. In: Mayhall CG, editor. Hospital epidemiology and infection control. 3rd ed. Philadelphia: Lippincott Williams & Wilkins, 2004: pp 1659-1702.
- 15. CDC National Healthcare Safety Network. Bloodstream infection event (central line-associated bloodstream infection and non-central line-associated bloodstream infection). http://www.cdc.gov/nhsn/PDFs/pscManual/4PSC_CLABScurrent.pdf (accessed Nov 2014).
- 16. Bourneton O, Mutel T, Heranney D, et al. Incidence of hospital-acquired and community-acquired bloodstream infections in the University of Strasbourg Hospitals, France, between 2005 and 2007. Pathol Biol (Paris) 2010; 58: 29-34.
- 17. Aung AK, Skinner MJ, Lee FJ, Cheng AC. Changing epidemiology of bloodstream infection pathogens over time in adult non-specialty patients at an Australian tertiary hospital. Commun Dis Intell Q Rep 2012; 36: E333-E341.
- 18. Lai CC, Chen YH, Lin SH, et al. Changing aetiology of healthcare-associated bloodstream infections at three medical centres in Taiwan, 2000–2011. Epidemiol Infect 2014; 142: 2180-2185.
- 19. Luzzaro F, Ortisi G, Larosa M, et al. Prevalence and epidemiology of microbial pathogens causing bloodstream infections: results of the OASIS multicenter study. Diagn Microbiol Infect Dis 2011; 69: 363-369.
- 20. Public Health England. Annual epidemiological commentary: mandatory MRSA, MSSA and E. coli bacteraemia and C. difficile infection data, 2013/14. https://www.gov.uk/government/uploads/system/uploads/attachment_data/file/330529/HCAI_mandatory_surveillance_annual_epidemiological_commentary_2013_14.pdf (accessed Oct 2014).
- 21. Worth LJ, Spelman T, Bull AL, Richards MJ. Staphylococcus aureus bloodstream infection in Australian hospitals: findings from a Victorian surveillance system. Med J Aust 2014; 200: 282-284. <MJA full text>
- 22. Mitchell BG, Collignon PJ, McCann R, et al. A major reduction in hospital-onset Staphylococcus aureus bacteremia in Australia — 12 years of progress: an observational study. Clin Infect Dis 2014; 59: 969-975.
- 23. Australian Institute of Health and Welfare. Australian hospital statistics 2012–13: Staphylococcus aureus bacteraemia in Australian public hospitals. Canberra: AIHW, 2013. http://www.aihw.gov.au/WorkArea/DownloadAsset.aspx?id=60129545750 (accessed Feb 2014).
- 24. Lenz R, Leal JR, Church DL, et al. The distinct category of healthcare associated bloodstream infections. BMC Infect Dis 2012; 12: 85.
- 25. Centers for Medicare and Medicaid Services. Hospital compare: hospital-acquired condition reduction program [website]. https://www.medicare.gov/hospitalcompare/HAC-reduction-program.html (accessed Oct 2014).
- 26. See I, Iwamoto M, Allen-Bridson K, et al. Mucosal barrier injury laboratory-confirmed bloodstream infection: results from a field test of a new National Healthcare Safety Network definition. Infect Control Hosp Epidemiol 2013; 34: 769-776.
Abstract
Objective: To describe the epidemiology and rates of all health care-associated bloodstream infections (HA-BSIs) and of specific HA-BSI subsets in public hospitals in Queensland.
Design and setting: Standardised HA-BSI surveillance data were collected in 23 Queensland public hospitals, 2008–2012.
Main outcome measures: HA-BSIs were prospectively classified in terms of place of acquisition (inpatient, non-inpatient); focus of infection (intravascular catheter-associated, organ site focus, neutropenic sepsis, or unknown focus); and causative organisms. Inpatient HA-BSI rates (per 10 000 patient-days) were calculated.
Results: There were 8092 HA-BSIs and 9418 causative organisms reported. Inpatient HA-BSIs accounted for 79% of all cases. The focus of infection in 2792 cases (35%) was an organ site, intravascular catheters in 2755 (34%; including 2240 central line catheters), neutropenic sepsis in 1063 (13%), and unknown in 1482 (18%). Five per cent (117 of 2240) of central line-associated BSIs (CLABSIs) were attributable to intensive care units (ICUs). Eight groups of organisms provided 79% of causative agents: coagulase-negative staphylococci (18%), Staphylococcus aureus (15%), Escherichia coli (11%), Pseudomonas species (9%), Klebsiella pneumoniae/oxytoca (8%), Enterococcus species (7%), Enterobacter species (6%), and Candida species (5%). The overall inpatient HA-BSI rate was 6.0 per 10 000 patient-days. The rates for important BSI subsets included: intravascular catheter-associated BSIs, 1.9 per 10 000 patient-days; S. aureus BSIs, 1.0 per 10 000 patient-days; and methicillin-resistant S. aureus BSIs, 0.3 per 10 000 patient-days.
Conclusions: The rate of HA-BSIs in Queensland public hospitals is lower than reported by similar studies elsewhere. About one-third of HA-BSIs are attributable to intravascular catheters, predominantly central venous lines, but the vast majority of CLABSIs are contracted outside ICUs. Different sources of HA-BSIs require different prevention strategies.