


The Australian Sentinel Practices Research Network (ASPREN) is a network of sentinel general practitioners run through the Royal Australian College of General Practitioners and the University of Adelaide.1 It has collected de-identified information on influenza-like illness and other conditions seen in general practice across Australia since 1991. ASPREN GPs are distributed based on a target of one GP per Division of General Practice, or one GP per 200 000 population for metropolitan areas and one GP per 50 000 population for rural and remote areas. Previous evaluations of ASPREN suggest that it provides timely data on influenza-like illness (ILI), and rates consistent with those from other surveillance systems.2,3 Since 2009, GPs have collected specimens for influenza testing, allowing estimation of influenza vaccine effectiveness (VE). We estimated influenza vaccine coverage and effectiveness for the 2012 season.
Methods
Data were collected throughout 2012. A total of 275 GPs submitted data to ASPREN, of whom 110 submitted swabs. GPs are instructed to swab, at their discretion, roughly 25% of patients presenting with ILI (fever, cough and fatigue) and forward samples to SA Pathology for testing (see Appendix 1 for laboratory methods). GPs also collect demographic data (age, sex) and the year of most recent influenza vaccination. Patients provided written informed consent for a swab sample to be collected and for the results to be used for surveillance purposes. As data were de-identified and obtained in accordance with the National Health Security Act 2007 (Cwlth), human research ethics committee approval was not required.
Differences were compared by odds ratios, the χ2 test for categorical variables and the t test for continuous variables. All P values were two-sided. VE estimates were made using the test-negative design,4-6 where the exposure odds among patients testing positive by reverse transcription real-time polymerase chain reaction for influenza are compared with those for patients testing negative. We estimated crude VE as (1 − OR)*100% using logistic regression. Adjusted estimates controlled for age group (< 5, 5–17, 18–49, 50–64, ≥ 65 years), month of consultation and state or territory (random effect). VE was calculated for the epidemic period in each state or territory. Additionally, VE was estimated excluding patients who were negative for both influenza and non-influenza pathogens (pan-negative), as it has been suggested that this may reduce misascertainment bias due to false-negative influenza tests.7 All analyses were conducted in Stata version 12 (StataCorp).
Results
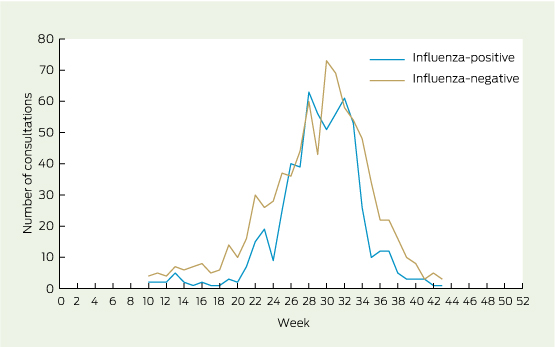
ASPREN GPs reported consultations for 5195 patients with ILI, of whom 1775 (34%) were swabbed. The earliest influenza cases were identified in New South Wales and Queensland, while Tasmania was the last to report a case (Appendix 2). Three-hundred and sixty-one samples were excluded: one was missing laboratory results; 121 were missing patient vaccination information; and four were missing the patient's date of birth. Patients without vaccination information were younger by 3.7 years (P = 0.04) but had a similar sex distribution to other patients (P = 0.4). Data were plotted to identify the epidemic period (Weeks 10–43 of 2012, see Appendix 2), excluding a further 235 patients. The final sample for VE estimates consisted of 1414 patients, including 593 (42%) who were influenza test-positive (Box 1).
Demographic and clinical characteristics are shown in Box 2. Vaccination coverage among test-negative patients was 27%. Coverage was highest among those aged ≥ 65 years (84%), 37% among patients aged 50–64 years, 18% among patients aged 18–49 years, 8% among patients aged 5–17 years and lowest among those aged under 5 years, at 3%. Antigenic characterisation was performed for 41 A(not H1) viruses, all of which were A(H3); 33 of these were A/Perth/16/2009-like viruses, the strain included in the 2010–2012 vaccines (Box 2). Closer examination indicated that four (50%) of the low-reacting viruses were obtained from vaccinated patients.
Crude and adjusted VE estimates are shown in Box 3. The overall crude VE was 33% (95% CI, 13% to 48%), which decreased to 23% (95% CI, − 4% to 43%) after adjusting for age group, month and state or territory. Adjusted VE estimates were higher for influenza B (53%; 95% CI, 5% to 77%) and lower for influenza A(not H1) (13%; 95% CI, − 20% to 36%). Age-stratified estimates indicated higher VE among older patients (67%; 95% CI, 23% to 86%), and point estimates of 12% for children (< 18 years) and working-age adults (18–64 years). Estimates changed little when pan-negative patients were excluded (Box 3).
Discussion
Our study showed low overall adjusted VE of 23% for the 2012 season. However, point estimates were higher against influenza B (53%) and lower against influenza A(not H1) (13%). If we assume, based on antigenic data, that the majority of A(not H1) viruses were A(H3), then it is unsurprising that this estimate was so low. For example, the 2011–12 estimate for A(H3) reported from Europe was 25% (95% CI, − 6% to 47%8), and the United Kingdom estimate was 23% (95% CI, − 10% to 47%9). Suboptimal VE against A(H3) has been partially attributed to poor match of the circulating strains to the vaccine.10-12 Indeed, the limited antigenic data available suggested four out of 10 vaccinated patients had viruses antigenically dissimilar to the vaccine strain. Moreover, the vaccine component for A(H3) was updated for the 2013 southern hemisphere season.13
A somewhat surprising finding of this study was the strong protective effect of the vaccine among older people. During the 2011–12 European season, VE for people ≥ 60 years was 15% (95% CI, − 33% to 46%), while for working-age adults (15–59 years) it was 63% (95% CI, 26% to 82%).8 This is in direct contrast with the estimates reported here of 12% (95% CI, − 22% to 36%) for working-age adults and 67% (95% CI, 23% to 86%) for older people. In Spain, VE has been observed to be high (85%; 95% CI, − 8% to 98%) for older patients presenting within 100 days of vaccination.14 Our data did not indicate earlier presentation after vaccination by older patients compared with younger patients and did not allow us to stratify by time since vaccination. In addition, we did not collect data on the presence of conditions predisposing to severe influenza, such as asthma, obesity and immunocompromising conditions. Failure to adjust for this important confounder15 may have accounted for the unexpected age effects.
Our study was limited by incomplete vaccination data on a number of patients. We were unable to exclude patients on the basis of presenting too soon after vaccination or too late after symptom onset,4,16,17 which may contribute to misclassification bias.
To overcome these limitations in future seasons, we have revised the data collection procedures for ASPREN GPs.
2 Characteristics of patients with an influenza-like illness who were recruited and swabbed by general practitioners in the Australian Sentinel Practices Research Network in 2012,* by state or territory†
Characteristic | Total | ACT | NSW | NT | Qld | SA | Tas | Vic | P‡ | ||||||
Population, 000s | 20 535.20 | 381.7 (2%) | 7381.1 (36%) | 237.8 (1%) | 4638.1 (23%) | 1667.5 (8%) | 512.9 (2%) | 5713.0 (28%) | |||||||
No. of patients | 1414 | 93 (7%) | 470 (33%) | 46 (3%) | 406 (29%) | 138 (10%) | 192 (14%) | 69 (5%) | |||||||
Sex | |||||||||||||||
Female | 704 (51%) | 59 (64%) | 214 (46%) | 22 (49%) | 194 (49%) | 73 (53%) | 107 (57%) | 35 (51%) | |||||||
Male | 689 (49%) | 33 (36%) | 248 (54%) | 23 (51%) | 205 (51%) | 65 (47%) | 81 (43%) | 34 (49%) | 0.03 | ||||||
Age group (years) | |||||||||||||||
< 5 | 115 (8%) | 7 (8%) | 43 (9%) | 4 (9%) | 31 (8%) | 14 (10%) | 11 (6%) | 5 (7%) | |||||||
5–17 | 231 (16%) | 11 (12%) | 90 (19%) | 10 (22%) | 70 (17%) | 17 (12%) | 22 (11%) | 11 (16%) | |||||||
18–49 | 688 (49%) | 61 (66%) | 188 (40%) | 26 (57%) | 211 (52%) | 64 (46%) | 104 (54%) | 34 (49%) | |||||||
50–64 | 238 (17%) | 4 (4%) | 97 (21%) | 5 (11%) | 55 (14%) | 27 (20%) | 36 (19%) | 14 (20%) | |||||||
≥ 65 | 142 (10%) | 10 (11%) | 52 (11%) | 1 (2%) | 39 (10%) | 16 (12%) | 19 (10%) | 5 (7%) | 0.002 | ||||||
Vaccination status | |||||||||||||||
Unvaccinated | 1080 (76%) | 67 (72%) | 370 (79%) | 40 (87%) | 331 (82%) | 92 (67%) | 128 (67%) | 52 (75%) | |||||||
Vaccinated | 334 (24%) | 26 (28%) | 100 (21%) | 6 (13%) | 75 (18%) | 46 (33%) | 64 (33%) | 17 (25%) | < 0.001 | ||||||
Influenza status | |||||||||||||||
Negative | 821 (58%) | 57 (61%) | 287 (61%) | 26 (57%) | 220 (54%) | 92 (67%) | 104 (54%) | 35 (51%) | |||||||
Positive | 593 (42%) | 36 (39%) | 183 (39%) | 20 (43%) | 186 (46%) | 46 (33%) | 88 (46%) | 34 (49%) | 0.07 | ||||||
A(H1)pdm09 | 8 (1%) | 0 (0) | 1 (0) | 3 (7%) | 1 (0) | 0 (0) | 0 (0) | 3 (4%) | |||||||
A(not H1) | 479 (34%) | 21 (23%) | 154 (33%) | 11 (24%) | 148 (36%) | 42 (30%) | 85 (44%) | 18 (26%) | |||||||
B | 106 (7%) | 15 (16%) | 28 (6%) | 6 (13%) | 37 (9%) | 4 (3%) | 3 (2%) | 13 (19%) | < 0.001 | ||||||
Non-influenza infection | |||||||||||||||
Negative | 1080 (76%) | 74 (80%) | 340 (72%) | 35 (76%) | 322 (79%) | 99 (72%) | 154 (80%) | 56 (81%) | |||||||
Positive | 334 (24%) | 19 (20%) | 130 (28%) | 11 (24%) | 84 (21%) | 39 (28%) | 38 (20%) | 13 (19%) | 0.1 | ||||||
HI result§ | (n = 74) | (n = 8) | (n = 32) | (n = 3) | (n = 16) | (n = 7) | (n = 3) | (n = 5) | |||||||
Not recovered (cell culture) | 32 (43%) | 3 (38%) | 13 (41%) | 1 (33%) | 12 (75%) | 0 (0) | 1 (33%) | 2 (40%) | |||||||
B/Brisbane/60/2008 low reactor | 1 (1%) | 0 (0) | 0 (0) | 0 (0) | 0 (0) | 1 (14%) | 0 (0) | 0 (0) | |||||||
A/Perth/16/2009-like | 33 (45%) | 3 (38%) | 17 (53%) | 2 (67%) | 4 (25%) | 4 (57%) | 1 (33%) | 2 (40%) | |||||||
A/Perth/16/2009 low reactor | 8 (11%) | 2 (25%) | 2 (6%) | 0 (0) | 0 (0) | 2 (29%) | 1 (33%) | 1 (20%) | 0.07 | ||||||
ACT = Australian Capital Territory. NSW = New South Wales. NT = Northern Territory. Qld = Queensland. SA = South Australia. Tas = Tasmania. Vic = Victoria. HI = Haemagglutination inhibition. * Values are number (% of total) unless otherwise indicated. † Excluding WA. ‡ P for the χ2 test comparing states. § HI assays were performed on a selection of viruses only. | |||||||||||||||
3 Estimates of vaccine effectiveness (VE) for 2012
Cases | Non-cases | VE estimate | |||||||||||||
No. | Vaccinated, no. (%) | No. | Vaccinated, no. (%) | Crude, % (95% CI) | Adjusted,* % (95% CI) | ||||||||||
Influenza-positive v influenza-negative | |||||||||||||||
Influenza A and B | 593 | 116 (20%) | 821 | 218 (27%) | 33% (13% to 48%) | 23% (− 4% to 43%) | |||||||||
Influenza A | 487 | 103 (21%) | 26% (3% to 43%) | 15% (− 17% to 38%) | |||||||||||
Influenza A(not H1) | 479 | 103 (22%) | 24% (1% to 42%) | 13% (− 20% to 36%) | |||||||||||
Influenza B | 106 | 13 (12%) | 61% (30% to 79%) | 53% (5% to 77%) | |||||||||||
Influenza-positive v non-influenza pathogen-positive | |||||||||||||||
Influenza A and B | 593 | 116 (20%) | 313 | 77 (25%) | 25% (− 3% to 46%) | 24% (− 12% to 49%) | |||||||||
Influenza A | 487 | 103 (21%) | 18% (− 15% to 41%) | 13% (− 32% to 42%) | |||||||||||
Influenza A(not H1) | 479 | 103 (22%) | 16% (− 18% to 40%) | 11% (− 34% to 41%) | |||||||||||
Influenza B | 106 | 13 (12%) | 57% (19% to 77%) | 56% (− 1% to 81%) | |||||||||||
VE for influenza A and B, stratified by age group | |||||||||||||||
Children (< 18 years) | 190 | 10 (5%) | 156 | 9 (6%) | 9% (− 129% to 64%) | 12% (− 125% to 66%) | |||||||||
Working-age adults (18–64 years) | 352 | 76 (22%) | 574 | 133 (23%) | 9% (− 26% to 34%) | 12% (− 22% to 36%) | |||||||||
Older people (≥ 65 years) | 51 | 30 (59%) | 91 | 76 (84%) | 72% (38% to 87%) | 67% (23% to 86%) | |||||||||
* Adjusted for age group (<18, 18–64, ≥ 65 years), month of consultation and state or territory (random effect). | |||||||||||||||
Received 23 January 2014, accepted 18 June 2014
- Sheena G Sullivan1
- Monique B-N Chilver2
- Geoff Higgins3
- Allen C Cheng4,5
- Nigel P Stocks2
- 1 WHO Collaborating Centre for Reference and Research on Influenza, Peter Doherty Institute for Infection and Immunity, Melbourne, VIC.
- 2 Discipline of General Practice, University of Adelaide, Adelaide, SA.
- 3 Microbiology and Infectious Diseases, SA Pathology, Adelaide, SA.
- 4 Department of Epidemiology and Preventive Medicine, Monash University, Melbourne, VIC.
- 5 Department of Infectious Diseases, Alfred Health, Melbourne, VIC.
We gratefully acknowledge all practices and GPs who participated in sentinel surveillance. We thank the laboratory staff of SA Pathology and the WHO Collaborating Centre for Reference and Research on Influenza (CCRRI). Thanks also to Daniel Blakeley for data management. ASPREN and the WHO CCRRI are funded by the Australian Government Department of Health.
No relevant disclosures.
- 1. Surveillance systems reported in CDI, 2011. Commun Dis Intell Q Rep 2011; 35: 55-59.
- 2. Clothier HJ, Fielding JE, Kelly HA. An evaluation of the Australian Sentinel Practice Research Network (ASPREN) surveillance for influenza-like illness. Commun Dis Intell Q Rep 2005; 29: 231-247.
- 3. Parrella A, Dalton CB, Pearce R, et al. ASPREN surveillance system for influenza-like illness. A comparison with FluTracking and the National Notifiable Diseases Surveillance System. Aust Fam Physician 2009; 38: 932-936.
- 4. Jackson ML, Nelson JC. The test-negative design for estimating influenza vaccine effectiveness. Vaccine 2013; 31: 2165-2168.
- 5. Orenstein EW, De Serres G, Haber MJ, et al. Methodologic issues regarding the use of three observational study designs to assess influenza vaccine effectiveness. Int J Epidemiol 2007; 36: 623-631.
- 6. Skowronski D, Gilbert M, Tweed S, et al. Effectiveness of vaccine against medical consultation due to laboratory-confirmed influenza: results from a sentinel physician pilot project in British Columbia, 2004–2005. Can Commun Dis Rep 2005; 31: 181-191.
- 7. Kelly H, Grant K. Interim analysis of pandemic influenza (H1N1) 2009 in Australia: surveillance trends, age of infection and effectiveness of seasonal vaccination. Euro Surveill 2009; 14. pii: 19288.
- 8. Kissling E, Valenciano M, Larrauri A, et al. Low and decreasing vaccine effectiveness against influenza A(H3) in 2011/12 among vaccination target groups in Europe: results from the I-MOVE multicentre case-control study. Euro Surveill 2013; 18. pii: 20390.
- 9. Pebody R, Andrews N, McMenamin J, et al. Vaccine effectiveness of 2011/12 trivalent seasonal influenza vaccine in preventing laboratory-confirmed influenza in primary care in the United Kingdom: evidence of waning intra-seasonal protection. Euro Surveill 2013; 18. pii: 20389.
- 10. Skowronski DM, Janjua NZ, Sabaiduc S, et al. Influenza A/subtype and B/lineage effectiveness estimates for the 2011-12 trivalent vaccine: cross-season and cross-lineage protection with unchanged vaccine. J Infect Dis 2014; Apr 1 [Epub ahead of print].
- 11. Sullivan SG, Komadina N, Grant K, et al. Influenza vaccine effectiveness during the 2012 influenza season in Victoria, Australia: Influences of waning immunity and vaccine match. J Med Virol 2014; 86: 1017-1025.
- 12. Tricco AC, Chit A, Soobiah C, et al. Comparing influenza vaccine efficacy against mismatched and matched strains: a systematic review and meta-analysis. BMC Med 2013; 11: 153.
- 13. World Health Organization. WHO consultation and information meeting on the composition of influenza virus vaccines for the southern hemisphere 2013. Geneva: World Health Organization, 2013. http://www.who.int/influenza/vaccines/virus/recommendations/consultation201209/en (accessed Mar 2013).
- 14. Castilla J, Martinez-Baz I, Martinez-Artola V, et al. Decline in influenza vaccine effectiveness with time after vaccination, Navarre, Spain, season 2011/12. Euro Surveill 2013; 18. pii: 20388.
- 15. Valenciano M, Ciancio B, Moren A. First steps in the design of a system to monitor vaccine effectiveness during seasonal and pandemic influenza in EU/EEA member states. Euro Surveill 2008; 13. pii: 19015.
- 16. Carrat F, Vergu E, Ferguson NM, et al. Time lines of infection and disease in human influenza: a review of volunteer challenge studies. Am J Epidemiol 2008; 167: 775-785.
- 17. Foppa IM, Haber M, Ferdinands JM, Shay DK. The case test-negative design for studies of the effectiveness of influenza vaccine. Vaccine 2013; 31: 3104-3109.
Abstract
Objective: To estimate influenza vaccine coverage and effectiveness against medically attended laboratory-confirmed influenza for the 2012 season.
Design, setting and participants: Test-negative design involving patients recruited as part of the Australian Sentinel Practices Research Network, a network of sentinel general practitioners throughout Australia. Throughout 2012, at the discretion of the GP at one of 102 participating practices, patients presenting with influenza-like illness were swabbed and included in the study.
Main outcome measure: Influenza vaccine effectiveness (VE) estimated as (1 − OR)*100% by logistic regression.
Results: 1775 patients were swabbed. The epidemic period was identified as Weeks 10 to 43 of 2012. After exclusions, there were 1414 patients for the VE analysis, including 593 (42%) who tested influenza-positive and 821 who tested negative. 27% of test-negative patients were vaccinated, of whom most were aged 50 years and over. The overall VE, adjusted for age group, month of presentation and state or territory, was 23% (95% CI, − 4% to 43%) against all influenza types, 15% (95% CI, − 17% to 38%) against influenza A, 13% (95% CI, − 20% to 36%) against influenza A(not H1) and 53% (95% CI, 5% to 77%) against influenza B.
Conclusion: Vaccination against influenza was modestly protective, reducing the risk of medical presentation with influenza by around 23%.