


Assisted reproductive technology (ART), such as in-vitro fertilisation (IVF), is now mainstream therapy for infertility, with an estimated 4.3 million children conceived by ART having been born worldwide over the past three decades.1 At current levels of ART activity in Australia, 3.3% of children, or almost one child in every Australian classroom, is born as a result of ART treatment.2
Arguably, the greatest challenge facing ART treatment worldwide is the high rate of twin and triplet births resulting from the transfer of multiple embryos. Multiple births are associated with significantly increased risks for both mothers and babies, including pregnancy and delivery complications, preterm birth, long-term disability, and death.3-5 Australia has been a world leader in reducing the incidence of ART multiple births through a voluntary shift to single embryo transfer (SET).
This reduction in the number of embryos transferred in Australia has occurred against a backdrop of supportive public funding of ART over the past decade, through the Medicare Benefits Schedule (MBS) and the Pharmaceutical Benefits Scheme (PBS). Since 2000, couples have been eligible for partial reimbursement of an unlimited number of ART cycles without restrictions on parental age or numbers of previous treatment attempts or existing children. The most significant change to funding of ART in the past decade was the introduction of the Extended Medicare Safety Net (EMSN) in 2004, which reimburses 80% of out-of-pocket expenses for out-of-hospital Medicare services once an annual threshold is reached. This policy effectively reduced out-of-pocket expenses for ART patients to about 20% of the cost of an ART cycle.6,7
The costs of caring for mothers and their babies born as a result of ART treatment were sourced from a previously published study on the inpatient birth-admission costs of ART births in Australia in 2003.8 The hospital costs were limited to the cost of the initial birth admission, defined as the inpatient admission for a birth event until the first separation.
We made several adjustments to the hospital admission costs to reflect only the contribution of government funding. First, data from the Australian Institute of Health and Welfare National Perinatal Data Collection were used to stratify singleton, twin and triplet birth admissions, based on hospital sector and elected accommodation status, into i) publicly funded patients, ii) privately funded patients in public hospitals, and iii) privately funded patients in private hospitals. Second, the weighted average birth-admission costs of the latter two patient categories were adjusted by 40% and 35% of the cost, respectively, to reflect the government contribution to funding.9 The resulting weighted average maternal and infant birth-admission costs from a government perspective in the 2003–04 financial year were $6295 for singleton births, $17 058 for twin births and $75 921 for triplet births. These costs were indexed to the year in which they were incurred using the Consumer Price Index “health” group.10
Data from Medicare Australia (http://www.medicareaustralia.gov.au/provider/medicare/mbs.jsp) on annual service counts and benefits paid for MBS items 13200 (ART service), 13209 (planning and management of ART treatment), 13212 (oocyte retrieval), 13215 (fresh embryo transfer), 13218 (frozen/thawed embryo transfer cycle), 13221 (semen preparation) and 13251 (intracytoplasmic sperm injection) were used to calculate the average Medicare benefits for one ART treatment program (comprising one fresh embryo transfer cycle plus one frozen/thawed embryo transfer cycle). These benefits included those paid through the EMSN. With the addition of the estimated cost of PBS drugs used during treatment, the average cost to Medicare for one treatment program ranged from $3865 in 2003 to $7488 in 2008.
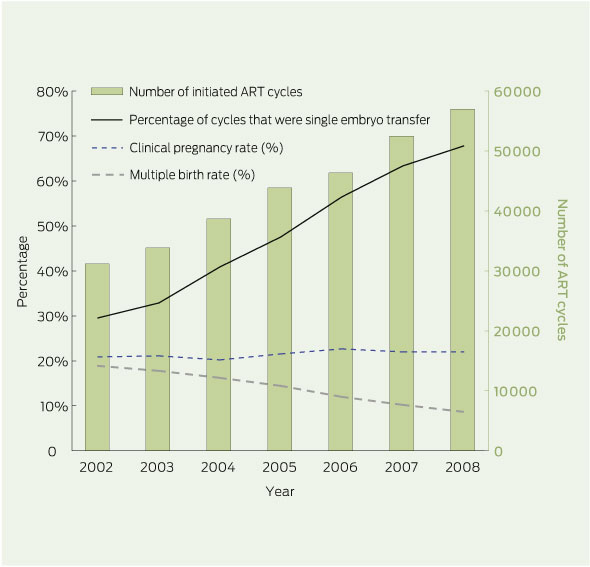
ANZARD data showed that the number of initiated ART treatments in Australia increased by over 10% per year on average since 2002, from around 31 000 to almost 57 000 cycles in 2008 (Box 1). There was a similar increase in the number of live-born infants following ART treatment, from 5863 in 2002 to 10 341 in 2008. The rate of multiple births following ART treatment where embryos were transferred decreased by 54% between 2002 and 2008, from 18.8% to 8.6% of ART births, primarily due to an increase in SET cycles from 29.5% to 67.7% of embryo transfer cycles over the same period. This substantial decrease in the multiple birth rate was achieved while clinical pregnancy rates remained stable at around 22% per cycle (Box 1).
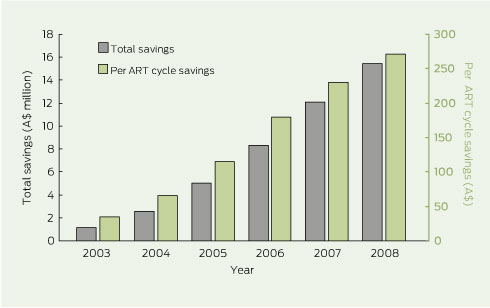
The inputs and results of the costing model are shown in Box 2 and Box 3. Subtracting the hospital costs associated with the observed number of births from the costs associated with the adjusted number of births (adjusted to 2002 multiple birth rates) in each year generated cost savings to government of $47.6 million (in 2008 dollars) over the 6 years. In effect, the indirect cost of an initiated ART cycle, relative to 2002, was reduced on average by $35 in 2003 and up to $271 in 2008 due to savings in birth-admission costs alone.
The decrease in the ART multiple birth rate in Australia between 2002 and 2008 resulted in estimated savings to federal and state governments of $47.6 million in birth-admission costs alone. This means that 55% of the growth in ART services since 2002 was funded by means of the savings achieved through the greater use of SET and reduction in multiple birth infants. Despite a big increase in ART use, the contribution of ART to the total number of twins born in Australia remains small and, indeed, has fallen from 22% in 2002 to 17% in 2008.11,12
The savings identified here were based only on the initial birth admission and therefore significantly underestimate the long-term health care costs associated with caring for multiple birth infants. Even after the initial birth admission, twins and triplets are 3.9 and 10.6 times more likely, respectively, to be transferred to another hospital than singleton infants.8 Therefore, it is likely that even the average cost of the birth episode has been underestimated in our study. Multiple births also continue to generate higher long-term medical, education and social services costs than singleton births.13-15 This has persuaded several jurisdictions, such as Belgium, Sweden and Quebec, to provide public funding for ART, thereby encouraging safer embryo transfer practices and leading to reduced multiple birth rates.16-18
The reduction in multiple births has primarily occurred as a result of a voluntary shift to use of SET. The Fertility Society of Australia Reproductive Technology Accreditation Committee’s code of practice requires fertility clinics to limit the numbers of embryos that should be transferred,19 but there is no legislation enforcing these guidelines. Similarly, the number of embryos transferred is not linked to government funding, which is a model adopted by some countries to reduce multiple birth rates.20
There is still significant variation in the uptake of SET around the world. With a SET rate of 67.7% and an ART multiple birth rate of 8.6% in 2008, Australia is a world leader in safe embryo transfer practices. By comparison, the United Kingdom and United States report SET rates for fresh embryo transfer cycles of only 11.6% in each country and multiple birth rates of 23.1% and 31.4%, respectively. The difference in the proportion of fresh embryo transfer cycles with three or more embryos transferred is also striking, with rates of 40.4% in the US and 4.8% in the UK, compared with 0.6% in Australia.21,22
The reasons for differences in embryo transfer practices between countries are multifactorial. However, studies from the US and Europe consistently show that higher financial support of ART, either through public or private insurance, is associated with low numbers of embryos transferred during treatment and thus lower multiple birth rates.23-27 Where treatment is unaffordable — through high treatment costs and/or lack of government subsidisation — there is a financial incentive for ART patients to achieve pregnancy in a limited number of cycles. In the US in 2006, one standard fresh IVF cycle equated to 44% of an individual’s annual disposable income, compared with 25% in the UK and 6% in Australia.7 While these variations exert pressure on both ART patients and fertility specialists to transfer two or more embryos in one cycle, one fresh SET cycle followed by one frozen/thawed SET cycle provides live-birth rates comparable to those associated with double embryo transfer.28
Despite the health risks involved for both mothers and babies, a substantial proportion of couples desire multiple births as an outcome of ART treatment.29,30 It is therefore important that policymakers are aware of how changes to ART funding affect access to treatment and clinical practice, and ultimately the health of children born following ART. Although it is the couple who undergo ART treatment in their desire to have a child, it is the children who are most at risk of the adverse sequelae associated with multiple gestation pregnancy. Clearly, it is also false economy to restrict funding for ART, which only accounts for 0.25% of health care expenditure in Australia,6,7 if it results in higher downstream costs of caring for multiple birth children. In Australia, the EMSN was revised in January 2010 to cap benefits paid to patients for selected Medicare items, including all ART services. The impact of this change on SET and multiple birth rates is yet to be seen.
2 Costing model of government savings in birth-admission costs due to reduction in assisted reproductive technology (ART) multiple births in Australia, 2002–2008
Received 13 December 2010, accepted 9 June 2011
- Georgina M Chambers1
- Peter J Illingworth2,3
- Elizabeth A Sullivan1
- 1 Perinatal and Reproductive Epidemiology Research Unit, School of Women’s and Children’s Health, University of New South Wales, Sydney, NSW.
- 2 Westmead Clinical School, University of Sydney, Sydney, NSW.
- 3 IVFAustralia, Sydney, NSW.
Georgina Chambers is an Australian Research Council (ARC) Postdoctoral Research Fellow funded through an ARC Linkage Grant (LP 100200165). The ARC partner organisations are IVFAustralia, Melbourne IVF and Queensland Fertility Group (Virtus Health). Peter Illingworth is a shareholder of Virtus Health and Medical Director of IVFAustralia.
- 1. European Society of Human Reproduction and Embryology. EIM Consortium. Focus on Reproduction 2010; (Sep): 17. http://www.eshre.eu/binarydata.aspx?type=doc&sessionId=l32czevvuk1dwrrydg1c4p3m/Eshre_Sep_2010.pdf (accessed Sep 2011).
- 2. Wang YA, Chambers GM, Sullivan EA. Assisted reproductive technology in Australia and New Zealand 2008. Canberra: AIHW, 2010. (AIHW Cat. No. PER 49.)
- 3. Elster N; Institute for Science, Law, and Technology Working Group on Reproductive Technology. Less is more: the risks of multiple births. Fertil Steril 2000; 74: 617-623.
- 4. Crosignani PG, Rubin BL; European Society of Human Reproduction and Embryology (ESHRE) Capri Workshop Group. Multiple gestation pregnancy. Hum Reprod 2000; 15: 1856-1864.
- 5. Helmerhorst FM, Perquin DAM, Donker D, Keirse MJNC. Perinatal outcome of singletons and twins after assisted conception: a systematic review of controlled studies. BMJ 2004; 328: 261.
- 6. Chambers GM, Ho MT, Sullivan EA. Assisted reproductive technology treatment costs of a live birth: an age-stratified cost-outcome study of treatment in Australia. Med J Aust 2006; 184: 155-158. <MJA full text>
- 7. Chambers GM, Sullivan EA, Ishihara O, et al. The economic impact of assisted reproductive technology: a review of selected developed countries. Fertil Steril 2009; 91: 2281-2294.
- 8. Chambers GM, Chapman MG, Grayson N, et al. Babies born after ART treatment cost more than non-ART babies: a cost analysis of inpatient birth-admission costs of singleton and multiple gestation pregnancies. Hum Reprod 2007; 22: 3108-3115.
- 9. Australian Institute of Health and Welfare. Funding sources for admitted patients in Australian hospitals, 2005–06. Canberra: AIHW, 2009. (AIHW Cat. No. HWE 44.)
- 10. Australian Bureau of Statistics. Consumer Price Index, Australia. Canberra: ABS. (ABS Cat. No. 6401.0.) http://www.abs.gov.au (accessed Aug 2011).
- 11. Laws PJ, Sullivan EA. Australia’s mothers and babies 2002. Sydney: AIHW National Perinatal Statistics Unit, 2004. (AIHW Cat. No. PER 28; Perinatal statistics series no. 15.)
- 12. Laws PJ, Li Z, Sullivan EA. Australia’s mothers and babies 2008. Canberra: AIHW, 2010. (AIHW Cat. No. PER 50; Perinatal statistics series no. 24.)
- 13. Henderson J, Hockley C, Petrou S, et al. Economic implications of multiple births: inpatient hospital costs in the first 5 years of life. Arch Dis Child Fetal Neonatal Ed 2004; 89: F542-F545.
- 14. Petrou S, Sach T, Davidson L. The long-term costs of preterm birth and low birth weight: results of a systematic review. Child Care Health Dev 2001; 27: 97-115.
- 15. Stevenson RC, McCabe CJ, Pharoah PO, Cooke RW. Cost of care for a geographically determined population of low birthweight infants to age 8-9 years. I. Children without disability. Arch Dis Child Fetal Neonatal Ed 1996; 74: F114-F117.
- 16. Gordts S, Campo R, Puttemans P, et al. Belgian legislation and the effect of elective single embryo transfer on IVF outcome. Reprod Biomed Online 2005; 10: 436-441.
- 17. Karlström PO, Bergh C. Reducing the number of embryos transferred in Sweden-impact on delivery and multiple birth rates. Hum Reprod 2007; 22: 2202-2207.
- 18. Min JK, Hughes E, Young D, et al; Joint Society of Obstetricians and Gynaecologists of Canada-Canadian Fertility and Andrology Society Clinical Practice Guidelines Committee. Elective single embryo transfer following in vitro fertilization. J Obstet Gynaecol Can 2010; 32: 363-377.
- 19. Fertility Society of Australia Reproductive Technology Accreditation Committee. Code of practice for assisted reproductive technology units (revised October 2010). Melbourne: FSA, 2010. http://www.fertilitysociety.com.au/wp-content/uploads/201011201-final-rtac-cop.pdf (accessed Sep 2011).
- 20. Maheshwari A, Griffiths S, Bhattacharya S. Global variations in the uptake of single embryo transfer. Hum Reprod Update 2011; 17: 107-120.
- 21. Centers for Disease Control and Prevention, American Society for Reproductive Medicine, Society for Assisted Reproductive Technology. 2007 Assisted reproductive technology success rates: national summary and fertility clinic reports. Atlanta: US Department of Health and Human Services, CDC, 2009.
- 22. de Mouzon J, Goossens V, Bhattacharya S, et al. Assisted reproductive technology in Europe, 2006: results generated from European registers by ESHRE. Hum Reprod 2010; 25: 1851-1862.
- 23. Henne MB, Bundorf MK. Insurance mandates and trends in infertility treatments. Fertil Steril 2008; 89: 66-73.
- 24. Jain T, Harlow BL, Hornstein MD. Insurance coverage and outcomes of in vitro fertilization. N Engl J Med 2002; 347: 661-666.
- 25. Martin JR, Bromer JG, Sakkas D, Patrizio P. Insurance coverage and in vitro fertilization outcomes: a US perspective. Fertil Steril 2011; 95: 964-969.
- 26. Reynolds MA, Schieve LA, Jeng G, Peterson HB. Does insurance coverage decrease the risk for multiple births associated with assisted reproductive technology? Fertil Steril 2003; 80: 16-23.
- 27. Stillman RJ, Richter KS, Banks NK, Graham JR. Elective single embryo transfer: a 6-year progressive implementation of 784 single blastocyst transfers and the influence of payment method on patient choice. Fertil Steril 2009; 92: 1895-1906.
- 28. Pandian Z, Bhattacharya S, Ozturk O, et al. Number of embryos for transfer following in-vitro fertilisation or intra-cytoplasmic sperm injection. Cochrane Database Syst Rev 2009; (2): CD003416.
- 29. Murray S, Shetty A, Rattray A, et al. A randomized comparison of alternative methods of information provision on the acceptability of elective single embryo transfer. Hum Reprod 2004; 19: 911-916.
- 30. Ryan GL, Zhang SH, Dokras A, et al. The desire of infertile patients for multiple births. Fertil Steril 2004; 81: 500-504.
Abstract
Objectives: To calculate cost savings to the Australian federal and state governments from the reduction in twin and triplet birth rates for infants conceived by assisted reproductive technology (ART) since 2002, and to determine the number of ART treatment programs theoretically funded by means of these savings.
Design and setting: Costing model using data from the Australia and New Zealand Assisted Reproduction Database, the National Perinatal Data Collection and Medicare Australia on ART treatment cycles undertaken in Australia between 2002 and 2008.
Main outcome measures: Annual savings in maternal and infant inpatient birth-admission costs resulting from the reduction in ART multiple birth rate; theoretical number of ART treatment programs funded and infants born by means of these savings.
Results: The reduction in the ART multiple birth rate from 18.8% in 2002 to 8.6% in 2008 resulted in estimated savings to government of $47.6 million in birth-admission costs alone. Theoretically, these savings funded 7042 ART treatment programs comprising one fresh plus one frozen embryo transfer cycle, equating to the birth of 2841 babies. Fifty-five per cent of the increased use of ART services since 2002 has been theoretically funded by the reduction in multiple birth infants.
Conclusions: Against a backdrop of supportive public funding of ART in Australia, a voluntary shift to single embryo transfer by fertility clinicians and ART patients has resulted in substantial savings in hospital costs. Much of the growth in ART use has been theoretically cross-subsidised by the move to safer embryo transfer practices.