




Research letter
Open access CC BY NC ND
Volume 220 - Issue 8
Pharmaceutical company payments to Australian doctors reported to Medicines Australia, 2019–22: a cross‐sectional analysis
Authors: Malcolm Forbes, Yeshna Bhowon and Barbara Mintzes
Med J Aust 2024; 220 (8): 425-427. || doi: 10.5694/mja2.52284
Published online: 6 May 2024
Published online: 6 May 2024
Greater transparency is needed, and linkage with AHPRA numbers would facilitate the identification of individual recipients
To promote their products, pharmaceutical companies make payments to doctors and other health care professionals, typically as consultancy fees, sponsorship to attend educational events, and the coverage of travel, accommodation, and other hospitality expenses.1 Until recently, disclosure of the details of such payments was limited. In 2016, the industry body that represents most pharmaceutical companies, Medicines Australia, published a revised code of conduct2 that required its members to provide lists of all doctors to whom they provided payments and the amounts provided. A searchable centralised repository that enables finding information about individual doctors, proposed in 2017,3 has been available on the Medicines Australia website since 2019 (www.disclosureaustralia.com.au). Lists of payments by Medicines Australia member companies for registration fees, travel costs, and fees for service, including grants and in‐kind support, but not payments for food or beverages or research, are published online every six months and remain available for three years.1
We examined the most recent three years of published data available (1 November 2019 – 31 October 2022), downloaded on 7 June 2023 and cleaned in R 4.3.0 (R Foundation for Statistical Computing). For each payment, we extracted the date of the event or provision of service, the name and principal practice address of the health care professional, a description of the service or event, and the amount of the payment or transfer of value (cash or an in‐kind contribution, made directly or via an intermediary). Each doctor was matched by name and practice address with their Australian Health Practitioner Regulation Agency (AHPRA) listing (https://www.ahpra.gov.au/Registration/Registers‐of‐Practitioners.aspx), and their specialty and gender were recorded (further details: Supporting Information). The numbers of practitioners in each specialty at the midpoint of the study period were obtained from the AHPRA 2020–21 annual report.4 The requirement for formal ethics approval of our study was waived by the University of Melbourne Human Research Ethics Committee.
A total of 6504 doctors (4.9% of all medical practitioners registered in Australia; 4086 men, 63%) had received at least one payment or transfer of value from pharmaceutical companies for registration fees, travel costs, or fees for service during November 2019 – October 2022. A total $33.44 million was paid or transferred; payments ranged from $36 to $299161, and the median payment was $1500 (interquartile range, $727 to $4000). We report the total payments for the ten specialties receiving the largest total payments, together with the median payments to doctors in these specialties, in Box 1. Total payments were highest for haematology or oncology ($6133645), cardiology ($3684307), and endocrinology ($2815058). The specialty with the largest proportion of doctors who received payments was rheumatology (Box 2). The specialties with the lowest proportions of doctors to receive payments were neurosurgery (0.35%), emergency medicine (0.45%), and medical administration (0.84%). The total amounts paid were highest for Novartis ($3674856), AstraZeneca ($2611668) and Bayer ($2511180) (Box 3).
As Medicines Australia does not represent all pharmaceutical companies active in Australia, we have probably underestimated pharmaceutical company payments to doctors. Further, payments for food and beverages, excluded by Medicines Australia reporting requirements, were offered at more than 90% of industry‐sponsored events in Australia during 2011–2015.5 In the United States, where these payments are included in pharmaceutical company transparency reports, clear relationships have been noted between the numbers of meals provided and the prescribing of a sponsor's products for four drug classes,6 as well as the volume of opioid prescribing.7
A 2021 systematic review (36 studies) found a consistent association between pharmaceutical payments and prescribing patterns; the authors noted a probable causal relationship.8 United States evidence suggests that pharmaceutical companies target highly connected physicians to achieve spillover effects; that is, increased prescribing by the peers of payment recipients.9 The high cost of new medicines has been a source of concern, particularly in haematology and oncology, and our finding that doctors in this specialty received the highest total amount of payments may have implications for health care costs.
Public awareness that pharmaceutical companies make payments to doctors to influence their prescribing is limited, and public disclosure of industry payments could reduce trust in the medical profession.10 Australian doctors should reflect on their relationship with the pharmaceutical industry, considering whether they need to accept payments for continuing professional education, travel, and consultancy work, and whether it is consistent with public expectations. Greater transparency in the reporting of pharmaceutical company payments to health care professionals is needed, and payments should be linked with AHPRA numbers to facilitate the identification of individual recipients.
Box 1 – Total payments by Medicines Australia member companies to medical practitioners, 1 November 2019 to 31 October 2022, for the ten specialties that received the largest total amounts
|
Specialty |
Total payments |
Median payment (IQR) |
|||||||||||||
|
|
|||||||||||||||
|
Haematology/oncology |
$6133645 |
$1200 ($747–1708) |
|||||||||||||
|
Cardiology |
$3684307 |
$1092 ($750–1600) |
|||||||||||||
|
Endocrinology |
$2815058 |
$1200 ($875–1455) |
|||||||||||||
|
Respiratory and sleep medicine |
$2358792 |
$1091 ($727–1660) |
|||||||||||||
|
Rheumatology |
$2302898 |
$933 ($433–1600) |
|||||||||||||
|
General practice |
$2188564 |
$873 ($409–1470) |
|||||||||||||
|
Neurology |
$2163752 |
$1500 ($1000–2252) |
|||||||||||||
|
Gastroenterology and hepatology |
$1584661 |
$1125 ($600–1800) |
|||||||||||||
|
Ophthalmology |
$1405709 |
$1200 ($658–2000) |
|||||||||||||
|
Dermatology |
$1206515 |
$1210 ($778–1740) |
|||||||||||||
|
|
|||||||||||||||
|
IQR = interquartile range. |
|||||||||||||||
Box 2 – Proportions of doctors (with 95% confidence intervals) who received payments from Medicines Australia member companies, 1 November 2019 to 31 October 2022, for the ten specialties with the largest proportions*
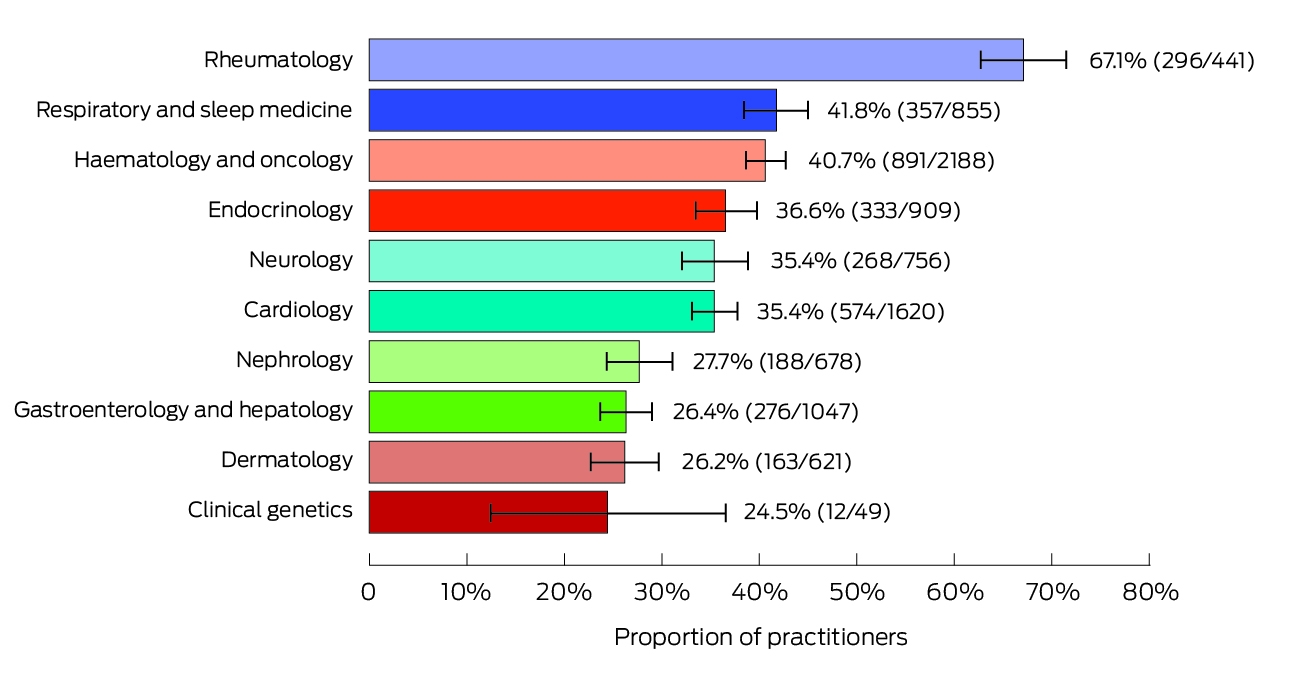
* Absolute numbers of doctors receiving payments and number of doctors in specialty are shown in parentheses.
Box 3 – Total payments by Medicines Australia member companies to Australian doctors, 1 November 2019 to 31 October 2022, for the ten companies with the largest total payments
|
Company |
Total payments |
||||||||||||||
|
|
|||||||||||||||
|
Novartis Pharmaceuticals |
$3674856 |
||||||||||||||
|
AstraZeneca |
$2611668 |
||||||||||||||
|
Bayer |
$2511180 |
||||||||||||||
|
Pfizer |
$2441786 |
||||||||||||||
|
Eli Lilly |
$1881093 |
||||||||||||||
|
Amgen |
$1796453 |
||||||||||||||
|
Boehringer Ingelheim |
$1760942 |
||||||||||||||
|
GlaxoSmithKline |
$1713158 |
||||||||||||||
|
Janssen–Cilag |
$1703976 |
||||||||||||||
|
AbbVie |
$1698277 |
||||||||||||||
|
|
|||||||||||||||
|
|
|||||||||||||||
Competing interests
No relevant disclosures.
Acknowledgements
Open access publishing facilitated by the University of Melbourne, as part of the Wiley – the University of Melbourne agreement via the Council of Australian University Librarians.
References
- Medicines Australia. Code edition 19, version 2. 26 Nov 2019; updated 3 Nov 2022. https://www.medicinesaustralia.com.au/code/about‐the‐code/code‐of‐conduct‐current‐edition (viewed June 2023).
- Medicines Australia. Code of conduct. Edition 18. June 2015. https://www.medicinesaustralia.com.au/wp‐content/uploads/sites/65/2020/11/20150617‐PUB‐Code‐Edition‐18‐FINAL.pdf (viewed June 2023).
- Dean J, Forbes MP, Di Natale R. A positive step for pharmaceutical payment transparency. Med J Aust 2017; 206: 414. https://www.mja.com.au/journal/2017/206/9/positive‐step‐pharmaceutical‐payment‐transparency
- Australian Health Practitioner Regulation Agency. Annual report 2021/22. https://www.ahpra.gov.au/Publications/Annual‐reports/Annual‐Report‐2022.aspx (viewed June 2023).
- Fabbri A, Grundy Q, Mintzes B, et al. A cross‐sectional analysis of pharmaceutical industry‐funded events for health professionals in Australia. BMJ Open 2017; 7: e016701.
- DeJong C, Aguilar T, Tseng CW, et al. Pharmaceutical industry‐sponsored meals and physician prescribing patterns for Medicare beneficiaries. JAMA Intern Med 2016; 176: 1114‐1122.
- Hadland SE, Cerdá M, Li Y, et al. Association of pharmaceutical industry marketing of opioid products to physicians with subsequent opioid prescribing. JAMA Intern Med 2018; 178: 861‐863.
- Mitchell AP, Trivedi NU, Gennarelli RL, et al. Are financial payments from the pharmaceutical industry associated with physician prescribing? A systematic review. Ann Intern Med 2021; 174: 353‐361.
- Agha L, Zeltzer D. Drug diffusion through peer networks: the influence of industry payments. Am Econ J Econ Policy 2022; 14: 1‐33.
- Kanter GP, Carpenter D, Lehmann LS, Mello MM. US nationwide disclosure of industry payments and public trust in physicians. JAMA Netw Open 2019; 2: e191947.
Intranasal Adrenaline Use for the Management of Insect Venom-Induced Anaphylaxis
Thomas J. Young, Wilhelmina R. F. Johnson, Braydon L. Pennington, Troy Wanandy, Wun Y. Lau, Thanh-Thao A. Le
Gabapentinoid Poisoning Presentations to Victorian Emergency Departments: A 15-Year Trend Analysis
Bishaal Tej Gurung, Amy McNeilage, Angus Skeen, Tina Lam, Joanna F. Dipnall, Jane Hayman, Suzanne Nielsen, Ting Xia
Still Treating Yesterday's Risk? Reconsidering Antiviral Use for Mild-to-Moderate COVID-19 Cases in a Broadly Immune Population
Hadar Mudrik-Zohar, Tim Cutfield, Susan Morpeth, Thomas Hills, Eamon Duffy, Laura J. Edwards, Allen C. Cheng, Steven Y. C. Tong
Birth prevalence, clinical sequelae, and management of congenital cytomegalovirus infections in Australia, 1999–2023: a national prospective study
Ece Egilmezer, Suzy M Teutsch, Carlos Nunez, Stuart T Hamilton, Adam W Bartlett, Pamela Palasanthiran, Elizabeth J Elliott, William D Rawlinson
Concurrent use of hormonal long‐acting reversible contraception by women of reproductive age dispensed teratogenic medications, Australia, 2013–2021
Aaron E Boyce, Tony Caccetta, Jo‐Ann See, Rosemary L Nixon AM
Concurrent use of hormonal long‐acting reversible contraception by women of reproductive age dispensed teratogenic medications, Australia, 2013–2021
Michelle KY Chen, Adrian Lim, Deshan F Sebaratnam