


The known: Fracture liaison services (FLS) can reduce the number of subsequent fractures in people who present to hospital with osteoporotic fractures.
The new: Our system dynamics model projected that Australians aged 50 years or more would experience 2 441 320 fractures, including 1 211 646 second or later fractures, during 2020–31. Increasing the number of FLS and doubling their screening rate and capacity could avert 13 672 fractures (0.56%), at a cost of $42 828 per fracture averted.
The implications: Our study, the first to simulate the effects of changing the implementation characteristics of FLS, projected that only a small proportion of fractures would be averted.
Osteoporosis is a chronic disease characterised by bone microarchitecture deterioration, leading to fragile bones more likely to fracture.1 It is estimated that two in three Australians aged 50 years or more have low bone mineral density (osteopenia) or osteoporosis.2 In 2013, it was projected that the annual cost of osteoporotic fractures in Australia in 2022 would be $3.84 billion, or more than $20 000 per fracture.2 During 2002–12, the number of people aged 50 years or more hospitalised with minimal trauma hip fractures increased by 22%.3 The burden of osteoporosis and minimal trauma fractures is expected to increase substantially in Australia as our population ages.
Interventions for preventing osteoporosis and fractures include public health campaigns, clinician education, and exercise programs. Fracture liaison services (FLS) have expanded across the world over the past two decades, and are now considered best practice for secondary fracture prevention.4,5 People who present to hospital with minimal trauma fractures are identified, assessed for osteoporosis, and treated as required. Resource limitations mean that not all FLS provide all three services; type A FLS provide the most intensive intervention and type D the least intensive (Box 1).6
In 2018, twenty‐nine FLS operated in Australia; twenty‐one were classified as type A facilities.7 Given the location of these FLS (for example: thirteen in New South Wales, but only one each in South Australia and Western Australia),7 most people who sustain fractures will not have local access to FLS. A major objective of the 2019 National Strategic Action Plan for Osteoporosis (Australian Department of Health) is to expand the number of FLS in public hospitals to one hundred; other objectives include education programs and a national screening program.8 Limitations to expanding FLS availability include the financial support, staff, and space required. FLS increase medication prescribing and the use of dual‐energy X‐ray absorptiometry (DXA), but evidence as to whether they reduce the incidence of secondary fractures is mixed.9 Incremental cost‐effectiveness ratios of $17 29110 and $31 74911 per quality‐adjusted life year gained have been estimated for care in Australian FLS. Factors that influence FLS effectiveness include the ability to screen all people who present with fractures, their willingness to attend FLS, and their compliance with therapy.
Expanding the use of successful service models can be difficult because of the complexity of service systems and questions regarding the mode of delivery, resource allocation, reach, adoption, provider practices, compliance with therapy, attrition, and population dynamics.12,13 The complex interactions of these parameters prohibit simple linear projections of population‐level effects from service effectiveness evaluations. System dynamics modelling is more appropriate for analysing nonlinear behaviour in complex systems, and can be used to test options for expanding services and to determine realistic effect targets prior to their implementation.14,15,16
The primary aim of our study was to use system dynamics modelling to project how many minimal trauma fractures could be averted by expanding the number and changing the operational characteristics of FLS in Australia. Our secondary aim was to estimate the cost of such changes.
Methods
We undertook a system dynamics modelling study of the impact of expanding FLS care for people aged 50 years or more who present to hospital with minimal trauma fractures during 2020–31. The modelling process followed the approach described by other authors.16 Our 32‐member multidisciplinary modelling consortium — including senior clinicians in endocrinology (four), rheumatology (two), geriatric medicine (two), general practice (one), and physiotherapy (two), as well as health economists, epidemiologists, members of the general public, and policy partners from Healthy Bones Australia, Amgen, and the federal Department of Health — participated in three workshops during July 2018 – January 2019. The first workshop introduced the concept of system dynamics modelling and the mapping of care pathways for people aged 50 years or more before and after sustaining a fracture. A conceptual diagram was developed and converted into a computational model. The second workshop focused on the interventions and the approach to estimating the costs associated with the interventions, and unit costs were assigned to model components. The third workshop presented the model to all participants for feedback and refinement. At each stage, the model was informed by the best available evidence, or by expert opinion when evidence was not available.
System dynamics model structure
The system dynamics model, constructed using Stella Architect 1.9.4 (http://www.iseesystems.com/softwares/Education/StellaSoftware/aspx), included seven components (model component diagrams: Supporting Information, figures 1–8 and table 1; model assumptions: Supporting Information, table 2):
A. Population: People aged 50 years or more, taking into account the effects of migration and death rates.17
B. Pre‐fracture bone health: The proportions of people aged 50 years or more who retain normal bone mineral density or who develop osteopenia or osteoporosis during the study period, and the proportion who commence anti‐resorptive therapy for primary prevention of fractures. As denosumab is the most widely used anti‐resorptive medication in Australia, we assumed treatment effects associated with its use.18 The relative risks of fracture with treatment used in the model, based on published reviews,19,20 were 0.6 for hip fracture, 0.3 for vertebral fracture, and 0.8 for non‐hip/non‐vertebral fractures.
C. Fracture status: Fractures (hip or other), stratified by prior anti‐resorptive treatment; some people commence treatment, others cease or restart treatment during the study period. People who have had fractures are at greater risk of fractures, but this risk is reduced by treatment.19,20
D. Hospital care: The care pathway for people who present to a hospital with a fracture (admission or review in the emergency department), after which they are referred to a general practitioner or specialist for post‐fracture management, referred to an FLS, managed in hospital by orthogeriatric services (predominantly for people with hip fractures), or receive no post‐fracture management advice. If no place in the FLS or orthogeriatric service is available, they are referred to a general practitioner or specialist.
E. Pre‐ and post‐fracture community care: 1. Pre‐fracture care by bone health category, including frequency of general practice visits for people aged 50 years or more, likelihood of requesting (and completing) a DXA scan, and the proportions of people who commence treatment and of those who then cease or restart treatment. 2. Post‐fracture sector stratified by fracture type (hip or other) and preventive treatment status at the time of fracture. Different proportions of people will be referred for DXA scans, start treatment, and cease or restart treatment.
F. Cost and burden of disease: Costs are assigned to the federal or state governments, and to out‐of‐pocket costs for patients. Unit costs were based on Medicare Benefits Schedule (MBS; eg, for specialist consultations and DXA) and Pharmaceutical Benefits Scheme (PBS) data. Medication costs were divided between denosumab and bisphosphonates according to the proportions dispensed during 2014–19.18 We report cost per fracture averted, based on the costs incurred by the intervention and downstream costs, unadjusted for expected treatment cost savings. We do not report the cost per quality‐adjusted life year gained, the usual measure of cost‐effectiveness, because the estimated costs in our model include downstream costs to the health care system, not just the cost of the intervention.
G. FLS intervention: We modelled type A FLS, including a coordinator (clinical nurse grade 2) who screened hospital records for people aged 50 years or more who had presented to hospital with minimal trauma fractures and wrote to them and their general practitioners, clinical investigations (including pathology, spinal X‐ray, DXA), specialist consultations, treatment when indicated, follow‐up phone calls, and written communication with general practitioners. The base model assumed twenty‐nine FLS operating in Australia in 2018, identification of 30% of people who present to hospital with fractures (screening rate), and a capacity to accept forty new patients per service each month; we assumed that 30% of those invited did not attend FLS.
Model outputs and calibration
We ran the model for the period 2011–31, with year as the model time unit and a delta time of one month between calculations and changes in the model (interventions). We compared input data from alternative sources and used constrained optimisation to minimise bias. We validated the model by comparing model outputs for 2011–17 with actual data for this period on DXA scans (MBS data),21 medication use (PBS data),18 and fracture incidence (hospital and emergency department data included in Australian Institute of Health and Welfare osteoporosis data tables).22
Scenario testing
We report projected outcomes for the period 2020–31. We modelled changes from the base case in the numbers of minimal trauma fracture (all, hip fractures) during 2020–31 in diverse intervention scenarios: modifying the FLS number (doubled, increased to one hundred), the patient screening rate (doubled from 30% to 60%), the FLS capacity for new patients (doubled from 40 to 80 per month), and the proportion of people invited to attend FLS who did not (reduced from 30% to 15%), both individually and in combination. The modelled increase in FLS number during 2020–31 was gradual, reflecting the time required to establish new services, while changes to the screening, capacity, and non‐attendance rates were assumed to be relatively rapid (Supporting Information, figure 9). No sensitivity analyses were undertaken; as our aim was to compare the effects of different strategies, rather than to provide precise predictions, we deemed a deterministic model adequate.
Ethics approval
We did not seek ethics approval for our modelling study based on publicly available population‐level data.
Results
With twenty‐nine FLS (2018), our model projected a total of 2 441 320 minimal trauma fractures (258 680 hip fractures; 2 182 640 non‐hip fractures) in Australia during 2020–31, including 1 211 646 second or later fractures.
Optimising the operational characteristics of fracture liaison services
Doubling the FLS number from 29 to 58 services was projected to avert 3964 minimal trauma fractures during 2020–31 (0.16%); increasing the number to 100 services was projected to avert 5405 fractures (0.22%) (Box 2). The smaller projected reduction for the increase from 58 to 100 services reflects the mismatch between screening number and FLS capacity at the higher level. One hundred FLS could theoretically provide 48 000 appointments, but only 21 710 people could be screened; doubling the screening rate to 60% would reduce the difference (Box 3). Doubling FLS capacity alone was projected to reduce the cumulative number of fractures (by 3674, 0.15%); doubling the proportion of people screened or reducing by half the proportion who did not attend FLS alone was not (Box 2), as the model assumed that services took non‐attendance rates into account when issuing invitations, so that all available appointments would be used.
Increasing the FLS number to 100 and doubling the FLS screening rate and capacity would together avert 13 672 minimal trauma fractures (0.56%), more than the sum of the effects of the individual components (9079 fractures averted, 0.37%). In contrast, the reduction achieved were the FLS number and capacity doubled and the non‐attendance rate reduced from 30% to 15% (4822 fractures, 0.20%) would be smaller than the sum of their individual effects (7638 fractures averted, 0.31%) (Box 3, Box 4).
Cost of optimising the operational characteristics of fracture liaison services
The least expensive strategy for averting minimal trauma fractures was doubling FLS capacity for new patients from forty to eighty per month ($35 835 per fracture averted) (Box 3); the most expensive option was to double both the number of FLS and the screening rate ($48 464 per fracture averted); increasing the FLS number to one hundred and doubling the screening rate was slightly less expensive ($43 237 per fracture averted) because of the larger number of fractures averted (10 714 v 4472 with 58 services). In both cases (58 or 100 FLS with 60% screening rate), increasing FLS capacity reduced the cost per fracture averted (to $42 478 and $42 828 respectively; Box 4).
Discussion
Using system dynamics modelling, we projected that Australians aged 50 years or more will have a total of 2 441 320 minimal trauma fractures during 2020–31, including 1 211 646 second or later fractures, if the number of FLS (twenty‐nine) does not change. Our projections of the effects of single and combined changes to FLS operations could inform the expansion of hospital‐based FLS in Australia.
Any change should aim to improve the effectiveness or reduce the cost of FLS, an preferably both. New services should take into account relevant factors to ensure that outcomes are optimised (clinical investigations, treatment, and, ultimately, reducing the number of fractures) and costs are minimised. Our model suggests that expanding the number or capacity of FLS alone would be inefficient; the proportion of people screened would also need to rise for the increased number of appointments to be filled.
Systematic reviews of FLS outcomes have found that they improve osteoporosis care, including rates of bone densitometry screening and initiation of anti‐resorptive therapy.6,23,24 Lower fracture rates have been reported for only some FLS, perhaps because of inadequate follow‐up or the absence of an appropriate control group.6,9 Further, FLS outcomes vary markedly between studies; rates of DXA and initiation of anti‐resorptive therapy are higher in more intensive (type A) and therefore more expensive FLS. Unfortunately, comparative data regarding screening, capacity, and non‐attendance rates are rarely reported, so that their influence on FLS efficacy cannot be assessed. System dynamics modelling enabled us to examine these factors and provide projections in a non‐experimental setting.
The Australian Department of Health recognised the importance of optimising bone health with its National Strategic Action Plan for Osteoporosis, and plans to expand FLS access as one component of its strategy.8 Our model suggests increasing FLS screening and capacity can be useful, but the overall impact of even 100 FLS on fracture prevention was limited. Further, specialist‐led, hospital‐based FLS are expensive, although we did not consider savings to the health system and individuals associated with averting fractures. Alternative strategies include making primary care the focus of secondary fracture prevention, using nurse practitioners rather than physicians for some consultations, communicating with patients via email or text message rather than post, and using artificial intelligence to detect fractures in radiology reports.25,26
According to our model, fewer than 1% of minimal trauma fractures would be averted by expanding FLS access. However, the reported outcomes were at the population level, and FLS do not comprise a population‐level intervention. They instead focus on secondary prevention for people with fractures who present to hospital, and the proportion of all fractures that can be averted is consequently small. In addition, the reduction in fracture rates achieved by FLS is predominantly attributable to increased prescribing of anti‐resorptive therapy, compliance with which is often poor.2 Our model did not take into account possible external factors such as public health campaigns or general practitioner education. FLS comprise only one component of the National Strategic Action Plan, alongside educational programs, integration with primary care and fall prevention programs, a national risk identification program, and decision support tools.8 These initiatives, together with expanded access to FLS, could improve attendance and therapeutic compliance by people with minimal trauma fractures, thereby increasing the potential benefits of FLS.
Limitations
The assumptions underlying our model were derived from published data as far as possible, and were otherwise based on expert opinion. We employed a number of standard strategies to minimise bias, including the triangulation of multiple alternative data sources, parameter estimation using constrained optimisation (used sparingly in the base model when parameter values were unavailable, and tested with the expert consortium), and local verification for identifying plausible estimates. The model did not take the treatment effects of different medications into account, nor the lasting bone‐protective effect of bisphosphonate therapy after its discontinuation; no treatment was deemed effective for preventing fractures in people with osteopenia who have not had fractures, although hormone replacement therapy and zoledronic acid may be protective.27,28 The model used a delta of one month, whereas people may not attend appointments or commence medication use within this time frame. The model projected outcomes over eleven years, which may be too short for achieving substantial reductions in fracture numbers, particularly given the gradual increase in service number. The outcomes and costs pertain only to type A FLS. Reducing the proportion of people who do not attend FLS did not affect fracture outcomes because the model assumed that all unaccepted appointment invitations were offered to other patients, which may not reflect practice in the real world.
Conclusion
We used system dynamics modelling to project the number of minimal trauma fractures averted and the cost associated with expanding and adjusting the operating characteristics of hospital‐based FLS in Australia. The greatest reduction was achieved by concurrently increasing FLS number, the screening rate, and the capacity for new patients. As the proportion of fractures averted by doubling or even tripling the number of FLS would be low, and the cost of each averted fracture high, alternatives to specialist‐led, hospital‐based FLS should be explored, including incorporating secondary fracture prevention into primary care.
Box 1 – Classification of fracture liaison services by interventions provided6
|
Fracture liaison service |
Components |
||||||||||||||
|
|
|||||||||||||||
|
Type A |
The patient is identified |
||||||||||||||
|
Clinical investigations are ordered |
|||||||||||||||
|
Treatment initiated as required |
|||||||||||||||
|
The patient and their general practitioner are notified about the significance of the fracture, investigation results, and the treatment plan |
|||||||||||||||
|
Type B |
The patient is identified |
||||||||||||||
|
Clinical investigations are ordered |
|||||||||||||||
|
The patient and their general practitioner are notified about the significance of the fracture and investigation results |
|||||||||||||||
|
Type C |
The patient is identified |
||||||||||||||
|
The patient and their general practitioner are notified about the significance of the fracture |
|||||||||||||||
|
Type D |
The patient is identified |
||||||||||||||
|
The patient is notified about the significance of the fracture |
|||||||||||||||
|
|
|||||||||||||||
|
|
|||||||||||||||
Box 2 – Projected cumulative reductions in the numbers of minimal trauma fractures in people aged 50 years or more, Australia, 2020–31, achieved by improving the operational characteristics of fracture liaison services (FLS): single interventions*
|
Scenario |
FLS number/monthly capacity |
Screening/non‐attendance rates |
Cumulative reduction in all fracture number |
Cumulative reduction in hip fracture number |
Cost per fracture averted |
||||||||||
|
|
|||||||||||||||
|
Base case |
29/40 |
30%/30% |
— |
— |
— |
||||||||||
|
1. Double number of fracture liaison services |
58/40 |
30%/30% |
3964 (0.16%) |
567 (0.22%) |
$39 220 |
||||||||||
|
2. Increase number of fracture liaison services to 100 |
100/40 |
30%/30% |
5405 (0.22%) |
773 (0.30%) |
$39 510 |
||||||||||
|
3. Double the proportion of people screened |
29/40 |
60%/30% |
0 |
0 |
— |
||||||||||
|
4. Double fracture liaison service capacity |
29/80 |
30%/30% |
3674 (0.15%) |
523 (0.20%) |
$35 835 |
||||||||||
|
5. Reduce the non‐attendance rate by 50% |
29/40 |
30%/15% |
0 |
0 |
— |
||||||||||
|
|
|||||||||||||||
|
|
|||||||||||||||
Box 3 – Effect of increasing the number of fracture liaison services (FLS), screening rate, and capacity*
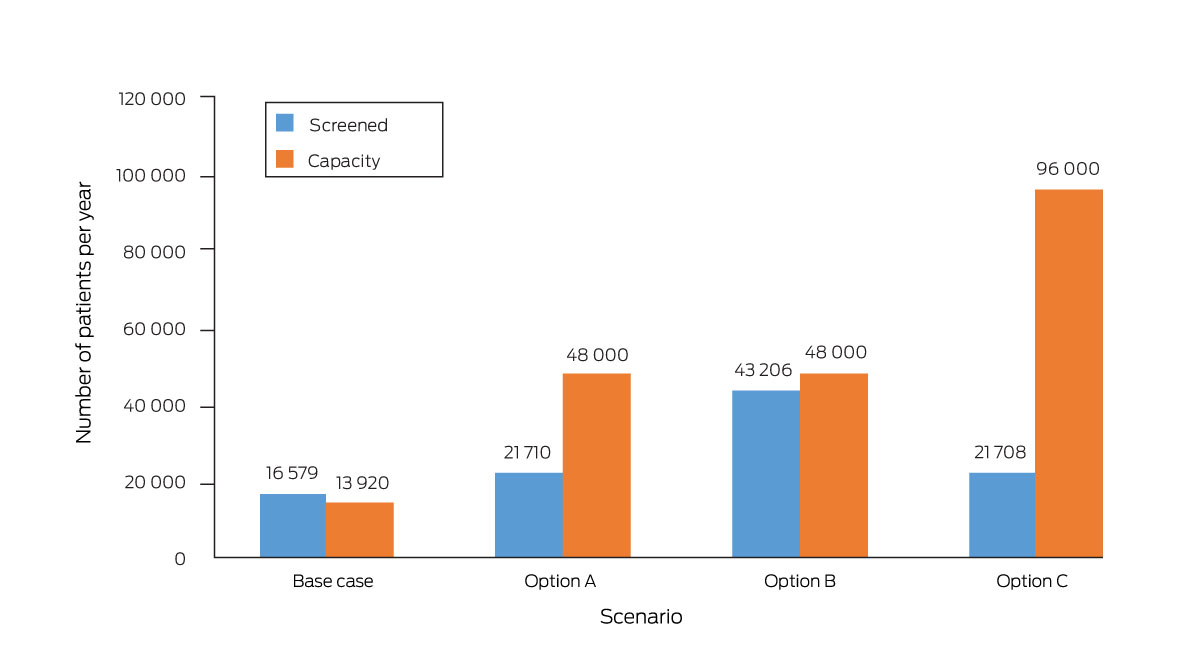
* Base case: 29 fracture liaison services, 30% screening rate, capacity to see 40 new patients each month. Option A: 100 fracture liaison services, 30% screening rate, capacity to see 40 new patients each month. Option B: 100 fracture liaison services, 60% screening rate, capacity to see 40 new patients each month. Option C: 100 fracture liaison services, 30% screening rate, capacity to see 80 new patients each month. The total number of people managed by fracture liaison services would be the lower of the number screened and the service capacity.
Box 4 – Projected cumulative reductions in the numbers of minimal trauma fractures in people aged 50 years or more, Australia, 2020–31, achieved by improving the operational characteristics of fracture liaison services (FLS): multiple interventions*
|
Scenario combination |
FLS number/monthly capacity |
Screening/non‐attendance rates |
Cumulative reduction in all fracture number |
Cumulative reduction in hip fracture number |
Cost per fracture averted |
||||||||||
|
|
|||||||||||||||
|
Base case |
29/40 |
30%/30% |
— |
— |
— |
||||||||||
|
1. Double number of fracture liaison services, plus: |
|
|
|
|
|
||||||||||
|
3. Double the proportion of people screened |
58/40 |
60%/30% |
4472 (0.18%) |
641 (0.25%) |
$48 464 |
||||||||||
|
4. Double fracture liaison service capacity |
58/80 |
30%/30% |
4822 (0.20%) |
687 (0.27%) |
$37 638 |
||||||||||
|
5. Reduce the non‐attendance rate by 50% |
58/40 |
30%/15% |
3964 (0.16%) |
567 (0.22%) |
$39 220 |
||||||||||
|
3 and 4 |
58/80 |
60%/30% |
11 681 (0.48%) |
1673 (0.65%) |
$42 478 |
||||||||||
|
3 and 5 |
58/40 |
60%/15% |
4472 (0.18%) |
641 (0.25%) |
$48 464 |
||||||||||
|
4 and 5 |
58/80 |
30%/15% |
4822 (0.20%) |
687 (0.27%) |
$37 638 |
||||||||||
|
3, 4, and 5 |
58/80 |
60%/15% |
11 681 (0.48%) |
1673 (0.65%) |
$42 478 |
||||||||||
|
2. Increase number of fracture liaison services to 100, plus: |
|
|
|
|
|
||||||||||
|
3. Double the proportion of people screened |
100/40 |
60%/30% |
10 714 (0.44%) |
1537 (0.59%) |
$43 237 |
||||||||||
|
4. Double fracture liaison service capacity |
100/80 |
30%/30% |
5987 (0.25%) |
854 (0.33%) |
$38 643 |
||||||||||
|
5. Reduce the non‐attendance rate by 50% |
100/40 |
30%/15% |
5406 (0.22%) |
773 (0.30%) |
$39 510 |
||||||||||
|
3 and 4 |
100/80 |
60%/30% |
13 672 (0.56%) |
1958 (0.76%) |
$42 828 |
||||||||||
|
3 and 5 |
100/40 |
60%/15% |
10 714 (0.44%) |
1537 (0.59%) |
$43 237 |
||||||||||
|
4 and 5 |
100/80 |
30%/15% |
5987 (0.25%) |
854 (0.33%) |
$38 643 |
||||||||||
|
3, 4, and 5 |
100/80 |
60%/15% |
13 672 (0.56%) |
1958 (0.76%) |
$42 828 |
||||||||||
|
3. Double the proportion of people screened, plus: |
|
|
|
|
|
||||||||||
|
4. Double fracture liaison service capacity |
29/80 |
60%/30% |
5878 (0.24%) |
839 (0.32%) |
$41 845 |
||||||||||
|
5. Reduce the non‐attendance rate by 50% |
29/40 |
60%/15% |
0 |
0 |
— |
||||||||||
|
4 and 5 |
29/80 |
60%/15% |
5878 (0.24%) |
839 (0.32%) |
$41 845 |
||||||||||
|
4. Double fracture liaison service capacity, plus: |
|
|
|
|
|
||||||||||
|
5. Reduce the non‐attendance rate by 50% |
29/80 |
30%/15% |
3674 (0.15%) |
523 (0.20%) |
$35 835 |
||||||||||
|
|
|||||||||||||||
|
* Base case projections: 2 441 320 minimal trauma fractures, including 258 680 hip fractures. Cumulative reduction is the total number of fractures averted; the proportion is that of all fractures expected. |
|||||||||||||||
Received 11 January 2023, accepted 7 December 2023
- Alicia R Jones1,2
- Danielle Currie3
- Cindy Peng3
- Peter R Ebeling4
- Jackie R Center5,6
- Gustavo Duque7,8
- Sean Lybrand9
- Greg Lyubomirsky10
- Rebecca J Mitchell11
- Sallie Pearson12,13
- Markus J Seibel14,15
- Jo‐An Occhipinti16,17
- 1 Monash Centre for Health Research and Implementation, Monash University, Melbourne, VIC
- 2 Monash Health, Melbourne, VIC
- 3 Sax Institute, Sydney, NSW
- 4 Monash University, Melbourne, VIC
- 5 Garvan Institute of Medical Research, Sydney, NSW
- 6 St Vincent's Hospital Sydney, Sydney, NSW
- 7 Australian Institute for Musculoskeletal Science (AIMSS), University of Melbourne and Western Health, Melbourne, VIC
- 8 Western Health, Melbourne, VIC
- 9 Amgen Europe, Rotkreuz, Switzerland
- 10 Healthy Bones Australia, Sydney, NSW
- 11 Australian Institute of Health Innovation, Macquarie University, Sydney, NSW
- 12 Centre for Big Data Research in Health, University of New South Wales, Sydney, NSW
- 13 Centre of Research Excellence in Medicines Intelligence, University of New South Wales, Sydney, NSW
- 14 Concord Clinical School, University of Sydney, Sydney, NSW
- 15 ANZAC Research Institute, University of Sydney, Sydney, NSW
- 16 Brain and Mind Centre, University of Sydney, Sydney, NSW
- 17 Computer Simulation and Advanced Research Technologies (CSART), Sydney, NSW
Open access:
Open access publishing facilitated by Monash University, as part of the Wiley – Monash University agreement via the Council of Australian University Librarians.
This investigation was funded by Amgen Australia. It was overseen by an expert advisory panel, including a representative from the funder, with an independent chair. The funder contributed to the scope and design of this study, and preparation and review of the manuscript, but did not influence the collation, management, analysis, and interpretation of the data, or the decision to submit the manuscript for publication.
We thank Janet Sluggett (University of South Australia, Adelaide), Cathie Sherrington (Institute for Musculoskeletal Health, University of Sydney, Sydney), Matthew Jennings (Liverpool Hospital, Sydney), Henry Cutler (Centre for Health Economy, Macquarie University, Sydney), Jacqueline Close (Prince of Wales Hospital, Sydney), and Mark Heffernan (Western Sydney University, Sydney) for their contributions to the advisory group and modelling.
Jo‐An Occhipinti is managing director of Computer Simulation and Advanced Research Technologies. Alicia Jones holds a National Health and Medical Research Council (NHMRC) postgraduate research scholarship (1169192). Markus J Seibel holds an NHMRC Investigator Grant for research into secondary fracture prevention (APP1196062). Sean Lybrand is an employee of Amgen Australia.
- 1. Consensus development conference: prophylaxis and treatment of osteoporosis. Am J Med 1991; 90: 107‐110.
- 2. Watts JJ, Abimanyi‐Ochom J, Sanders KM. Osteoporosis costing all Australians: a new burden of disease analysis 2012 to 2022. Melbourne: Osteoporosis Australia, 2013. https://healthybonesaustralia.org.au/wp‐content/uploads/2022/09/burden‐of‐disease‐analysis‐2012‐2022.pdf (viewed Feb 2021).
- 3. Australian Institute of Health and Welfare. Estimating the prevalence of osteoporosis in Australia (Cat. no. PHE 178). Canberra: AIHW, 2014. https://www.aihw.gov.au/reports/chronic‐musculoskeletal‐conditions/estimating‐the‐prevalence‐of‐osteoporosis‐in‐austr/summary (viewed Mar 2021).
- 4. Akesson K, Marsh D, Mitchell PJ, et al; IOF Fracture Working Group. Capture the fracture: a best practice framework and global campaign to break the fragility fracture cycle. Osteoporos Int 2013; 24: 2135‐2152.
- 5. McLellan AR, Gallacher SJ, Fraser M, McQuillian C. The fracture liaison service: success of a program for the evaluation and management of patients with osteoporotic fracture. Osteoporos Int 2003; 14: 1028‐1034.
- 6. Ganda K, Puech M, Chen JS, et al. Models of care for the secondary prevention of osteoporotic fractures: a systematic review and meta‐analysis. Osteoporos Int 2013; 24: 393‐406.
- 7. Redman A, Bartlett M; National Alliance for Secondary Fracture Prevention. Towards an integrated Australian osteoporosis secondary fracture prevention program [unpublished report]. Sydney: Sax Institute, 2019.
- 8. Australian Department of Health. National Strategic Action Plan for Osteoporosis. 17 Oct 2019. https://www.health.gov.au/resources/publications/national‐strategic‐action‐plan‐for‐osteoporosis‐2019?language=en (viewed Mar 2021).
- 9. Jones AR, Herath M, Ebeling PR, et al. Models of care for osteoporosis: a systematic scoping review of efficacy and implementation characteristics. eClinicalMedicine 2021; 38: 101022.
- 10. Cooper MS, Palmer AJ, Seibel MJ. Cost‐effectiveness of the Concord Minimal Trauma Fracture Liaison service, a prospective, controlled fracture prevention study. Osteoporos Int 2012; 23: 97‐107.
- 11. Yates CJ, Chauchard MA, Liew D, et al. Bridging the osteoporosis treatment gap: performance and cost‐effectiveness of a fracture liaison service. J Clin Densitom 2015; 18: 150‐156.
- 12. Milat A, Lee K, Conte K, et al. Intervention Scalability Assessment Tool: a decision support tool for health policy makers and implementers. Health Res Policy Syst 2020; 18: 1.
- 13. Koorts H, Cassar S, Salmon J, et al. Mechanisms of scaling up: combining a realist perspective and systems analysis to understand successfully scaled interventions. Int J Behav Nutr Phys Act 2021; 18: 42.
- 14. Homer JB, Hirsch GB. System dynamics modeling for public health: background and opportunities. Am J Public Health 2006; 96: 452‐458.
- 15. Sterman JD. Learning from evidence in a complex world. Am J Public Health 2006; 96: 505‐514.
- 16. Freebairn L, Rychetnik L, Atkinson J, et al. Knowledge mobilisation for policy development: implementing systems approaches through participatory dynamic simulation modelling. Health Res Policy Syst 2017; 15: 87.
- 17. Australian Bureau of Statistics. Australian Demographic Statistics, Mar 2019 (3101.0). 19 Sept 2019. https://www.abs.gov.au/AUSSTATS/abs@.nsf/Lookup/3101.0Main+Features1Mar%202019 (viewed Mar 2021).
- 18. Drug Utilisation Sub‐Committee (Australian Department of Health). Denosumab for osteoporosis: utilisation analysis using PBS data. Oct 2020. https://www.pbs.gov.au/industry/listing/participants/public‐release‐docs/2020‐10/denosumab‐analysis‐PBS‐and‐MI‐dusc‐prd‐2020‐10v2.PDF (viewed June 2021).
- 19. Crandall CJ, Newberry SJ, Diamant A, et al. Comparative effectiveness of pharmacologic treatments to prevent fractures: an updated systematic review. Ann Intern Med 2014; 161: 711‐723.
- 20. Reid IR. Efficacy, effectiveness and side effects of medications used to prevent fractures. J Intern Med 2015; 277: 690‐706.
- 21. Medicare Benefits Schedule Review Taskforce. Second report from the Diagnostic Imaging Clinical Committee: bone densitometry. Aug 2016. https://www.health.gov.au/sites/default/files/documents/2021/06/final‐clinical‐committee‐report‐for‐diagnostic‐imaging‐bone‐densitometry.pdf (viewed Mar 2021).
- 22. Australian Institute of Health and Welfare. Osteoporosis web pages data tables. 2019. https://www.aihw.gov.au/getmedia/e28cc715‐5aef‐42a4‐9034‐14ebff0ef919/osteoporosis‐2019_1.xlsx.aspx (viewed Mar 2021).
- 23. Little EA, Eccles MP. A systematic review of the effectiveness of interventions to improve post‐fracture investigation and management of patients at risk of osteoporosis. Implement Sci 2010; 5: 80.
- 24. Sale JEM, Beaton D, Posen J, et al. Systematic review on interventions to improve osteoporosis investigation and treatment in fragility fracture patients. Osteoporos Int 2011; 22: 2067‐2082.
- 25. Kolanu N, Brown AS, Beech A, et al. Natural language processing of radiology reports improves identification of patients with fracture. Arch Osteoporos 2021; 16: 6.
- 26. Blaker K, Wijewardene A, White E, et al. Electronic search programs are effective in identifying patients with minimal trauma fractures. Osteoporos Int 2022; 33: 435‐441.
- 27. Reid IR, Horne AM, Mihov B, et al. Fracture prevention with zoledronate in older women with osteopenia. N Engl J Med 2018; 379: 2407‐2416.
- 28. de Villiers TJ, Stevenson JC. The WHI: the effect of hormone replacement therapy on fracture prevention. Climacteric 2012; 15: 263‐266.
Abstract
Objectives: To project how many minimal trauma fractures could be averted in Australia by expanding the number and changing the operational characteristics of fracture liaison services (FLS).
Study design: System dynamics modelling.
Setting, participants: People aged 50 years or more who present to hospitals with minimal trauma fractures, Australia, 2020–31.
Main outcome measures: Numbers of all minimal trauma fractures and of hip fractures averted by increasing the FLS number (from 29 to 58 or 100), patient screening rate (from 30% to 60%), and capacity for accepting new patients (from 40 to 80 per service per month), and reducing the proportion of eligible patients who do not attend FLS (from 30% to 15%); cost per fracture averted.
Results: Our model projected a total of 2 441 320 minimal trauma fractures (258 680 hip fractures; 2 182 640 non‐hip fractures) in people aged 50 years or older during 2020–31, including 1 211 646 second or later fractures. Increasing the FLS number to 100 averted a projected 5405 fractures (0.22%; $39 510 per fracture averted); doubling FLS capacity averted a projected 3674 fractures (0.15%; $35 835 per fracture averted). Our model projected that neither doubling the screening rate nor reducing by half the proportion of eligible patients who did not attend FLS alone would reduce the number of fractures. Increasing the FLS number to 100, the screening rate to 60%, and capacity to 80 new patients per service per month would together avert a projected 13 672 fractures (0.56%) at a cost of $42 828 per fracture averted.
Conclusion: Our modelling indicates that increasing the number of hospital‐based FLS and changing key operational characteristics would achieve only moderate reductions in the number of minimal trauma fractures among people aged 50 years or more, and the cost would be relatively high. Alternatives to specialist‐led, hospital‐based FLS should be explored.