


The known: Disparities in key outcomes for people diagnosed with cancer by socio‐economic disadvantage and remoteness have been reported in Australia.
The new: Overall variation in health care service use by Queenslanders newly diagnosed with invasive melanoma during 2011–15 were generally minor. However, private hospital admissions and consultations with medical specialists were more frequent for people living in areas of lesser socio‐economic disadvantage and major cities than for those in areas of greater disadvantage.
The implications: Despite small variations in health care use by Queenslanders with melanoma, residential location does not markedly influence access to health services.
Melanoma incidence and mortality rates in Australia are among the highest in the world.1 The age‐standardised incidence rate in Australia is highest in Queensland (67 per 100 000 population; Australia: 49 per 100 000 population).2 Five‐year survival for people newly diagnosed with melanoma exceeds 90%,3 and most melanomas are detected early and treated with curative intent.4 However, access to medical services, melanoma thickness at diagnosis, and clinical outcomes vary by residential location and socio‐economic status.5,6 Most dermatologists work in metropolitan areas, and access is consequently poorer in rural and remote and more disadvantaged areas.7
A key aim of the 2023–33 Australian Cancer Plan will be equitable access to cancer services across Australia.8 As the annual number of newly diagnosed melanomas is projected to increase by more than 50% between 2020 and 2040,1 quantifying service use by people with melanoma is vital, particularly in Queensland. We therefore examined differences by residential remoteness and socio‐economic status in health care service use for people diagnosed with melanoma in Queensland during 2011–15.
Methods
We undertook a benefit incidence analysis to assess differences in health service use by people diagnosed with invasive (cutaneous) melanoma in Queensland, according to their levels of residential postcode‐based remoteness and socio‐economic disadvantage.9 Queensland covers about 1.9 million km2 and has an estimated population of 5.2 million people, 3.7 million of whom live in southeast Queensland;10 64% of Queenslanders live in major cities, 34% in regional areas, and 2% in remote or very remote areas.11 We report our study in accordance with the Strengthening the Reporting of Observational Studies in Epidemiology (STROBE) guidelines.12
Data sources
We analysed data from CancerCostMod,13 a linked administrative data set of all cancer diagnoses (except keratinocyte skin cancer and melanoma in situ) in Queensland recorded by the Queensland Cancer Registry (QCR), during 1 July 2011 – 30 June 2015. In brief, all QCR records were linked by the Queensland Health Statistical Services Branch, using deterministic and probabilistic methods, with the Queensland Hospital Admitted Patient Data Collection (QHAPDC), and subsequently with Medicare Benefits Schedule (MBS) and Pharmaceutical Benefits Scheme (PBS) data for the period 1 July 2011 – 30 June 2018. The authors received a de‐identified extract that included data for people newly diagnosed with invasive melanoma (International Classification of Diseases for Oncology [ICD‐O] codes C44.0 to C44.9) who were alive three years after the diagnosis (the dataset included three years’ follow‐up data for each person), were aged 18 years or older at diagnosis, and for whom residential postcodes at diagnosis were available. Excluding people who had died within three years of diagnosis and their associated end‐of‐life health care made our sample more homogenous. Melanoma stage, based on the American Joint Committee on Cancer eighth edition staging guidelines,14 was derived from QCR thickness and ulceration data. When more than one melanoma was recorded for an individual, only health service use related to their first diagnosis was included in our analyses.
Health service use
The QHAPDC dataset allows public, private, and total hospital admissions to be separately quantified, and also the number of hospital admissions with melanoma as the main cause of admission (International Classification of Diseases, tenth revision [ICD‐10] codes C43.1 to C43.9, by body site). We assessed MBS and PBS service use both overall, and by specific MBS service codes for general practitioner consultations, specialist consultations, biopsies, surgical excisions, skin flaps or grafts, and clinical pathology (Supporting Information, table 1).
Socio‐economic disadvantage and remoteness
Remoteness by residential postcode at diagnosis was classified as major city, inner regional, outer regional, remote, or very remote using the Australian Statistical Geography Standard – Remoteness Area (ASGS‐RA) classification, based on population size and distance to major metropolitan areas.15 For the concentration index analyses, we combined the outer regional, remote, and very remote categories because of the small numbers of people in some categories. Socio‐economic disadvantage by residential postcode at diagnosis was classified using Socio‐Economic Indexes for Areas (SEIFA) Index of Relative Socioeconomic Disadvantage (IRSD) deciles, based on sixteen characteristics, including area‐level income and occupational skills.16 For our analysis we condensed the IRSD deciles to quintiles, from 1 (most disadvantaged) to 5 (least disadvantaged).
Private health insurance
We used the funding source for each hospital admission, as recorded in the QHAPDC, as a proxy for private health insurance status. Any person with a hospital admission covered by private health insurance (partially or fully) was classified as having private health insurance.
Statistical analysis: concentration indices
The concentration index is a quantitative measure that integrates health service use data from different categories. The concentration index value is the summary value for a concentration curve, which graphically depicts the cumulative proportion of a sample ranked by a variable of interest (eg, socio‐economic status, remoteness) and the cumulative proportion of a health‐based outcome at each level of this variable. The concentration index is defined as twice the area between the concentration curve and line of equality (range, –1 to 1); negative values indicate greater use of services by people in more disadvantaged groups, positive values greater use by people in less disadvantaged groups (Supporting Information).
Concentration indices were calculated for the entire sample, and stratified by private health insurance status, using the validated formula:17
in which μt (t = 1, … T) is the mean health care service use for the tth IRSD or remoteness level, ft is the population share for the IRSD or remoteness level, and Rt is the relative rank of the tth IRSD or remoteness level, indicating the cumulative proportion of the population to the midpoint of each group interval. This standard concentration index formula was used because health care use was measured as a ratio without negative values or meaningful zero point (Supporting Information).18 T‐values (with 95% confidence intervals, CIs) were calculated to determine whether concentration index values were significantly different from zero. Concentration curves for each health care service were generated by socio‐economic disadvantage and remoteness level. Bonferroni correction was applied to statistical significance values to protect against inflation of type 1 errors. All statistical analyses were undertaken in Stata 16.0 and Microsoft Excel.
Ethics approval
The human research ethics committees of the Townsville Hospital and Health Service (HREC/16/QTHS/11), the Australian Institute of Health and Welfare (EO2017/1/343), James Cook University (H6678), and the University of Queensland (2022/HE002538) approved the study. Queensland Health waived the requirement for individual consent for confidential data access under the Public Health Act (Qld) 2005.
Results
Of 106 571 cancer diagnoses in Queensland during 1 July 2011 – 30 June 2015, 15 645 were for primary diagnoses of invasive melanoma; 13 195 people were alive three years after diagnosis, of whom 13 174 were aged 18 years or older at diagnosis. Residential postcodes at diagnosis were available for the 13 145 people included in our analyses. The mean age of the included people was 60.0 years (standard deviation, 15.4 years), 7562 were men (58%), and 8198 lived in major cities (62%). A total of 7825 eligible cases were of stage IA melanoma (60%); the most frequent tumour sites were the trunk (4814 cases, 37%) and upper limbs and shoulders (3440, 26%) (Box 1).
Cancer stage
The proportion of invasive melanoma diagnoses that involved cancer stage 1A tumours was higher for the socio‐economically least disadvantaged group (65%) than for the most disadvantaged group (54%), but the influence of socio‐economic quintile and remoteness category on the proportions by cancer stage was not statistically significant (Box 2).
Socio‐economic disadvantage
Eighteen percent of people diagnosed with melanoma lived in areas in the socio‐economically most disadvantaged quintile; 26% of all public hospital admissions and 13% of all private hospital admissions were of people in this quintile. Seventeen percent of people diagnosed with melanoma lived in areas in the least disadvantaged quintile; 22% of all specialist consultations and biopsies were for people in this quintile (Box 3).
The estimated concentration indices indicated that admissions to public hospitals were more frequent and those to private hospitals less frequent among people in areas of greater socio‐economic disadvantage than among people living in areas of lesser disadvantage; consultations with specialists were more frequent for people from areas of lesser socio‐economic disadvantage (Box 4). Correspondingly, the concentration curve for public hospital admissions was consistently above the line of equality, and the curves for private hospital admissions and specialist services consistently below it (Supporting Information, figure 2). The concentration curve for biopsies was also below the line of equality, but the difference was not statistically significant (Supporting Information, figure 2; Box 4). Differences by socio‐economic disadvantage category for all hospital admissions, all MBS services, all PBS services, melanoma‐specific hospital admissions, general practitioner consultations, excisions, skin flaps/grafts, and pathology services were not statistically significant (Box 4; Supporting Information, figures 3–6). nor when analyses were stratified by private health insurance status (Supporting Information, table 2).
Concentration indices: remoteness
Sixty‐two percent of people lived in metropolitan areas; 71% of all private hospital admissions, 54% of all public hospital admissions, and 69% of all specialist consultations were for people in this remoteness group (Box 5).
The estimated concentration indices indicated that admissions to public hospitals were more frequent and those to private hospitals less frequent among people living in more remote areas; consultations with specialists were also less frequent than for people in metropolitan or inner regional areas (Box 4). Correspondingly, the concentration curve for public hospital admissions was above the line of equality, and the curves for private hospital admissions and specialist services below it (Supporting Information, figure 7). Differences by remoteness category were not statistically significant for other health service use, including all hospital admissions (Box 4; Supporting Information, figures 8–11), nor when analyses were stratified by private health insurance status (Supporting Information, table 2).
Discussion
We found few differences by socio‐economic status or remoteness in health care service use by people with primary diagnoses of invasive melanoma. The exceptions were that residents of less disadvantaged areas were admitted to private hospitals and used specialist services more frequently than people in more disadvantaged areas, and were less often admitted to public hospitals. Differences by socio‐economic or remoteness category between the proportions of people diagnosed with melanoma and the corresponding proportions using health care services were also small, and the concentration curves for most services were close to the line of equality. In summary, we did not find major differences in health care service use by people with primary melanoma diagnoses. As there were no significant differences in cancer stage at diagnosis by socio‐economic or remoteness category, we can also infer that the level of care received was not significantly influenced by residential location.
Australian clinical guidelines outline melanoma treatment and follow‐up pathways,19 and people can expect similar patterns of care, regardless of their location or socio‐economic status. Wide local excisions are recommended for the initial diagnosis of invasive melanoma and can be performed by general practitioners.19 In Australia, melanoma can be diagnosed and effectively treated in primary care, in contrast to other countries, and this treatment is subsidised by Medicare.20 Other treatment options, such as skin flaps and grafts, are undertaken less frequently; we found that rates were similar across geographic and socio‐economic categories.
Our findings regarding differences in health service use by people with melanoma mirror those of other studies examining health care services more broadly.21 We found that medical specialist service use was greater in areas of lesser socio‐economic disadvantage, while primary care and public hospital service use was greater in more disadvantaged areas. These differences are probably explained by the concentration of specialists in metropolitan areas, and socio‐economically better placed people being more able to afford specialist care.22 The more frequent specialist consultations for people in socio‐economically less disadvantaged areas may reflect over‐servicing, but conclusions of this type cannot be drawn from our analyses and require specific investigation.
The most marked difference in service use by residential location was for inpatient hospital care, consistent with other Australian reports that the public hospital admission rate increases with remoteness and declines with increasing socio‐economic status.23 Greater public hospital use by people from more disadvantaged areas requires further investigation, as early stage melanoma (most diagnoses) is typically managed by general practitioners.19 Improving access to general practitioners who can perform skin cancer surgery and surveillance in these areas could improve health outcomes and reduce the need for hospital care. Greater public hospital use by people in rural areas may reflect the limited availability of specialists and general practitioners. Whether people with newly diagnosed melanoma are seeking care in hospitals instead of visiting general practitioners should be investigated.
Australia has a mixed health care system in which services are provided in both the private and public sectors.24 One potential consequence of people from more advantaged areas more frequently using private hospitals and specialists is that the public system may have greater capacity to serve those in more disadvantaged areas. Providing skin cancer services of equivalent standard across a decentralised population is logistically difficult. Optimising service delivery to ensure maximal health benefits for everyone should remain the goal, using frameworks for reducing inequity in health care, such as the Australian Cancer Plan.8
Limitations
By analysing linked administrative data, we provided a comprehensive overview of health service use within three years of melanoma diagnosis. However, socio‐economic disadvantage and geographic remoteness are highly correlated; people living in remote areas are more than those in major cities to be in the lowest household income quintile.25 Further, levels of remoteness and socio‐economic disadvantage can vary within a postcode. The IRSD calculation, and consequently our analyses, do not take ethnic background into account. Although the proportion of people in the larger database with newly diagnosed melanoma who died of melanoma was small, excluding them from our analysis potentially introduced sampling bias by removing less well people who may have used health services more frequently. Our study included Medicare codes for all health care services relevant to people with melanoma, providing a broader assessment of variation beyond melanoma‐specific health care.
Conclusions
The medical services use of Queensland people with primary diagnoses of invasive melanoma does not vary markedly between locations in differing socio‐economic disadvantage and remoteness categories. However, greater use of specialist care in areas of lesser disadvantage could contribute to some inequity in health care.
Box 1 – Demographic characteristics of the 13 145 people diagnosed with invasive melanoma, Queensland, 1 July 2011 – 30 June 2015 included in our analyses
|
Characteristic |
Number |
||||||||||||||
|
|
|||||||||||||||
|
Gender |
|
||||||||||||||
|
Men |
7562 (58%) |
||||||||||||||
|
Women |
5583 (42%) |
||||||||||||||
|
Remoteness* |
|
||||||||||||||
|
Major city |
8198 (62%) |
||||||||||||||
|
Inner regional |
2926 (22%) |
||||||||||||||
|
Outer regional |
1800 (14%) |
||||||||||||||
|
Remote |
144 (1%) |
||||||||||||||
|
Very remote |
77 (1%) |
||||||||||||||
|
Socio‐economic disadvantage† |
|
||||||||||||||
|
Quintile 1 (most disadvantaged) |
2373 (18%) |
||||||||||||||
|
Quintile 2 |
2071 (16%) |
||||||||||||||
|
Quintile 3 |
3072 (23%) |
||||||||||||||
|
Quintile 4 |
3385 (26%) |
||||||||||||||
|
Quintile 5 (least disadvantaged) |
2244 (17%) |
||||||||||||||
|
Country of birth |
|
||||||||||||||
|
Australia |
10 743 (82%) |
||||||||||||||
|
Other |
2402 (18%) |
||||||||||||||
|
Private health insurance |
|
||||||||||||||
|
Yes |
6651 (51%) |
||||||||||||||
|
No |
6494 (49%) |
||||||||||||||
|
International Classification of Diseases for Oncology (ICD‐O) code |
|
||||||||||||||
|
Skin of trunk (C44.5) |
4814 (37%) |
||||||||||||||
|
Skin of upper limb and shoulder (C44.6) |
3440 (26%) |
||||||||||||||
|
Skin of lower limb and hip (C44.7) |
2697 (21%) |
||||||||||||||
|
Skin of other and unspecified parts of face (C44.3) |
883 (7%) |
||||||||||||||
|
Skin of scalp and neck (C44.4) |
800 (6%) |
||||||||||||||
|
Other sites of the skin‡ |
511 (3%) |
||||||||||||||
|
Cancer stage |
|
||||||||||||||
|
IA |
7825 (60%) |
||||||||||||||
|
IB |
1311 (10%) |
||||||||||||||
|
II (A/B) |
1184 (9%) |
||||||||||||||
|
III (A/B)§ |
783 (6%) |
||||||||||||||
|
IV |
332 (3%) |
||||||||||||||
|
Unknown/could not be calculated |
1710 (13%) |
||||||||||||||
|
|
|||||||||||||||
|
* Australian Statistical Geography Standard – Remoteness Area.15 † Socio‐Economic Indexes for Areas (SEIFA) Index of Relative Socioeconomic Disadvantage.16 ‡ Skin of lip, not otherwise specified (C44.0); eyelid (C44.1); external ear (C44.2); overlapping lesion of skin (C44.8) and skin, not otherwise specified (C44.9). § There were no stage IIIC tumours. |
|||||||||||||||
Box 2 – Diagnoses of invasive melanoma, Queensland, 1 July 2011 – 30 June 2015, by estimated cancer stage and postcode‐based socio‐economic status and remoteness at diagnosis
|
|
Socio‐economic disadvantage quintile* |
Remoteness† |
|||||||||||||
|
Cancer stage |
1 |
2 |
3 |
4 |
5 |
Very remote/remote |
Outer regional |
Inner regional |
Major city |
||||||
|
|
|||||||||||||||
|
IA |
1285 (54%) |
1196 (58%) |
1800 (59%) |
2079 (61%) |
1465 (65%) |
124 (56%) |
1055 (59%) |
1568 (54%) |
5078 (62%) |
||||||
|
IB |
272 (11%) |
204 (10%) |
300 (10%) |
340 (10%) |
195 (9%) |
24 (11%) |
187 (10%) |
334 (11%) |
773 (9%) |
||||||
|
IIA |
230 (10%) |
189 (9%) |
316 (10%) |
281 (8%) |
168 (7%) |
19 (9%) |
174 (10%) |
296 (10%) |
693 (8%) |
||||||
|
IIB |
67 (3%) |
49 (2%) |
88 (3%) |
73 (2%) |
34 (2%) |
15‡ (7%) |
40 (2%) |
87 (3%) |
181 (2%) |
||||||
|
IIIA |
82 (3%) |
83 (4%) |
132 (4%) |
120 (4%) |
68 (3%) |
66 (4%) |
113 (4%) |
299 (4%) |
|||||||
|
IIIB |
81 (3%) |
61 (3%) |
55 (2%) |
71 (2%) |
30 (1%) |
46 (3%) |
88 (3%) |
158 (2%) |
|||||||
|
IVA |
35 (1%) |
20 (1%) |
38 (1%) |
45 (1%) |
16 (1%) |
20 (1%) |
36 (1%) |
96 (1%) |
|||||||
|
IVB |
36 (2%) |
35 (2%) |
44 (1%) |
42 (1%) |
21 (1%) |
28 (2%) |
44 (2%) |
104 (1%) |
|||||||
|
Missing |
285 (12%) |
234 (11%) |
299 (10%) |
334 (10%) |
247 (11%) |
39 (18%) |
184 (10%) |
360 (12%) |
816 (10%) |
||||||
|
|
|||||||||||||||
|
* Index of Relative Socioeconomic Disadvantage16 (quintile 1 = most disadvantage, quintile 5 = least disadvantage). Differences in cancer stage proportions by quintile were not statistically significant (Bonferroni‐adjusted value for statistical significance: 0.004). † Australian Statistical Geography Standard – Remoteness Area.15 Differences in cancer stage proportions by remoteness category were not statistically significant (χ2 tests of independence; Bonferroni‐adjusted value for statistical significance: 0.004). ‡ Stage 2B or greater: numbers combined for remote categories (small cell numbers). |
|||||||||||||||
Box 3 – Diagnoses of invasive melanoma, Queensland, 1 July 2011 – 30 June 2015, and public or private hospital admissions, specialist consultations and biopsies, by socio‐economic disadvantage quintile*
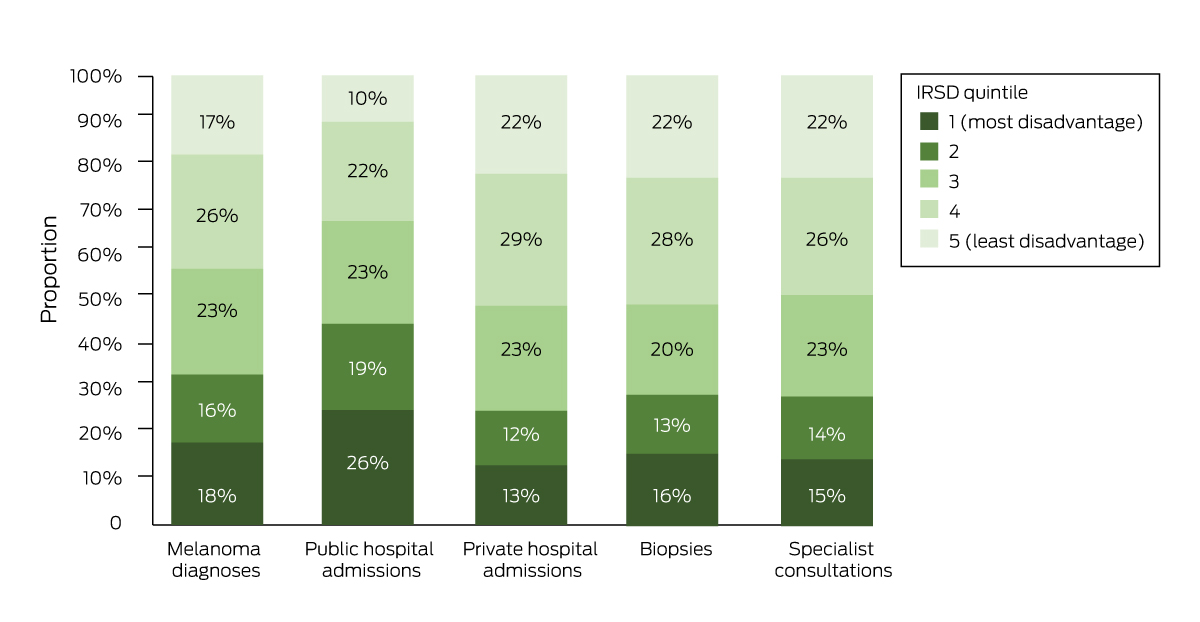
IRSD = Index of Relative Socioeconomic Disadvantage.16
* The raw data for this figure are included in the Supporting Information, table 3.
Box 4 – Concentration indices (with 95% confidence intervals) for health care service use by people diagnosed with invasive melanoma, Queensland, 1 July 2011 – 30 June 2015, by postcode‐based socio‐economic status and remoteness at diagnosis
|
Service |
Number of people |
Socio‐economic disadvantage |
Remoteness |
||||||||||||
|
|
|||||||||||||||
|
Hospital admissions |
11 301 |
0.01 (–0.01 to 0.04) |
0.03 (0.01 to 0.05) |
||||||||||||
|
Public hospital admissions |
6126 |
–0.15 (–0.19 to –0.12) |
–0.10 (–0.13 to –0.06) |
||||||||||||
|
Private hospital admissions |
8708 |
0.11 (0.07 to 0.15) |
0.10 (0.06 to 0.13) |
||||||||||||
|
Melanoma‐specific |
5947 |
0.05 (0.03 to 0.06) |
0.04 (0.02 to 0.05) |
||||||||||||
|
Medicare Benefits Schedule services |
13 259 |
–0.02 (–0.03 to –0.01) |
0.02 (0.01 to 0.03) |
||||||||||||
|
General practitioner visits |
13 120 |
–0.05 (–0.06 to –0.04) |
0.01 (–0.01 to 0.01) |
||||||||||||
|
Specialist attendances |
11 612 |
0.08 (0.07 to 0.10) |
0.07 (0.06 to 0.09) |
||||||||||||
|
Biopsies |
9120 |
0.03 (0.01 to 0.05) |
0.04 (0.02 to 0.07) |
||||||||||||
|
Excisions |
11 080 |
0.02 (–0.01 to 0.02) |
0.01 (–0.02 to 0.01) |
||||||||||||
|
Skin flap/grafts |
4898 |
–0.03 (–0.05 to –0.01) |
0.02 (–0.04 to 0.03) |
||||||||||||
|
Pathology services |
12 911 |
0.02 (0.01 to 0.03) |
0.03 (0.02 to 0.03) |
||||||||||||
|
Pharmaceutical Benefits Scheme services |
13 197 |
–0.06 (–0.07 to –0.05) |
–0.01 (–0.02 to 0.01) |
||||||||||||
|
|
|||||||||||||||
|
Bold: statistically significant at Bonferroni‐adjusted level of P < 0.0021. |
|||||||||||||||
Box 5 – Diagnoses of invasive melanoma, Queensland, 1 July 2011 – 30 June 2015, and public or private hospital admissions, specialist consultations and biopsies, by remoteness classification
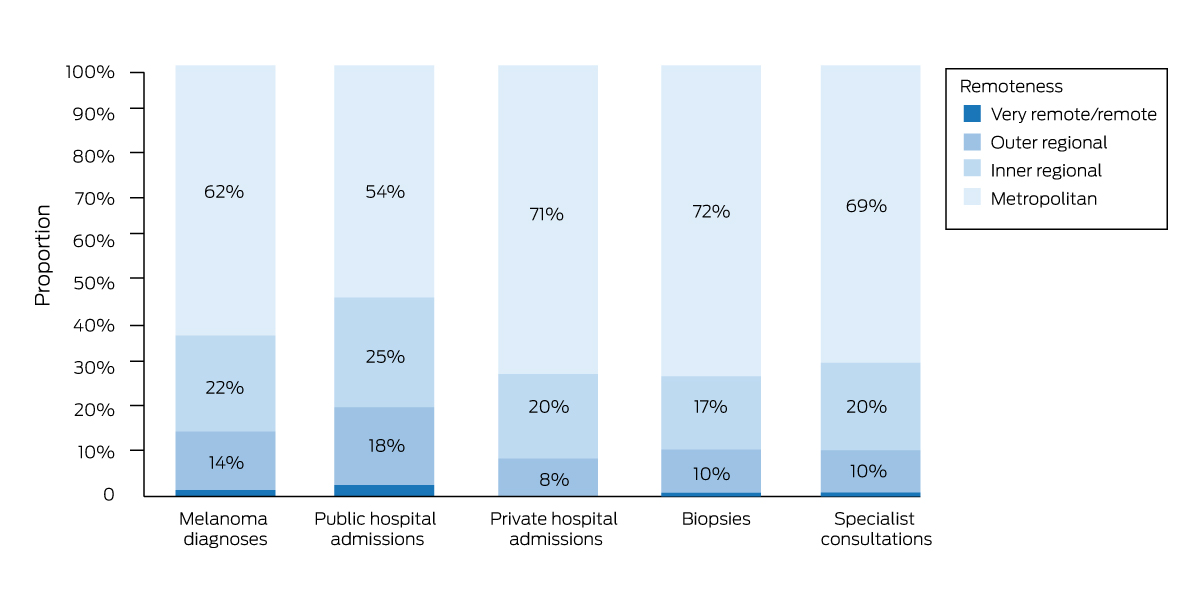
* The raw data for this figure are included in the Supporting Information, table 4.
Received 16 February 2023, accepted 5 September 2023
- Daniel Lindsay1,2
- David C Whiteman1,2
- Catherine M Olsen1,2
- Louisa G Gordon1,2,3
- 1 QIMR Berghofer Medical Research Institute, Brisbane, QLD
- 2 The University of Queensland, Brisbane, QLD
- 3 Queensland University of Technology, Brisbane, QLD
Correspondence: d.lindsay@uq.edu.au
Open access:
Open access publishing facilitated by The University of Queensland, as part of the Wiley – The University of Queensland agreement via the Council of Australian University Librarians.
Data access:
Institutional data restriction guidelines mean that only Daniel Lindsay had full access to all of the data analysed in this study. Further, the data underlying this study will not be available for sharing.
The CancerCostMod dataset is funded by the National Health and Medical Research Council (NHMRC)‐supported Centre of Research Excellence in Targeted Approaches To Improve Cancer Services for Aboriginal and Torres Strait Islander Australians (TACTICS; 1153027). David Whiteman is supported by an NHMRC Research Fellowship (1155413). We acknowledge Gail Garvey (University of Queensland) for providing access to the CancerCostMod dataset.
- 1. Arnold M, Singh D, Laversanne M, et al. Global burden of cutaneous melanoma in 2020 and projections to 2040. JAMA Dermatol 2022; 158: 495‐503.
- 2. Australian Institute of Health and Welfare. Skin cancer in Australia (AIHW Cat. no. CAN 96). Canberra: AIHW, 2016. https://www.aihw.gov.au/getmedia/0368fb8b‐10ef‐4631‐aa14‐cb6d55043e4b/18197.pdf (viewed Nov 2022).
- 3. Australian Institute of Health and Welfare. Cancer data in Australia (AIHW Cat. no. AUS 122). Updated 31 Aug 2023. https://www.aihw.gov.au/reports/cancer/cancer‐data‐in‐australia/contents/survival (viewed Nov 2022).
- 4. Davis LE, Shalin SC, Tackett AJ. Current state of melanoma diagnosis and treatment. Cancer Biol Ther 2019; 20: 1366‐1379.
- 5. Coory M, Smithers M, Aitken J, et al. Urban–rural differences in survival from cutaneous melanoma in Queensland. Aust N Z J Public Health 2006; 30: 71‐74.
- 6. Cramb SM, Duncan EW, Aitken JF, et al. Geographical patterns in melanoma incidence across Australia: can thickness differentials reveal the key drivers? Ann Cancer Epidemiol 2020; 4: 11.
- 7. Australian Department of Health. Australia's future health workforce: dermatology. May 2017. https://www.health.gov.au/sites/default/files/documents/2021/03/dermatology‐australia‐s‐future‐health‐workforce‐report.pdf (viewed Oct 2022).
- 8. Cancer Australia. The Australian Cancer Plan: consultation draft. 2022. https://engage.australiancancerplan.gov.au/projects/download/12702/ProjectDocument (viewed Sept 2023).
- 9. Wagstaff A, Paci P, van Doorslaer E. On the measurement of inequalities in health. Soc Sci Med 1991; 33: 545–557.
- 10. Queensland Statistician's Office. Queensland regions compared, Census 2021. Nov 2022. https://www.qgso.qld.gov.au/issues/11946/qld‐regions‐compared‐census‐2021.pdf (viewed Sept 2023).
- 11. Queensland Department of Health. The health of Queenslanders 2020: report of the Chief Health Officer. Nov 2020. https://www.health.qld.gov.au/__data/assets/pdf_file/0019/1011286/cho‐report‐2020‐full.pdf (viewed Oct 2022).
- 12. von Elm E, Altman DG, Egger M, et al. The Strengthening the Reporting of Observational Studies in Epidemiology (STROBE) statement: guidelines for reporting observational studies. J Clin Epidemiol 2008; 61: 344‐349.
- 13. Bates N, Callander E, Lindsay D, Watt K. CancerCostMod: a model of the healthcare expenditure, patient resource use, and patient co‐payment costs for Australian cancer patients. Health Econ Rev 2018; 8: 28.
- 14. Keung EZ, Gershenwald JE. The eighth edition American Joint Committee on Cancer (AJCC) melanoma staging system: implications for melanoma treatment and care. Expert Rev Anticancer Ther 2018; 18: 775‐784.
- 15. Australian Bureau of Statistics. The Australian Statistical Geography Standard (ASGS), edition 3. Reference period: July 2021 – June 2026. 20 July 2021. https://www.abs.gov.au/statistics/standards/australian‐statistical‐geography‐standard‐asgs‐edition‐3/jul2021‐jun2026 (viewed Nov 2022).
- 16. Australian Bureau of Statistics. Socio‐Economic Indexes for Areas (SEIFA), Australia. Reference period: 2021. 27 Apr 2023. https://www.abs.gov.au/statistics/people/people‐and‐communities/socio‐economic‐indexes‐areas‐seifa‐australia/latest‐release (viewed June 2023).
- 17. Kakwani N, Wagstaff A, van Doorslaer E. Socioeconomic inequalities in health: measurement, computation, and statistical inference. J Econom 1997; 77: 87‐103.
- 18. O'Donnell O, O'Neill S, Van Ourti T, Walsh B. conindex: Estimation of concentration indices. Stata J 2016; 16: 112‐138.
- 19. Cancer Council Australia Melanoma Guidelines Working Party. Clinical practice guidelines for the diagnosis and management of melanoma. Updated 22 Apr 2021. https://wiki.cancer.org.au/australiawiki/index.php?oldid=215123 (viewed Sept 2023).
- 20. Baade PD, Youl PH, English DR, et al. Clinical pathways to diagnose melanoma: a population‐based study. Melanoma Res 2007; 17: 243‐249.
- 21. Devaux M. Income‐related inequalities and inequities in health care services utilisation in 18 selected OECD countries. J Health Econ 2015; 16: 21‐33.
- 22. Pulok MH, van Gool K, Hall J. Inequity in physician visits: the case of the unregulated fee market in Australia. Soc Sci Med 2020; 255: 113004.
- 23. Australian Institute of Health and Welfare. Access to hospitals [website]. Updated 11 Aug 2023. https://www.aihw.gov.au/reports‐data/myhospitals/themes/hospital‐access (viewed Sept 2023).
- 24. Hall J, Savage E. The role of the private sector in the Australian healthcare system. In: Maynard A, editor. The public–private mix for health. Abingdon: Radcliffe Publishing; 2005: pp. 247‐278.
- 25. Australian Bureau of Statistics. Household income and wealth, Australia. Reference period: 2019–20 financial year (Cat. no. 6523.0). 28 Apr 2022. https://www.abs.gov.au/statistics/economy/finance/household‐income‐and‐wealth‐australia/latest‐release (viewed Dec 2022).
Abstract
Objective: To quantify differences, by residential remoteness and socio‐economic status, in health care service use by people diagnosed with invasive melanoma in Queensland.
Design: Benefit incidence analysis of CancerCostMod data, comprising Queensland Cancer Registry data linked with Queensland Hospital Admitted Patient Data Collection (QHAPDC), Medicare Benefits Schedule (MBS), and Pharmaceutical Benefits Scheme (PBS) data.
Setting, participants: Adults (18 years or older) newly diagnosed with invasive melanoma in Queensland during 1 July 2011 – 31 June 2015 and alive three years after diagnosis.
Main outcome measures: Concentration curves and indices quantifying differences by residential postcode‐based remoteness (Australian Statistical Geography Standard – Remoteness Area) and socio‐economic disadvantage (Index of Relative Socioeconomic Disadvantage) in hospital admissions (overall and by type) and use of MBS (overall and by type) and PBS services during the three years following diagnosis of invasive melanoma.
Results: A total of 13 145 adults diagnosed with invasive melanoma during 2011–15 were alive three years after the diagnosis. Public hospital admissions were more frequent for people living in areas of greater socio‐economic disadvantage (concentration index, –0.15; 95% confidence interval [CI], –0.19 to –0.12) or outside major cities (concentration index, –0.10; 95% CI, –0.13 to –0.06); private hospital admissions (concentration index, 0.11; 95% CI, 0.07–0.15) and specialist consultations (concentration index, 0.08; 95% CI, 0.07–0.10) were more frequent in areas of lesser disadvantage and in major cities (private hospital admissions: 0.10; 95% CI, 0.06–0.13; specialist services: 0.07; 95% CI, 0.06–0.09). Differences in other melanoma health care service use by residential remoteness and socio‐economic disadvantage were not statistically significant.
Conclusions: Variation in health care service use by Queenslanders with primary diagnoses of invasive melanoma by residential socio‐economic disadvantage and remoteness were generally minor. Our analysis suggests that access to health care for people with melanoma is fairly equitable in Queensland.