


The known: Diabetes mellitus, obesity, and components of the metabolic syndrome are risk factors for the progression of non‐alcoholic fatty liver disease (NAFLD) to decompensated cirrhosis, but their contributions to risk have not been examined in Australia.
The new: More than one‐third of people with NAFLD‐related cirrhosis and diabetes mellitus experienced cirrhosis complications within ten years.
The implications: As one in five people with diabetes mellitus have clinically significant hepatic fibrosis, the greater risk of progression to cirrhosis decompensation in people with both NAFLD and diabetes mellitus has important consequences for the future burden of NAFLD‐related disease in Australia.
About five million Australians have non‐alcoholic fatty liver disease (NAFLD), and the number is projected to rise to seven million by 2030.1 NAFLD can progress to adverse hepatic disease, such as cirrhosis and its complications, including hepatocellular carcinoma. Shared risk factors such as obesity and diabetes mellitus mean that people with NAFLD are also at risk of extrahepatic complications, including major adverse cardiovascular events and cancer.2 The mortality and morbidity associated with decompensated cirrhosis and hepatocellular carcinoma are substantial and cause very high health care costs.3 Although most people with NAFLD do not develop complications, identifying those at risk is vital for averting progression to cirrhosis in people without cirrhosis and to decompensation in those with cirrhosis.
Liver stiffness, a surrogate measure of hepatic fibrosis, predicts liver‐related complications in people with NAFLD.4 However, given that most do not develop complications, assessing fibrosis stage in the large number at risk may not be feasible. Diabetes mellitus, obesity, and components of the metabolic syndrome are associated with increased risk of progression,5 but many of the studies reporting such associations investigated highly selected groups of people with diagnosed liver disease, or follow‐up was limited.
Little information is available regarding the incidence of and risk factors for progression of NAFLD to decompensation in Australia. A recent Victorian study confirmed that increasing liver stiffness and comorbidity in people with NAFLD were independently associated with higher all‐cause mortality,6 but did not examine other predictors of progression to decompensated liver disease. As NAFLD progression may share risk factors with non‐hepatic disease, including major adverse cardiovascular events and cancer, we assessed the incidence of decompensated cirrhosis and associated risk factors in people hospitalised in Queensland with NAFLD or non‐alcoholic steatohepatitis (with or without cirrhosis).
Methods
We undertook a retrospective cohort study of people hospitalised with NAFLD or non‐alcoholic steatohepatitis (NASH) with or without cirrhosis in Queensland during 2007–19. We analysed linked data from the Queensland Hospital Admitted Patient Data Collection (QHAPDC), death registrations from the Queensland Registry of Births, Deaths and Marriages, and the Queensland Cancer Register.
Case selection
All hospitalisations in Queensland during 1 July 2007 – 31 December 2019 of Queensland residents aged at least 20 years with diagnoses of NAFLD or NASH were identified in the QHAPDC by the Statistical Analysis Linkage Unit of the Queensland Department of Health. Consistent with the expert panel consensus statement for the definition of NAFLD for electronic health care records data analyses,7 eligible index hospitalisations were those coded with International Classification of Diseases, tenth revision, Australian modification (ICD‐10‐AM) codes for NAFLD (K76.0), NASH (K75.8), or other and unspecified cirrhosis of liver (K74.6). We excluded hospitalisations of people admitted to hospital with other liver diseases (eg, alcoholic liver disease) during 1 July 2007 – 31 December 2019.
In our analysis, we included people with eligible index admission hospitalisations who were alive at least 30 days after discharge from hospital. We excluded cases with ICD‐10‐AM codes for liver decompensation (ascites [R18], jaundice [R17], hepatic encephalopathy [G31.2, G93.4], or oesophageal variceal bleeding [I85.0, I98.3]) prior to 1 July 2009, and people who had received a liver transplant or had hepatocellular carcinoma prior to their index admission. The look‐back period for each patient was at least two years (1 July 2007 – 30 June 2009); the follow‐up period was at least twelve months (1 January 2019 – 31 December 2019) (further details: Supporting Information, section 1).
Data sources
The Statistical Analysis Linkage Unit of the Queensland Department of Health undertook dataset linkage. Socio‐demographic data were obtained from the QHAPDC: age group at admission, gender, marital status, country of birth, place of residence, whether an interpreter was required, and Indigenous status. Place of residence was categorised by level of remoteness (Accessibility and Remoteness Index of Australia [ARIA+])8 and socio‐economic status (Index of Relative Advantage and Disadvantage).9 The presence of cirrhosis at the index admission was indicated by an ICD‐10‐AM code for unspecified cirrhosis of liver; comorbidity during the index admission was quantified with the Charlson comorbidity index.10
Outcome
The primary outcome was progression to decompensated cirrhosis, as indicated by an ICD‐10‐AM code for a first decompensation event (ascites, hepatic encephalopathy, or oesophageal variceal bleeding). Accuracy of identification of decompensation events in the QHAPDC is better for ascites and oesophageal variceal bleeding than for hepatic encephalopathy11 (Supporting Information, section 2).
Data analysis
Statistical analyses were performed in Stata 15.0. The cumulative incidence of decompensated cirrhosis was examined using the Kaplan–Meier method (failure function). People were followed until the first decompensation event, or data were censored at death, liver transplantation, hepatocellular carcinoma diagnosis, or 31 December 2019. We assessed differences in the cumulative incidence of decompensated cirrhosis according to selected socio‐demographic and clinical characteristics in separate multivariable Cox regression analyses for people with or without cirrhosis. The models included covariates identified in bivariable analyses, but also took into account recognised relationships between variables and their clinical relevance. We identified variables with the strongest association with progression to decompensated cirrhosis in a least absolute shrinkage and selection operators (LASSO) penalised Cox proportional hazards model. We report adjusted hazard ratios (aHRs) with 95% confidence intervals (CIs) (further details: Supporting Information, section 3).
We assessed whether hospital admission prior to the index admission were associated with progression to decompensated cirrhosis in a sensitivity analysis restricted to patients with at least one prior admission and including the variable “prior admission with a recorded diagnosis related to severity of liver disease” (ie, major cardiovascular events, diabetes mellitus, portal hypertension, varices).
Ethics approval
The study was approved by the Metro South (HREC/17/QPAH/23) and QIMR Berghofer human research ethics committees (P2209).
Results
During 1 July 2007 – 31 December 2019, there were 21 674 eligible hospitalisations of 14 488 individuals with NAFLD/NASH. After exclusions, 8006 patients were included in our analysis (10 082 admissions), including 4632 women (58%) (Box 1; Supporting Information, section 4) and 2514 people with diabetes mellitus (31%). Follow‐up information was available for a median 4.6 years (interquartile range [IQR], 2.7–7.2 years). At least one admission for an unrelated reason during the two years preceding the index NAFLD/NASH admission was recorded for 6775 patients (84.6%; median, four admissions; IQR, 2–8 admissions).
Progression to decompensated cirrhosis
Three hundred and fifty‐one people (4.4%) progressed to decompensated cirrhosis during the follow‐up period; compared with the 7655 people who did not, larger proportions were aged 50 years or more (314 people, 89.5% v 4925, 64.3%), had cirrhosis at the index admission (200, 57.0% v 906, 11.8%), or had diabetes mellitus (185, 52.7% v 2329, 30.4%) or extrahepatic cancers (41, 12% v 298, 3.9%) (Box 1).
Of the 1106 people with cirrhosis at the index admission, 32.4% (95% CI, 27.2–38.3%) had progressed to decompensated cirrhosis within ten years (mean, 5.5% per year; 95% CI, 4.8–6.3% per year); the median time to decompensation was 2.5 years (IQR, 1.2–4.9 years). Of the 6900 people without cirrhosis, 4.5% (95% CI, 3.6–5.7%) had progressed to decompensated cirrhosis within ten years (mean, 0.5% per year; 95% CI, 0.4–0.6% per year); the median time to decompensation was 4.1 years (IQR, 2.4–6.6 years).
Among people without cirrhosis at the index admission, the risk of progression was greater for older people (v 20–39 years: 70 years or older, aHR, 4.7; 95% CI, 2.0–11.0; 60–69 years, aHR, 4.5; 95% CI, 2.0–10.2), and for those with extrahepatic cancer (aHR, 5.0; 95% CI, 3.0–8.2), a history of major adverse cardiovascular events (aHR, 1.9; 95% CI, 1.2–3.1), or diabetes mellitus (aHR, 2.8; 95% CI, 2.0–3.9) (Box 2). Among people with cirrhosis at the index admission, risk of progression was greater for those with portal hypertension (aHR, 1.8; 95% CI, 1.3–2.7), extrahepatic cancer (aHR, 1.8; 95% CI, 1.1–2.9), or diabetes mellitus (aHR, 1.5; 95% CI, 1.1–2.0) (Supporting Information, table 2).
The sensitivity analysis indicated that including prior admission with a diagnosis related to severity of liver disease as a variable did not increase the information content of either model beyond that of the main analyses (Supporting Information, section 5).
Progression to decompensated cirrhosis, by cirrhosis and diabetes mellitus status
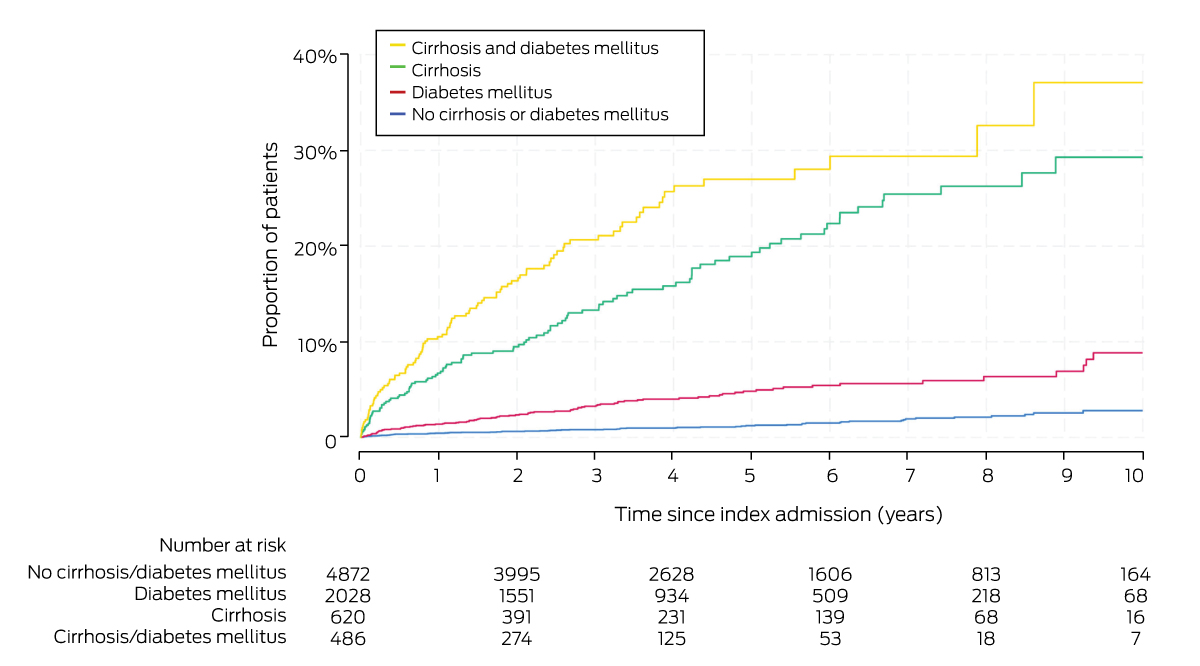
Diabetes mellitus was the most frequent other medical condition at the index admission of people who progressed to decompensated cirrhosis (185 of 351; 53%). Of the 486 people with cirrhosis and diabetes mellitus, 10.5% (95% CI, 8.1–13.7%) progressed to decompensated cirrhosis within twelve months and 37.1% (95% CI, 26.8–49.8%) within ten years (mean, 7.1% per year; 95% CI, 5.8–8.7% per year). Compared with people without cirrhosis or diabetes, the risk of progression was greater for people with cirrhosis and diabetes mellitus (aHR, 14.4; 95% CI, 10.1–20.6) or cirrhosis only (aHR, 10.7; 95% CI, 7.6–15.0) (Box 3, Box 4).
Progression to decompensated cirrhosis, by colorectal cancer status
Three hundred and thirty‐nine people had extrahepatic cancers at the index admission (4.2%), of whom 145 had cancers of digestive organs (43%). Twenty‐eight of 41 people with extrahepatic cancers who progressed to decompensated cirrhosis (68%) and 117 of 298 who did not progress (39%) had cancers of the digestive organs. The proportion of haematopoietic and lymphoid malignancies was smaller for people who progressed to decompensated cirrhosis (fewer than five, less than 10%) than for those who did not (64, 22%), and that of colorectal cancers larger (18, 44% v 70, 22%) (Supporting Information, table 3). After adjustment for the same covariates as in the main analysis, people without cirrhosis who had colorectal cancer at their index admission were more likely to progress to decompensated cirrhosis than those without colorectal cancer (aHR, 10.5; 95% CI, 5.2–21.2); the difference was not statistically significant for people with cirrhosis at their index admission (aHR, 1.4; 95% CI, 0.7–2.8) (Supporting Information, table 4).
Cofactors for people with NAFLD/NASH who progressed to cirrhosis decompensation
Among the people who did not have cirrhosis at the index admission, at least two of four major factors (diabetes mellitus, aged 50 years or older, hypertension, major adverse cardiovascular events) applied to 88 of those who progressed to cirrhosis decompensation (58%) and 1995 people who did not (30%). The proportion of people who experienced cirrhosis decompensation increased with the number of factors that affected them; 22.5% of those with all four factors reached this endpoint within ten years (mean, 1.8% per year; 95% CI, 1.0–3.4% per year) (Box 5). Compared with patients with none of the factors, the risk of progression was significantly greater for people with all four factors (aHR, 13.6; 95% CI, 1.4–135) (Box 6).
Discussion
We found that NAFLD often progresses to decompensated liver disease, and that several factors are associated with this outcome. In particular, 37.1% of people with NAFLD‐related cirrhosis and diabetes mellitus progressed to decompensated cirrhosis within ten years (mean, 7.1% per year). This finding is important, as 4.6% of Australians were living with type 2 diabetes in 2021 and the prevalence of clinically significant fibrosis in people with diabetes mellitus is 15–20%.12,13 Our finding reinforces concerns about the future burden of NAFLD‐related liver disease in Australia.1 Health care use and costs are high for people with decompensated cirrhosis because of the required investigation and management of liver‐related complications, long hospital stays, and high re‐admission rates.14
Progression to decompensation was also more frequent among people with NAFLD/NASH who had diabetes mellitus but not cirrhosis at the index admission (8.9% within ten years) than for those who had neither cirrhosis nor diabetes mellitus (2.8% within ten years). Other factors, such as age, hypertension, extrahepatic cancer, and history of major adverse cardiovascular events, also influenced the risk of progression. Further, the effect of these factors was cumulative; the risk of progression to decompensation was thirteen times as high for people aged 50 years or more who had diabetes mellitus, a history of major adverse cardiovascular events, and hypertension than for people with none of these risk factors.
Ours is the first population‐based study to examine risk factors for hepatic decompensation in people with NAFLD/NASH admitted to Australian hospitals. Our findings are consistent with overseas reports that the rate of progression to cirrhosis and liver‐related complications is significantly higher among people with NAFLD who have diabetes mellitus.12,15 The relationship between NAFLD and diabetes mellitus is complex and bidirectional. Steatosis in the liver leads to hepatic insulin resistance, and the prevalence of diabetes mellitus increases with the severity of NAFLD. Diabetes mellitus accelerates the progression of NAFLD because of its impact on lipotoxicity, mitochondrial dysfunction, oxidative stress, and changes in the gut microbiota, as well as systemic inflammation.16,17
Despite the risk of progressive liver disease, the leading causes of death for people with NAFLD are cardiovascular disease and extrahepatic malignancy. Several18 but not all19 studies have reported risks of major adverse cardiovascular events and extrahepatic cancers, particularly colorectal cancer, in people with NAFLD, but these associations may be confounded by shared metabolic dysfunction related to obesity and diabetes mellitus driving systemic inflammation and changes in the gut microbiota and secondary bile acid levels.20 Nevertheless, our finding of relationships between several medical conditions and the risk of NAFLD progression to decompensation indicates the multisystem nature of metabolic dysregulation and the need for a holistic approach to management. We hope our report raises awareness among clinicians caring for people with cardiometabolic disease or cancer that NAFLD is not a rare condition and their patients may be at risk of developing cirrhosis and its complications.
In our study, 84.6% of people had been admitted to hospital at least once for an unrelated reason prior to their index NAFLD/NASH admission. It may consequently have been possible to detect NAFLD sooner. Early recognition is integral to providing timely fibrosis risk assessment and treatment to slow disease progression, and for referring people with advanced fibrosis for hepatology care. Weight reduction, increased physical activity, and management of metabolic factors are the cornerstones of treatment, but the potential benefits of newer diabetes mellitus pharmacotherapy with heart‐ and kidney‐protective effects (glucagon‐like peptide‐1 receptor agonists) for treating NAFLD is being evaluated in clinical trials.21 To improve patient outcomes and reduce the burden of NAFLD on the health care system, all clinicians should be more engaged with identifying and treating NAFLD.
Limitations
Variability in QHAPDC data capture may have led to misclassification of factors and other medical conditions. Identifying cases of NAFLD/NASH on the basis of ICD‐10‐AM codes may underestimate its prevalence by as much as 43%,22 but excluding people with histories of other liver disease23 and the high positive predictive value and specificity of ICD‐10‐AM codes for NAFLD/NASH22 minimised the risk of diagnosis misclassification in included cases. Accuracy of identifying decompensated cirrhosis in the QHAPDC is high,11 but QHAPDC data are inadequate for assessing the severity of liver disease on the basis of fibrosis scores. This is an important limitation, as fibrosis stage is a strong predictor of individual prognosis.24,25 The proportion of people lost to follow‐up through interstate or overseas migration was probably small and similar to that of the non‐Queensland residents we excluded (fewer than 2%). Our hospital‐based study may not be representative of people with NAFLD/NASH in the general population. Future analyses of population‐based data, including assessment of alcohol use, could reduce bias and examine the contribution of alcohol use to the progression of liver disease in the general population.
Conclusion
Given the greater risk of progression to cirrhosis decompensation for people with NAFLD/NASH who also have diabetes mellitus, identifying those with advanced fibrosis and providing appropriate treatment to avert disease progression is vital.
Box 1 – Socio‐demographic and clinical characteristics at index hospital admission for 8006 people with non‐alcoholic fatty liver disease or non‐alcoholic steatohepatitis with or without cirrhosis, by subsequent progression to decompensated cirrhosis
|
Characteristic |
All patients |
No progression |
Progression |
||||||||||||
|
|
|||||||||||||||
|
Number of people |
8006 |
7655 |
351 |
||||||||||||
|
Gender |
|
|
|
||||||||||||
|
Men |
3374 (42.1%) |
3201 (41.8%) |
173 (49.3%) |
||||||||||||
|
Women |
4632 (57.9%) |
4454 (58.2%) |
178 (50.7%) |
||||||||||||
|
Age group (years) |
|
|
|
||||||||||||
|
20–39 |
1384 (17.3%) |
1369 (17.9%) |
15 (4.3%) |
||||||||||||
|
40–49 |
1383 (17.3%) |
1361 (17.8%) |
22 (6.3%) |
||||||||||||
|
50–59 |
1877 (23.4%) |
1796 (23.5%) |
81 (23.1%) |
||||||||||||
|
60–69 |
1816 (22.7%) |
1697 (22.2%) |
119 (33.9%) |
||||||||||||
|
70 or more |
1546 (19.3%) |
1432 (18.7%) |
114 (32.5%) |
||||||||||||
|
Marital status |
|
|
|
||||||||||||
|
Married |
4056 (60.3%) |
3854 (60.2%) |
202 (63.5%) |
||||||||||||
|
No partner |
2667 (39.7%) |
2551 (39.8%) |
116 (36.5%) |
||||||||||||
|
Missing data |
1283 |
1250 |
33 |
||||||||||||
|
Country of birth |
|
|
|
||||||||||||
|
Australia |
6254 (78.5%) |
5983 (78.5%) |
271 (77.4%) |
||||||||||||
|
New Zealand, Oceania |
455 (5.7%) |
440 (5.8%) |
15 (4.3%) |
||||||||||||
|
Europe, the Americas |
871 (10.9%) |
822 (10.8%) |
49 (14.0%) |
||||||||||||
|
Asia, Africa, Middle East |
388 (4.9%) |
373 (4.9%) |
15 (4.3%) |
||||||||||||
|
Missing data |
38 |
37 |
< 5 |
||||||||||||
|
Indigenous status |
|
|
|
||||||||||||
|
Non‐Indigenous |
7547 (94.5%) |
7215 (94.5%) |
332 (94.6%) |
||||||||||||
|
Indigenous |
439 (5.5%) |
420 (5.5%) |
19 (5.4%) |
||||||||||||
|
Missing data |
20 |
20 |
0 |
||||||||||||
|
Remoteness of residence (ARIA+) |
|
|
|
||||||||||||
|
Major city |
4731 (59.1%) |
4525 (59.1%) |
206 (58.7%) |
||||||||||||
|
Inner regional |
1709 (21.3%) |
1614 (21.1%) |
95 (27.1%) |
||||||||||||
|
Outer regional |
1346 (16.8%) |
1299 (17.0%) |
47 (13.4%) |
||||||||||||
|
Remote/very remote |
220 (2.7%) |
217 (2.8%) |
< 5 |
||||||||||||
|
Socio‐economic status (IRSAD quartile) |
|
|
|
||||||||||||
|
1 (least disadvantaged) |
1421 (17.7%) |
1370 (17.9%) |
51 (14.5%) |
||||||||||||
|
2 |
1524 (19.0%) |
1450 (18.9%) |
74 (21.1%) |
||||||||||||
|
3 |
1435 (17.9%) |
1380 (18.0%) |
55 (15.7%) |
||||||||||||
|
4 |
1689 (21.1%) |
1612 (21.1%) |
77 (21.9%) |
||||||||||||
|
5 (most disadvantaged) |
1937 (24.2%) |
1843 (24.1%) |
94 (26.8%) |
||||||||||||
|
Hospital type |
|
|
|
||||||||||||
|
Public |
4163 (52.0%) |
3963 (51.8%) |
200 (57.0%) |
||||||||||||
|
Private or mix |
3843 (48.0%) |
3692 (48.2%) |
151 (43.0%) |
||||||||||||
|
Interpreter required* |
131 (1.7 %) |
118 (1.6%) |
13 (3.8%) |
||||||||||||
|
Cirrhosis |
1106 (13.8%) |
906 (11.8%) |
200 (57.0%) |
||||||||||||
|
Portal hypertension† |
159 (2.0%) |
119 (1.6%) |
40 (11.4%) |
||||||||||||
|
Charlson comorbidity index |
|
|
|
||||||||||||
|
0 |
4711 (58.8%) |
4586 (59.9%) |
125 (35.6%) |
||||||||||||
|
1 |
632 (7.9%) |
596 (7.8%) |
36 (10.3%) |
||||||||||||
|
2 |
1510 (18.9%) |
1426 (18.6%) |
84 (23.9%) |
||||||||||||
|
3 |
1153 (14.4%) |
1047 (13.7%) |
106 (30.2%) |
||||||||||||
|
Metabolic syndrome (features) |
|
|
|
||||||||||||
|
0 |
3865 (48.3%) |
3719 (48.6%) |
146 (41.6%) |
||||||||||||
|
1 |
2619 (32.7%) |
2514 (32.8%) |
105 (29.9%) |
||||||||||||
|
2 |
1140 (14.2%) |
1062 (13.9%) |
78 (22.2%) |
||||||||||||
|
3 |
312 (3.9%) |
295 (3.9%) |
17 (4.8%) |
||||||||||||
|
4 |
70 (0.9%) |
65 (0.8%) |
5 (1.4%) |
||||||||||||
|
Diabetes mellitus |
2514 (31.4%) |
2329 (30.4%) |
185 (52.7%) |
||||||||||||
|
Obesity |
2224 (27.8%) |
2149 (28.1%) |
75 (21.4%) |
||||||||||||
|
Hypertension |
1086 (13.6%) |
1032 (13.5%) |
54 (15.4%) |
||||||||||||
|
Major adverse cardiovascular events‡ |
663 (8.3%) |
625 (8.2%) |
38 (10.8%) |
||||||||||||
|
Renal disease |
349 (4.4%) |
326 (4.3%) |
23 (6.6%) |
||||||||||||
|
Chronic pulmonary disease |
266 (3.3%) |
253 (3.3%) |
13 (3.7%) |
||||||||||||
|
Extrahepatic cancers§ |
339 (4.2%) |
298 (3.9%) |
41 (11.7%) |
||||||||||||
|
Disorders of lipoprotein metabolism |
291 (3.6%) |
273 (3.6%) |
18 (5.1%) |
||||||||||||
|
|
|||||||||||||||
|
ARIA+ = Accessibility and Remoteness Index of Australia;8 IRSAD = Index of Relative Socioeconomic Advantage and Disadvantage.9 * Missing data: 291 patients (no progression: 280; progression: 11). † No patient had varices at index admission. ‡ Four Charlson comorbidity index items: myocardial infarction, congestive heart failure, peripheral vascular disease, cerebrovascular disease. § Any cancer except hepatocellular carcinoma. |
|||||||||||||||
Box 2 – Progression to decompensated cirrhosis in 6900 people who did not have cirrhosis at index admission with non‐alcoholic fatty liver disease or non‐alcoholic steatohepatitis: Cox regression analysis of socio‐demographic and clinical characteristics
|
Characteristic |
No progression |
Progression |
Hazard ratio (95% CI) |
Adjusted hazard ratio (95% CI)* |
|||||||||||
|
|
|||||||||||||||
|
Number of people |
6749 |
151 |
|
|
|||||||||||
|
Gender |
|
|
|
|
|||||||||||
|
Men |
2740 (40.6%) |
68 (45.0%) |
1 |
NA |
|||||||||||
|
Women |
4009 (59.4%) |
83 (55.0%) |
0.8 (0.6–1.2) |
|
|||||||||||
|
Age group (years) |
|
|
|
|
|||||||||||
|
20–39 |
1331 (19.7%) |
7 (4.6%) |
1 |
1 |
|||||||||||
|
40–49 |
1295 (19.2%) |
14 (9.3%) |
2.0 (0.8–4.9) |
1.6 (0.7–4.1) |
|||||||||||
|
50–59 |
1631 (24.2%) |
42 (27.8%) |
4.6 (2.1–10.3) |
3.5 (1.6–7.9) |
|||||||||||
|
60–69 |
1442 (21.4%) |
50 (33.1%) |
6.6 (3.0–14.5) |
4.5 (2.0–10.2) |
|||||||||||
|
70 or more |
1050 (15.6%) |
38 (25.2%) |
7.9 (3.5–17.6) |
4.7 (2.0–11.0) |
|||||||||||
|
Marital status |
|
|
|
|
|||||||||||
|
Married |
3467 (61.2%) |
91 (65.9%) |
1 |
NA |
|||||||||||
|
No partner |
2196 (38.8%) |
47 (34.1%) |
1.0 (0.7–1.4) |
|
|||||||||||
|
Missing data |
1086 |
13 |
|
|
|||||||||||
|
Country of birth |
|
|
|
|
|||||||||||
|
Australia |
5288 (78.8%) |
116 (77.3%) |
1 |
NA |
|||||||||||
|
New Zealand, Oceania |
401 (6.0%) |
9 (6.0%) |
1.0 (0.5–2.1) |
|
|||||||||||
|
Europe, the Americas |
689 (10.3%) |
20 (13.3%) |
1.3 (0.8–2.1) |
|
|||||||||||
|
Asia, Africa, Middle East |
336 (5.0%) |
5 (3.3%) |
0.7 (0.3–1.8) |
|
|||||||||||
|
Missing data |
35 |
< 5 |
|
|
|||||||||||
|
Indigenous status |
|
|
|
|
|||||||||||
|
Non‐Indigenous |
6358 (94.5%) |
142 (94.0%) |
1 |
1 |
|||||||||||
|
Indigenous |
372 (5.5%) |
9 (6.0%) |
1.1 (0.6–2.2) |
1.3 (0.6–2.5) |
|||||||||||
|
Missing data |
19 |
0 |
|
|
|||||||||||
|
Remoteness of residence (ARIA+) |
|
|
|
|
|||||||||||
|
Major city |
3972 (58.9%) |
87 (57.6%) |
1 |
1 |
|||||||||||
|
Inner regional |
1424 (21.1%) |
42 (27.8%) |
1.3 (0.9–1.9) |
1.2 (0.8–1.8) |
|||||||||||
|
Outer regional/remote/very remote |
1353 (20.0%) |
22 (14.6%) |
0.8 (0.5–1.3) |
0.9 (0.5–1.4) |
|||||||||||
|
Socio‐economic status (IRSAD) |
|
|
|
|
|||||||||||
|
1 (least disadvantaged) |
1228 (18.2%) |
23 (15.2%) |
1 |
NA |
|||||||||||
|
2 |
1304 (19.3%) |
30 (19.9%) |
1.3 (0.7–2.2) |
|
|||||||||||
|
3 |
1215 (18.0%) |
24 (15.9%) |
1.0 (0.6–1.8) |
|
|||||||||||
|
4 |
1396 (20.7%) |
35 (23.2%) |
1.3 (0.8–2.3) |
|
|||||||||||
|
5 (most disadvantaged) |
1606 (23.8%) |
39 (25.8%) |
1.3 (0.8–2.2) |
|
|||||||||||
|
Hospital type |
|
|
|
|
|||||||||||
|
Public |
3412 (50.6%) |
88 (58.3%) |
1 |
1 |
|||||||||||
|
Private or mix |
3337 (49.4%) |
63 (41.7%) |
0.7 (0.5–1.0) |
0.8 (0.5–1.1) |
|||||||||||
|
Interpreter required† |
98 (1.5%) |
6 (4.1%) |
0.4 (0.2–0.8) |
2.3 (1.0–5.3) |
|||||||||||
|
Charlson comorbidity index |
|
|
|
|
|||||||||||
|
0 |
4225 (62.6%) |
45 (29.8%) |
1 |
NA |
|||||||||||
|
1 |
439 (6.5%) |
7 (4.6%) |
1.5 (0.7–3.4) |
|
|||||||||||
|
2 |
1221 (18.1%) |
35 (23.2%) |
3.0 (1.9–4.6) |
|
|||||||||||
|
3 |
864 (12.8%) |
64 (42.4%) |
7.7 (5.3–11.3) |
|
|||||||||||
|
Metabolic syndrome (features) |
|
|
|
|
|||||||||||
|
0 |
3283 (48.6%) |
55 (36.4%) |
1 |
NA |
|||||||||||
|
1 |
2204 (32.7%) |
39 (25.8%) |
1.3 (0.9–1.9) |
|
|||||||||||
|
2 |
929 (13.8%) |
39 (25.8%) |
3.0 (2.0–4.6) |
|
|||||||||||
|
3 |
272 (4.0%) |
14 (9.3%) |
2.9 (1.6–5.1) |
|
|||||||||||
|
4 |
61 (0.9%) |
< 5 (< 1.0%) |
3.1 (1.1–8.4) |
|
|||||||||||
|
Diabetes mellitus |
1942 (28.8%) |
86 (57.0%) |
3.5 (2.5–4.8) |
2.8 (2.0–3.9) |
|||||||||||
|
Obesity |
2011 (29.8%) |
38 (25.2%) |
1.0 (0.7–1.4) |
NA |
|||||||||||
|
Hypertension |
908 (13.5%) |
34 (22.5%) |
1.7 (1.2–2.5) |
0.7 (0.5–1.1) |
|||||||||||
|
Major adverse cardiovascular events‡ |
489 (7.2%) |
24 (15.9%) |
2.7 (1.7–4.1) |
1.9 (1.2–3.1) |
|||||||||||
|
Renal disease |
241 (3.6%) |
13 (8.6%) |
2.9 (1.6–5.1) |
NA |
|||||||||||
|
Chronic pulmonary disease |
200 (3.0%) |
5 (3.3%) |
1.2 (0.5–2.8) |
NA |
|||||||||||
|
Extrahepatic cancers§ |
222 (3.3%) |
20 (13.2%) |
5.6 (3.5–8.9) |
5.0 (3.0–8.2) |
|||||||||||
|
Disorders of lipoprotein metabolism |
261 (3.9%) |
17 (11.3%) |
2.5 (1.5–4.1) |
NA |
|||||||||||
|
|
|||||||||||||||
|
CI = confidence interval; ARIA+ = Accessibility and Remoteness Index of Australia;8 IRSAD = Index of Relative Socioeconomic Advantage and Disadvantage;9 NA = not applicable (not included in final model). * Adjusted for age group, Indigenous status, remoteness of residence, hospital type, interpreter required, diabetes mellitus, hypertension, major adverse cardiovascular event, and extrahepatic cancer. † Missing data: 251 patients (no progression); fewer than five patients (progression). ‡ Four Charlson comorbidity index items: myocardial infarction, congestive heart failure, peripheral vascular disease, cerebrovascular disease. § Any cancer apart from hepatocellular carcinoma. |
|||||||||||||||
Box 3 – Cumulative incidence of decompensated cirrhosis by cirrhosis and diabetes mellitus status at index hospital admission for 8006 people with non‐alcoholic fatty liver disease or non‐alcoholic steatohepatitis
|
|
|
Proportion of people who progressed to decompensated cirrhosis (95% CI) |
|
|
|||||||||||
|
Characteristic |
Number |
12 months* |
10 years: total* |
Mean increase per year† |
Hazard ratio (95% CI) |
Adjusted hazard ratio‡ (95% CI) |
|||||||||
|
|
|||||||||||||||
|
Number of people |
8006 |
|
|
|
|
|
|||||||||
|
Cirrhosis and diabetes mellitus |
486 (6.1%) |
10.5% (8.1–13.7%) |
37.1% (26.8–49.8%) |
7.1% (5.8–8.7%) |
23.1 (16.9–31.6) |
14.4 (10.1–20.6) |
|||||||||
|
Cirrhosis only |
620 (7.7%) |
6.7% (5.0–9.1%) |
29.3% (23.3–36.4%) |
4.5% (3.7–5.4%) |
15.3 (11.2–20.9) |
10.7 (7.6–15.0) |
|||||||||
|
Diabetes mellitus only |
2028 (25.3%) |
1.4% (0.1–2.0%) |
8.9% (6.4–12.2%) |
1.0% (0.8–1.2%) |
3.5 (2.5–4.8) |
2.9 (2.1–4.1) |
|||||||||
|
No cirrhosis or diabetes mellitus |
4872 (60.9%) |
0.5% (0.3–0.7%) |
2.8% (2.0–3.9%) |
0.3% (0.2–0.4%) |
1 |
1 |
|||||||||
|
|
|||||||||||||||
|
CI = confidence interval (CI). * Derived from the Kaplan–Meier failure function. † Cox regression analysis. ‡ Adjusted for age group, portal hypertension, major cardiovascular events, and cancer (excluding hepatocellular carcinoma). |
|||||||||||||||
Box 4 – Cumulative incidence of decompensated cirrhosis by cirrhosis and diabetes mellitus status at index hospital admission for 8006 people with non‐alcoholic fatty liver disease or non‐alcoholic steatohepatitis: Kaplan–Meier analysis
Box 5 – Cumulative incidence of decompensated cirrhosis in 6900 people who did not have cirrhosis at index admission with non‐alcoholic fatty liver disease or non‐alcoholic steatohepatitis, by cumulative number of factors*
|
|
|
Proportion of people who experienced decompensated cirrhosis (95% CI) |
|
|
|||||||||||
|
Characteristic |
Number |
12 months† |
10 years: total† |
Mean increase per year‡ |
Hazard ratio (95% CI) |
Adjusted hazard ratio§ (95% CI) |
|||||||||
|
|
|||||||||||||||
|
Number of people |
6900 |
|
|
|
|
|
|||||||||
|
None |
2057 (29.8%) |
0.2% (0.1–0.5%) |
1.1% (0.6–2.0%) |
0.1% (0.1–0.2%) |
1 |
1 |
|||||||||
|
One factor |
2760 (40.0%) |
0.5% (0.3–0.9%) |
3.6% (2.6–5.0%) |
0.4% (0.3–0.5%) |
3.2 (1.7–6.0) |
1.7 (0.5–5.5) |
|||||||||
|
Two factors |
1399 (20.3%) |
1.5% (1.0–2.3%) |
5.7% (3.7–8.7%) |
0.9% (0.7–1.2%) |
7.3 (3.9–13.7) |
3.1 (0.5–17.6) |
|||||||||
|
Three factors |
558 (8.1%) |
1.6% (0.9–3.1%) |
11.1% (6.6–18.4%) |
1.0% (0.7–1.5%) |
8.3 (4.2–16.4) |
6.0 (0.8–47.1) |
|||||||||
|
Four factors |
126 (1.8%) |
1.7% (0.4–6.7%) |
22.5% (10.8–43.2%) |
1.8% (1.0–3.4%) |
14.5 (6.3–33.3) |
13.6 (1.4–135) |
|||||||||
|
|
|||||||||||||||
|
CI = confidence interval. * Diabetes mellitus; aged 50 years or older; hypertension; major adverse cardiovascular event. † Derived from the Kaplan–Meier failure function. ‡ Cox regression analysis. § Adjusted for aged 50 years or older, Indigenous status, remoteness of residence, hospital type, interpreter required, diabetes mellitus, hypertension, major adverse cardiovascular event, and extrahepatic cancer. |
|||||||||||||||
Box 6 – Cumulative incidence of decompensated cirrhosis in 6900 people who did not have cirrhosis at index admission with non‐alcoholic fatty liver disease or non‐alcoholic steatohepatitis, by cumulative number of factors:* Kaplan–Meier analysis
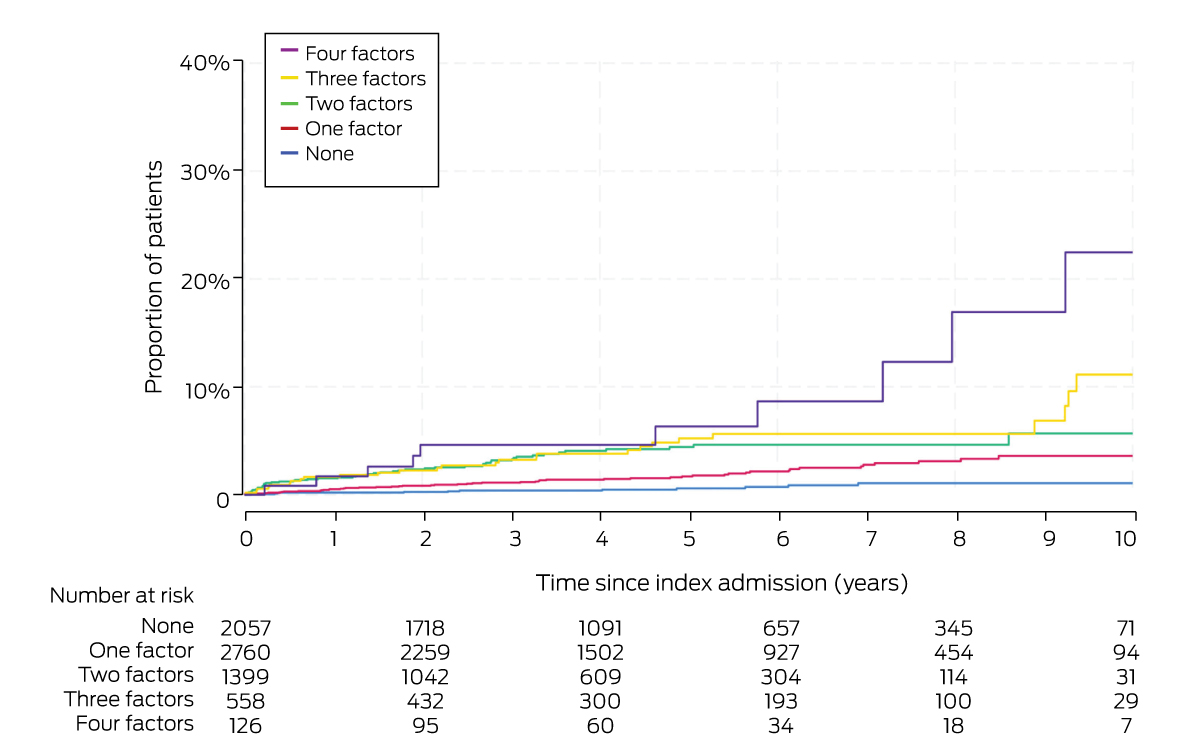
* Diabetes mellitus; aged 50 years or older; hypertension; major adverse cardiovascular event.
Received 30 March 2023, accepted 14 August 2023
- James O'Beirne1,2
- Richard Skoien3
- Barbara A Leggett3,4
- Gunter F Hartel4,5,6
- Louisa G Gordon4,5,6
- Elizabeth E Powell4,5,7
- Patricia C Valery5,4
- 1 University of the Sunshine Coast, Buderim, QLD
- 2 Sunshine Coast University Hospital, Kawana Waters, QLD
- 3 Royal Brisbane and Woman's Hospital Health Service District, Brisbane, QLD
- 4 The University of Queensland, Brisbane, QLD
- 5 QIMR Berghofer Medical Research Institute, Brisbane, QLD
- 6 Queensland University of Technology, Brisbane, QLD
- 7 Princess Alexandra Hospital Health Service District, Brisbane, QLD
Open access:
Open access publishing facilitated by The University of Queensland, as part of the Wiley – The University of Queensland agreement via the Council of Australian University Librarians.
This study was supported by the Sunshine Coast University Hospital and Health Service through the Study, Education, Research Trust Fund (SERTF)–Wishlist (collaborative research grants 2021). We acknowledge the Queensland Registry of Births, Deaths and Marriages for providing the deaths data, and the Statistical Analysis and Linkage Unit of Queensland Department of Health for undertaking dataset linkage.
No relevant disclosures.
- 1. Adams LA, Roberts SK, Strasser SI, et al. Nonalcoholic fatty liver disease burden: Australia, 2019–2030. J Gastroenterol Hepatol 2020; 35: 1628‐1635.
- 2. Powell EE, Wong VWS, Rinella M. Non‐alcoholic fatty liver disease. Lancet 2021; 397: 2212‐2224.
- 3. Allen AM, Lazarus JV, Younossi ZM. Healthcare and socioeconomic costs of NAFLD: a global framework to navigate the uncertainties. J Hepatol 2023; 79: 209‐217.
- 4. Loomba R, Huang DQ, Sanyal AJ, et al. Liver stiffness thresholds to predict disease progression and clinical outcomes in bridging fibrosis and cirrhosis. Gut 2023; 72: 581‐589.
- 5. Loomba R, Wong R, Fraysse J, et al. Nonalcoholic fatty liver disease progression rates to cirrhosis and progression of cirrhosis to decompensation and mortality: a real world analysis of Medicare data. Aliment Pharmacol Ther 2020; 51: 1149‐1159.
- 6. Braude M, Roberts S, Majeed A, et al. Liver stiffness (Fibroscan®) is a predictor of all‐cause mortality in people with non‐alcoholic fatty liver disease. Liver Int 2023; 43: 90‐99.
- 7. Hagström H, Adams LA, Allen AM, et al. administrative coding in electronic health care record‐based research of NAFLD: an expert panel consensus statement. Hepatology 2021; 74: 474‐482.
- 8. Australian Institute of Health and Welfare. Australian Statistical Geography Standard (ASGS), volume 5. Remoteness structure, July 2016 (1270.0.55.005). 16 Mar 2018. https://www.abs.gov.au/ausstats/abs@.nsf/Latestproducts/1270.0.55.005Main%20Features1July%202016?opendocument&tabname=Summary&prodno=1270.0.55.005&issue=July%202016&num=&view= (viewed Aug 2023).
- 9. Australian Bureau of Statistics. Census of Population and Housing: Socio‐economic Indexes for Areas (SEIFA), Australia, 2006 (2033.0.55.001). IRSAD. 27 Mar 2018. https://www.abs.gov.au/ausstats/abs@.nsf/Lookup/by%20Subject/2033.0.55.001~2016~Main%20Features~IRSAD~20. (viewed Aug 2023).
- 10. Charlson ME, Pompei P, Ales KL, MacKenzie CR. A new method of classifying prognostic comorbidity in longitudinal studies: development and validation. J Chronic Dis 1987; 40: 373‐383.
- 11. Hayward KL, Johnson AL, McKillen BJ, et al. ICD‐10‐AM codes for cirrhosis and related complications: key performance considerations for population and healthcare studies. BMJ Open Gastroenterol 2020; 7: e000485.
- 12. Lomonaco R, Godinez Leiva E, Bril F, et al. Advanced liver fibrosis is common in patients with type 2 diabetes followed in the outpatient setting: the need for systematic screening. Diabetes Care 2021; 44: 399‐406.
- 13. Kwok R, Choi KC, Wong GLH, et al. Screening diabetic patients for non‐alcoholic fatty liver disease with controlled attenuation parameter and liver stiffness measurements: a prospective cohort study. Gut 2016; 65: 1359‐1368.
- 14. Lovett GC, Ha P, Roberts AT, et al. Healthcare utilisation and costing for decompensated chronic liver disease hospitalisations at a Victorian network. Intern Med J 2022; https://doi.org/10.1111/imj.15962 [online ahead of print].
- 15. Jarvis H, Craig D, Barker R, et al. Metabolic risk factors and incident advanced liver disease in non‐alcoholic fatty liver disease (NAFLD): a systematic review and meta‐analysis of population‐based observational studies. PLoS Med 2020; 17: e1003100.
- 16. Elkrief L, Rautou PE, Sarin S, et al. Diabetes mellitus in patients with cirrhosis: clinical implications and management. Liver Int 2016; 36: 936‐948.
- 17. Castera L, Cusi K. Diabetes and cirrhosis: Current concepts on diagnosis and management. Hepatology 2023; 77: 2128‐2146.
- 18. Allen AM, Hicks SB, Mara KC, et al. The risk of incident extrahepatic cancers is higher in non‐alcoholic fatty liver disease than obesity: a longitudinal cohort study. J Hepatol 2019; 71: 1229‐1236.
- 19. Albhaisi S, McClish D, Kang L, et al. Nonalcoholic fatty liver disease is specifically related to the risk of hepatocellular cancer but not extrahepatic malignancies. Front Endocrinol (Lausanne) 2022; 13: 1037211.
- 20. Tilg H, Zmora N, Adolph TE, Elinav E. The intestinal microbiota fuelling metabolic inflammation. Nat Rev Immunol 2020; 20: 40‐54.
- 21. Patel Chavez C, Cusi K, Kadiyala S. The emerging role of glucagon‐like peptide‐1 receptor agonists for the management of NAFLD. J Clin Endocrinol Metab 2022; 107: 29‐38.
- 22. Hayward KL, Johnson AL, Horsfall LU, et al. Detecting non‐alcoholic fatty liver disease and risk factors in health databases: accuracy and limitations of the ICD‐10‐AM. BMJ Open Gastroenterol 2021; 8: e000572.
- 23. Petta S, Ting J, Saragoni S, et al. Healthcare resource utilization and costs of nonalcoholic steatohepatitis patients with advanced liver disease in Italy. Nutr Metab Cardiovasc Dis 2020; 30: 1014‐1022.
- 24. Taylor RS, Taylor RJ, Bayliss S, et al. Association between fibrosis stage and outcomes of patients with nonalcoholic fatty liver disease: a systematic review and meta‐analysis. Gastroenterology 2020; 158: 1611‐1625.
- 25. Allen AM, Therneau TM, Ahmed OT, et al. Clinical course of non‐alcoholic fatty liver disease and the implications for clinical trial design. J Hepatol 2022; 77: 1237‐1245.
Abstract
Objective: To determine the incidence of decompensated cirrhosis and associated risk factors in people hospitalised with non‐alcoholic fatty liver disease (NAFLD) or non‐alcoholic steatohepatitis (NASH) with or without cirrhosis.
Design: Retrospective cohort study; analysis of linked Queensland Hospital Admitted Patient Data Collection, Queensland Registry of Births, Deaths and Marriages, and Queensland Cancer Register data.
Setting, participants: Queensland residents aged 20 years or older admitted to Queensland hospitals with NAFLD/NASH during 1 July 2009 – 31 December 2018.
Main outcome measures: Progression to decompensated cirrhosis (ascites, hepatic encephalopathy, or oesophageal variceal bleeding).
Results: We included data for 8006 patients in our analysis (10 082 admissions), including 4632 women (58%) and 2514 people with diabetes mellitus (31%); median follow‐up time was 4.6 years (interquartile range, 2.7–7.2 years). Three hundred and fifty‐one people (4.4%) experienced decompensated cirrhosis during the follow‐up period. Of the 6900 people without cirrhosis, 4.5% (95% confidence interval [CI], 3.6–5.7%) experienced decompensated cirrhosis within ten years (mean, 0.5% per year; 95% CI, 0.4–0.6% per year); risk of progression was greater for people aged 70 years or older (v 20–39 years: adjusted hazard ratio [aHR], 4.7; 95% CI, 2.0–11.0) and those who had extrahepatic cancers (aHR, 5.0; 95% CI, 3.0–8.2), history of major cardiovascular events (aHR, 1.9; 95% CI, 1.2–3.1), or diabetes mellitus (aHR, 2.8; 95% CI, 2.0–3.9). Of the 1106 people with cirrhosis, 32.4% (95% CI, 27.2–38.3%) experienced decompensated cirrhosis within ten years (mean, 5.5% per year; 95% CI, 4.8–6.3% per year); risk of progression was greater for those with portal hypertension (aHR, 1.8; 95% CI, 1.3–2.7), extrahepatic cancer (aHR, 1.8; 95% CI, 1.1–2.9), or diabetes mellitus (aHR, 1.5; 95% CI, 1.1–2.0). Compared with people who had neither cirrhosis nor diabetes mellitus, the risk of decompensation was greater for people with cirrhosis (aHR, 10.7; 95% CI, 7.6–15.0) or cirrhosis and diabetes mellitus (aHR, 14.4; 95% CI, 10.1–20.6).
Conclusions: Given the greater risk of progression to cirrhosis decompensation in people with diabetes mellitus, a disorder common in people with NAFLD/NASH, identifying advanced fibrosis and providing appropriate treatment for averting disease progression is vital.