


The known: Traumatic brain injury causes more deaths and disability around the world than any other injury type, but its current incidence in Australia is unknown.
The new: During 2015–20, 16 350 people were admitted to major Australian hospitals with moderate to severe traumatic brain injury, 14.9% of whom died in hospital. The annual numbers of hospitalisations and deaths did not change during this period.
The implications: We did not identify any impact of injury prevention and trauma care interventions on the burden of moderate to severe traumatic brain injury in Australia during 2015–20. Developing effective prevention and care strategies will require identification of the determinants of its incidence and mortality.
Each year, injuries lead to 4.4 million deaths around the world, or 8% of all deaths. Among the most frequent causes of death for people aged 5–25 years are road accidents, homicide, and suicide. Further, injuries are responsible for an estimated 10% of all years lost to disability, imposing an enormous social and economic burden on individuals and countries.1 Traumatic brain injury (TBI) causes more deaths and disability than any other type of injury,2,3 but its incidence, distribution, and impact by region and socio‐economic characteristics, including in Australia, is unknown.2,3
TBI is an injury to the brain caused by an external force, including road accidents, falls, and being struck by an object, person, or animal.4 TBI varies in severity, from mild to severe, and is better classified according to brain injury pathology identified by neuroimaging (eg, Abbreviated Injury Scale [AIS] head injury code) than by using the Glasgow Coma Scale (GCS).5,6,7,8 Moderate to severe TBI often has substantial lasting consequences for the person, their family, and their caregivers. TBI can also require considerable health care resources and have a significant socio‐economic impact.3,9
The age‐adjusted incidence of injury‐related hospitalisations in Australia during 2020–21 was 2135 per 100 000 population, and that of injury‐related deaths 46.7 per 100 000 population. The most frequent principal site of injury causing hospitalisation is the head and neck region (22% of cases in 2021–22).10 However, the national incidence of hospitalisation and death following moderate to severe TBI has not been reported in Australia since 1999.11
The Australian Traumatic Brain Injury National Data (ATBIND) project was established in 2021 to assess the frequency and key determinants of major outcomes for people with moderate to severe TBI in Australia.9,12 The aim was to obtain the baseline data necessary for implementing patient‐ and system‐level care interventions and preventive measures, and to facilitate monitoring and comparison of their effectiveness with national targets.12 In this article, we describe the frequency of hospitalisation and in‐hospital death following moderate to severe TBI in Australia, both overall and by patient demographic characteristics and the nature and severity of the injury.
Methods
We have previously described in this Journal the methodology of the ATBIND project.13 In this article, we report the results of phase 1 of the project, our investigation of the frequency of hospitalisation and in‐hospital death after moderate to severe TBI, based on our analysis of Australia New Zealand Trauma Registry (ATR; https://atr.org.au) data. Since 1 July 2015, the ATR has documented the demographic characteristics, nature and severity of the injury event, processes of care, and outcomes for people with major injuries assessed and managed at 27 major trauma services across Australia.14 These centres provide definitive care for people with major trauma, including moderate to severe TBI. Specifically, the ATR includes data for people who were assessed as having an Injury Severity Score (ISS) of more than 12 or who died in hospital. The AIS, an anatomic scoring system, ranks trauma to anatomic regions on an ordinal scale (from 1 = minor to 6 = maximum) according to radiology and operative findings.15 The ISS is the sum of the square of the AIS codes for the three most severely injured anatomic regions.
We analysed data from the twenty‐three Australian trauma services that contributed data to the ATR throughout the entire study period (1 July 2015 – 30 June 2020; Supporting Information, table 1). We included cases of moderate to severe TBI, defined by an AIS code for the head region greater than 2.5,13,16 We selected this criterion because of the major limitations associated with using the GCS to define TBI severity; people who have sustained a moderate or severe TBI can have high GCS scores, and a low GCS score may not be related to TBI.5,8 We excluded cases for which key variable data (age, sex, death in hospital) were incomplete.
Outcomes
The primary outcome was the number of hospitalisations with moderate to severe TBI; the secondary outcome was the number of deaths in hospital following moderate to severe TBI. Analyses included all cases of TBI, or cases in groups defined by demographic characteristics, nature of the injury, or injury severity. When a participating service had not submitted data for a variable during a single year, or the overall 5‐year data completeness for that variable was less than 80%, the service data were not included in the analysis for that variable (eg, intent of injury). The proportion of missing data (after excluding ineligible site data) for each variable is reported and complete case analyses were undertaken.
Statistical analysis
Symmetrically distributed continuous data are summarised as means with standard deviations (SDs), non‐symmetrically distributed continuous data and ordinal data as medians with interquartile ranges (IQRs), and categorical data as numbers and proportions. We examined annual changes in mean daily numbers of hospitalisations and deaths, overall and by variable, in separate negative binomial regression models (because hospitalisations data were over‐dispersed) without offsets for the primary analyses. The outcome variable was the natural log of the daily number of hospitalisations or deaths, the primary independent covariate was financial year. We report the outcomes of regression analyses as incident rate ratios (IRRs) with 95% confidence intervals (95% CIs). Sensitivity analyses (change in incidence of hospitalisation and death, overall and by sex) were adjusted for estimated changes in the Australian population, applying as the offset the natural log of the mid‐year (ie, December) population in multiples of 100 000.17 Data were prepared, analysed, and graphed in Stata 17.
Ethics approval
The Alfred Ethics Committee approved the study (project 670/21).
Results
Of 16 582 cases of moderate to severe TBI managed at the twenty‐three trauma services during 2015–20, 232 were excluded because data were incomplete (1.4%). We included 16 350 hospitalisations (mean, 3270 per year) and 2437 in‐hospital deaths (14.9% of admissions; mean, 487 per year) in our analysis (Box 1).
Hospital admissions
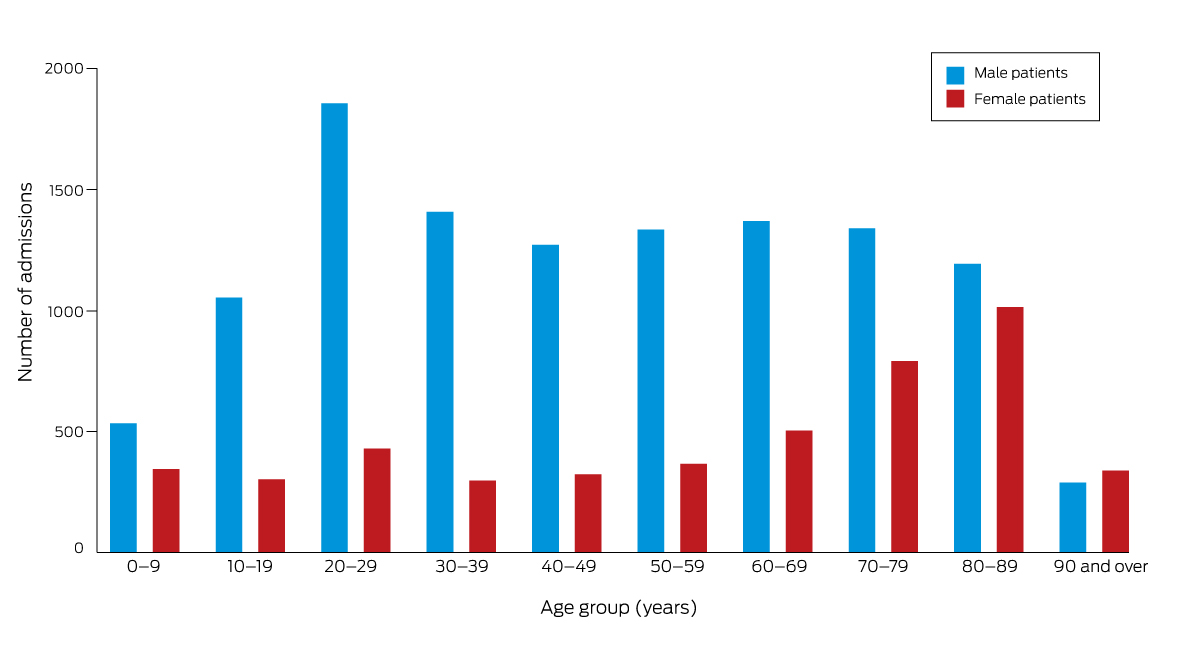
The mean age of people admitted to hospital with moderate to severe TBI was 50.5 years (SD, 26.1 years); 11 644 patients were male (71.2%) (Box 2). The number of male patients was highest in the 20–29‐year age group (1856; 15.9% of admissions), and was about 1340 for each subsequent 10‐year age group to 80–89 years; the number of female patients peaked with the 80–89‐year age group (1014; 21.5% of admissions), the number having steadily increased from the 30–39‐year age group (Box 3).
Most hospitalisations with moderate to severe TBI were of people with blunt trauma injuries (16 047; 98.1% of admissions). The most frequent external causes of injury were falls (8069; 49.4%) and transport‐related injuries (5706; 34.9%) (Box 4). The major external causes of injuries to people aged 65 years or older were falls (4647; 78.5% of admissions), and transport‐related injuries for people aged 0–17 years (793; 45.3%) or 18–64 years (3903; 44.9%) (Box 5).
Most hospitalisations with moderate to severe TBI were of people who did not have isolated TBI (10 386; 63.5% of admissions); that is, they also had injuries to other anatomic regions scored as AIS > 1 (Box 6). After excluding the 1982 people who had been sedated prior to arrival at the hospital (eg, for endotracheal intubation) or for whom total GCS scores were missing, 9762 of 14 368 people (59.7%) had total GCS values of 13–15 on arrival (Box 6).
Overall, there was no statistically significant change in the rate of hospitalisation following moderate to severe TBI during 2015–20 (IRR, 1.00; 95% CI, 0.99–1.02), nor in rates by sex. Further, few statistically significant changes were identified by age (60–69 years: IRR, 1.04; 95% CI, 1.003–1.07; 90 years or older: IRR, 1.07; 95% CI, 1.01–1.13), nature of the injury (injury location was street or highway: IRR, 1.05; 95% CI, 1.02–1.07; external cause was being struck [female patients]: IRR, 0.89; 95% CI, 0.81–0.98; injury location was workplace [female patients]: IRR, 1.13; 95% CI, 1.01–1.25), or injury severity (GCS on arrival of 3–8: IRR, 1.06; 95% CI, 1.04–1.09; intubation prior to arrival: IRR, 0.89; 95% CI, 0.84–0.95) (Supporting Information, tables 3 to 5).
In‐hospital deaths
The mean age of people who died in hospital after moderate to severe TBI was 60.4 years (SD, 25.2 years); 1686 deaths were of male patients (69.2%) (Box 2).
Most in‐hospital deaths following moderate to severe TBI were of people with blunt trauma injuries (2353; 96.6% of deaths). The most frequent external causes of injury‐related in‐hospital deaths were falls (1287; 52.8%) and transport‐related injuries (822; 33.8%) (Box 7).
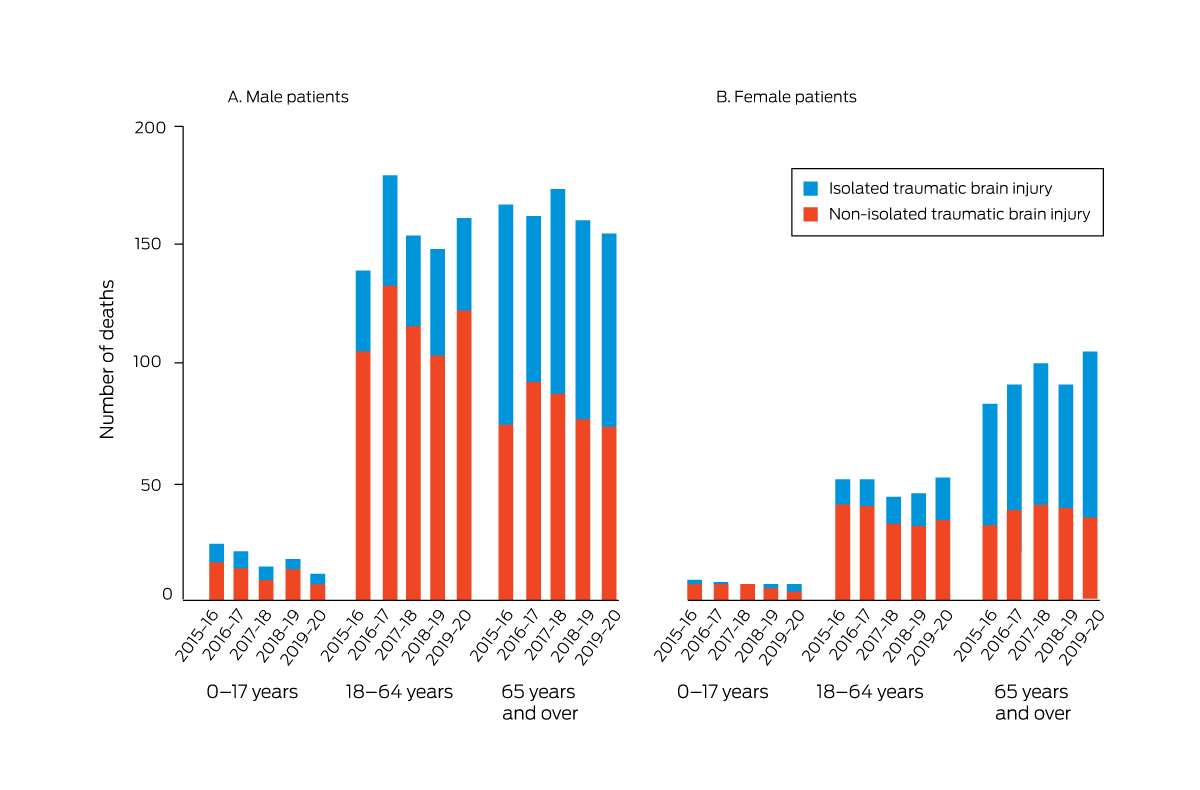
Most in‐hospital deaths following moderate to severe TBI were of people who did not have isolated TBI (1437; 58.9% of deaths) (Box 8). The proportion of in‐hospital deaths with non‐isolated TBI varied by sex and broad age group (Box 9). After excluding those who had been sedated prior to arrival at the hospital (eg, for endotracheal intubation) or for whom total GCS scores were missing, total GCS values were less than 9 on arrival for 1265 of 1891 people who died in hospital (51.9%) (Box 8).
Overall, there was no statistically significant change in the overall rate of in‐hospital death following moderate to severe TBI during 2015–20 (IRR, 1.00; 95% CI, 0.97–1.03), nor in rates by age group or sex. Further, few statistically significant changes were identified by age (90 years or older: IRR, 1.11; 95% CI, 1.001–1.24), nature of the injury (injury location was workplace: IRR, 1.17; 95% CI, 1.02–1.35), or injury severity (GCS on arrival of 3–8: IRR, 1.05; 95% CI, 1.01–1.09; normal shock index on arrival: IRR, 0.94; 95% CI, 0.88–0.998) (Supporting Information, tables 3 to 5).
Sensitivity analyses
After adjustment for estimated Australian population change during 2015–20, no statistically significant changes in mean daily numbers of hospitalisations or deaths in hospital after moderate to severe TBI, overall or by sex, were evident (Supporting Information, table 3).
Discussion
The overall numbers of hospital admissions (about nine per day; 60 per 100 000 population per year) and deaths in hospital (1.3 per day; 9 per 100 000 population per year) following moderate to severe TBI did not change significantly during 2015–20. The in‐hospital mortality rate was about 15% throughout this period.
The impetus for the ATBIND project was the dearth of recent national data on hospital discharge outcomes for people with moderate to severe TBI, particularly for Australia.18,19,20,21 We found no change during 2015–20 in the in‐hospital mortality rate for people with moderate to severe TBI, nor evidence that injury prevention strategies and trauma care system interventions during this period reduced the incidence of moderate to severe TBI or the associated mortality rate. Injury prevention strategies were reviewed in 201922 to provide information for the planned but as yet unpublished National Injury Prevention Strategy.23 As the incidence of in‐hospital death and the fatality rate for people with moderate to severe TBI has not changed, a parallel review of Australian systems of care is required.
Our estimates of the population incidence of hospital admissions and in‐hospital deaths following moderate to severe TBI are similar to those reported in some other high income countries. For example, in 2021 it was reported that about 280 000 TBI‐related hospitalisations and 60 000 deaths per year are recorded in the United States,24 or about 80 hospitalisations and 17 deaths per 100 000 population. A 2021 review of European TBI studies found that crude national annual mortality rates ranged between nine and 28 deaths per 100 000 population.25
Limitations
Almost all major Australian trauma hospitals with specialist neurosurgical capability contribute data to the ATR. However, while most people who survive moderate to severe TBI are admitted to a participating hospital, some die at the scene of the injury, on the way to hospital, or in hospitals other than major trauma centres. Our consequently incomplete case capture limits the generalisability of our findings; the acute burden of moderate to severe TBI, particularly deaths, is probably greater than we have estimated. Not all deaths of people with conditions that satisfied our definition of moderate to severe TBI will have died in hospital because of TBI; the primary cause of death may have been major haemorrhage or respiratory failure. Further, we took a relatively narrow view of burden; death is not the only negative outcome of moderate to severe TBI. The five‐year study period, commencing with the inception of the ATR, may not have been sufficient to detect significant changes in numbers of hospitalisations or deaths. Our analysis should be repeated in five years’ time to take into account the major impact on the health system of the COVID‐19 pandemic. Finally, the small number of statistically significant changes in the numbers of hospitalisations or deaths of people in certain subgroups should be interpreted with caution. For example, our finding that the incidence of in‐hospital death declined among people with normal shock index scores on hospital arrival should be further explored.
Conclusion
TBI is a major cause of hospitalisation and death in Australia, particularly of young men. The overall incidence of hospitalisation and in‐hospital death following moderate to severe TBI did not change during 2015–20. Identifying the modifiable determinants both of the incidence of TBI and of mortality following TBI, as well as the development of effective care strategies, will be required to reduce this tragic burden.
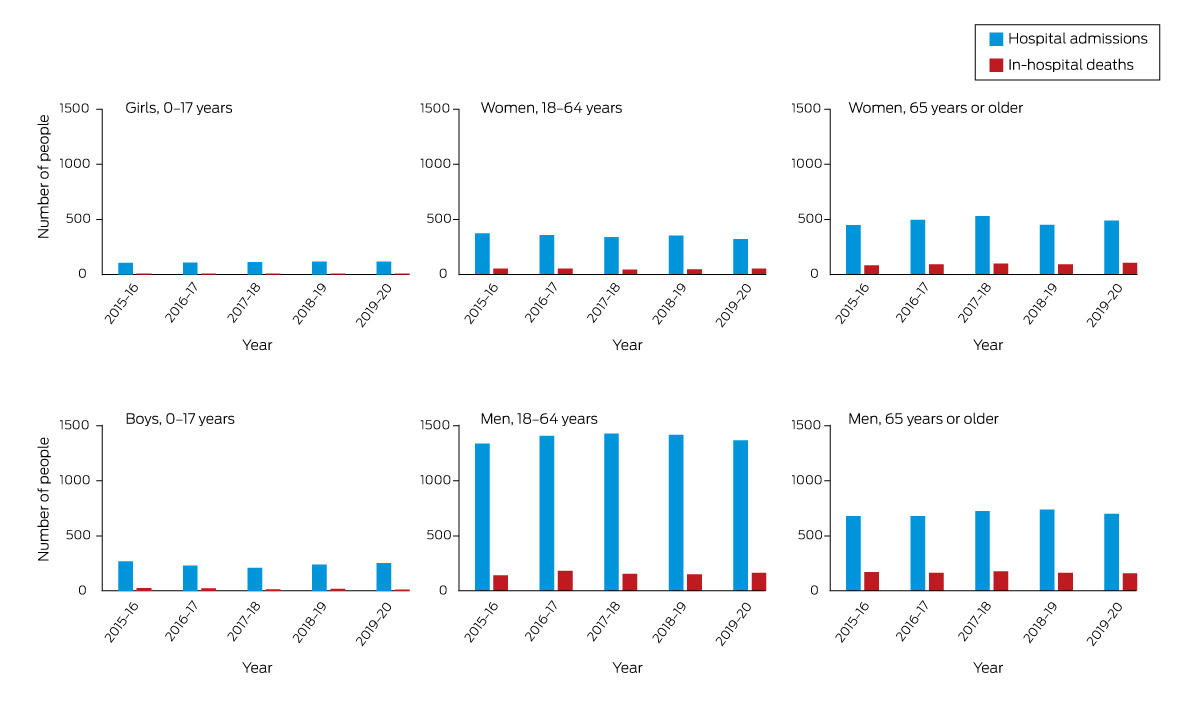
Box 1 – People admitted to hospital or who died in hospital following moderate to severe traumatic brain injury, Australia, 2015–20, by year, sex, and broad age group
Box 2 – Demographic characteristics of people admitted to hospital or who died in hospital following moderate to severe traumatic brain injury, Australia, 2015–20, by year
|
Characteristic |
2015–16 |
2016–17 |
2017–18 |
2018–19 |
2019–20 |
All years |
|||||||||
|
|
|||||||||||||||
|
Admissions |
3204 |
3271 |
3335 |
3305 |
3235 |
16 350 |
|||||||||
|
Age (years), mean (SD) |
49.3 (26.4) |
50.3 (25.7) |
51.8 (25.8) |
50.4 (26.1) |
50.7 (26.1) |
50.5 (26.1) |
|||||||||
|
0–9 |
192 (6.0%) |
183 (5.6%) |
149 (4.5%) |
182 (5.5%) |
171 (5.3%) |
877 (5.4%) |
|||||||||
|
10–19 |
295 (9.2%) |
241 (7.4%) |
261 (7.8%) |
271 (8.2%) |
287 (8.9%) |
1355 (8.3%) |
|||||||||
|
20–29 |
485 (15.1%) |
466 (14.3%) |
454 (13.6%) |
469 (14.2%) |
411 (12.7%) |
2285 (14.0%) |
|||||||||
|
30–39 |
323 (10.9%) |
361 (11.0%) |
334 (10.0%) |
322 (9.7%) |
364 (11.3%) |
1704 (10.4%) |
|||||||||
|
40–49 |
309 (9.6%) |
323 (9.9%) |
313 (9.4%) |
332 (10.1%) |
316 (9.8%) |
1593 (9.7%) |
|||||||||
|
50–59 |
326 (10.2%) |
354 (10.8%) |
348 (10.4%) |
355 (10.7%) |
317 (9.8%) |
1700 (10.4%) |
|||||||||
|
60–69 |
314 (9.8%) |
376 (11.5%) |
418 (12.5%) |
391 (11.8%) |
373 (11.6%) |
1872 (11.5%) |
|||||||||
|
70–79 |
412 (12.9%) |
412 (12.6%) |
442 (13.3%) |
418 (12.7%) |
447 (13.8%) |
2131 (13.0%) |
|||||||||
|
80–89 |
438 (13.7%) |
444 (13.6%) |
485 (14.5%) |
427 (12.9%) |
413 (12.8%) |
2207 (13.5%) |
|||||||||
|
90 or older |
110 (3.4%) |
111 (3.4%) |
131 (3.9%) |
138 (4.2%) |
136 (4.2%) |
626 (3.9%) |
|||||||||
|
Sex |
|
|
|
|
|
|
|||||||||
|
Male |
2278 (71.1%) |
2311 (70.7%) |
2357 (70.7%) |
2387 (72.2%) |
2311 (71.4%) |
11 644 (71.2%) |
|||||||||
|
Female |
926 (28.9%) |
960 (29.3%) |
978 (29.3%) |
918 (27.8%) |
924 (28.8%) |
4706 (28.8%) |
|||||||||
|
Deaths |
473 |
512 |
492 |
469 |
491 |
2437 |
|||||||||
|
Case fatality rate |
14.8% |
15.7% |
14.8% |
14.2% |
15.2% |
14.9% |
|||||||||
|
Age (years), mean (SD) |
59.9 (26.2) |
58.3 (25.1) |
62.1 (24.3) |
60.2 (26.0) |
61.6 (24.5) |
60.4 (25.2) |
|||||||||
|
0–9 |
15 (3.2%) |
14 (2.7%) |
11 (2.2%) |
11 (2.4%) |
8 (1.6%) |
59 (2.4%) |
|||||||||
|
10–19 |
29 (6.1%) |
23 (4.5%) |
20 (4.1%) |
25 (5.3%) |
19 (3.9%) |
116 (4.8%) |
|||||||||
|
20–29 |
50 (10.6%) |
60 (11.7%) |
44 (8.9%) |
59 (12.6%) |
47 (9.6%) |
260 (10.7%) |
|||||||||
|
30–39 |
29 (6.1%) |
42 (8.2%) |
36 (7.3%) |
29 (6.2%) |
41 (8.4%) |
177 (7.4%) |
|||||||||
|
40–49 |
33 (7.0%) |
38 (7.4%) |
27 (5.5%) |
33 (7.0%) |
42 (8.6%) |
173 (7.1%) |
|||||||||
|
50–59 |
38 (8.0%) |
51 (10.0%) |
47 (9.6%) |
39 (8.3%) |
44 (9.0%) |
219 (9.0%) |
|||||||||
|
60–69 |
50 (10.6%) |
66 (12.9%) |
69 (14.0%) |
49 (10.5%) |
53 (10.8%) |
287 (11.8%) |
|||||||||
|
70–79 |
78 (16.5%) |
93 (18.2%) |
83 (16.9%) |
77 (16.4%) |
85 (17.3%) |
416 (17.1%) |
|||||||||
|
80–89 |
124 (26.2%) |
89 (17.4%) |
118 (24.0%) |
108 (23.0%) |
107 (21.8%) |
546 (22.4%) |
|||||||||
|
90 or older |
27 (5.7%) |
36 (7.0%) |
37 (7.5%) |
39 (8.3%) |
45 (9.2%) |
184 (7.6%) |
|||||||||
|
Sex |
|
|
|
|
|
|
|||||||||
|
Male |
330 (69.8%) |
362 (70.7%) |
341 (69.3%) |
326 (69.5%) |
327 (66.6%) |
1686 (69.2%) |
|||||||||
|
Female |
143 (30.2%) |
150 (29.3%) |
151 (30.7%) |
143 (30.5%) |
164 (33.4%) |
751 (30.8%) |
|||||||||
|
|
|||||||||||||||
|
SD = standard deviation. |
|||||||||||||||
Box 3 – People admitted to hospital following moderate to severe traumatic brain injury, Australia, 2015–20, by age group and sex
Box 4 – Characteristics of moderate to severe traumatic brain injury leading to hospitalisation, Australia, 2015–20, by year
|
Characteristic |
2015–16 |
2016–17 |
2017–18 |
2018–19 |
2019–20 |
All years |
|||||||||
|
|
|||||||||||||||
|
Hospitalisations |
3204 |
3271 |
3335 |
3305 |
3235 |
16 350 |
|||||||||
|
Time of injury |
|
|
|
|
|
|
|||||||||
|
00:00–07:59 |
965 (30.1%) |
1032 (31.6%) |
1101 (33.0%) |
1105 (33.4%) |
1026 (31.7%) |
5229 (32.0%) |
|||||||||
|
08:00–15:59 |
1210 (37.8%) |
1192 (36.4%) |
1200 (36.0%) |
1150 (34.8%) |
1175 (36.3%) |
5927 (36.2%) |
|||||||||
|
16:00–23:59 |
1029 (32.1%) |
1047 (32.0%) |
1034 (31.0%) |
1050 (31.8%) |
1034 (32.0%) |
5194 (31.8%) |
|||||||||
|
Dominant cause |
|
|
|
|
|
|
|||||||||
|
Blunt |
3145 (98.1%) |
3212 (98.2%) |
3277 (98.3%) |
3244 (98.1%) |
3165 (97.9%) |
16 043 (98.1%) |
|||||||||
|
Penetrating |
53 (1.7%) |
50 (1.5%) |
50 (1.5%) |
54 (1.6%) |
53 (1.6%) |
260 (1.6%) |
|||||||||
|
Other |
2 (0.1%) |
5 (0.2%) |
5 (0.2%) |
4 (0.1%) |
11 (0.3%) |
27 (0.2%) |
|||||||||
|
Missing data |
4 (0.1%) |
4 (0.1%) |
3 (0.1%) |
3 (0.1%) |
6 (0.2%) |
20 (0.1%) |
|||||||||
|
External cause |
|
|
|
|
|
|
|||||||||
|
Transport‐related |
1145 (35.7%) |
1127 (34.5%) |
1152 (34.5%) |
1196 (36.2%) |
1086 (33.6%) |
5706 (34.9%) |
|||||||||
|
Fall |
1545 (48.2%) |
1574 (48.1%) |
1677 (50.2%) |
1626 (49.2%) |
1647 (50.9%) |
8069 (49.4%) |
|||||||||
|
Struck* |
321 (10.0%) |
350 (10.7%) |
323 (9.7%) |
325 (9.8%) |
304 (9.4%) |
1623 (9.9%) |
|||||||||
|
Other |
164 (5.1%) |
184 (5.6%) |
164 (4.9%) |
140 (4.2%) |
169 (5.2%) |
821 (5.0%) |
|||||||||
|
Missing data |
29 (0.9%) |
36 (1.1%) |
19 (0.6%) |
18 (0.6%) |
29 (0.9%) |
131 (0.8%) |
|||||||||
|
Location of injury† |
2322 |
2377 |
2429 |
2395 |
2363 |
11 886 |
|||||||||
|
Home |
760 (32.7%) |
764 (32.1%) |
813 (33.4%) |
747 (31.2%) |
812 (34.4%) |
3896 (32.8%) |
|||||||||
|
Residential care institution |
80 (3.4%) |
80 (3.4%) |
84 (3.5%) |
93 (3.9%) |
98 (4.2%) |
435 (3.7%) |
|||||||||
|
Street or highway |
652 (28.1%) |
756 (31.8%) |
823 (33.9%) |
836 (34.9%) |
795 (33.6%) |
3862 (32.5%) |
|||||||||
|
Workplace |
177 (7.6%) |
173 (7.3%) |
204 (8.4%) |
202 (8.4%) |
193 (8.2%) |
949 (7.9%) |
|||||||||
|
Other |
336 (14.5%) |
399 (16.8%) |
291 (11.9%) |
284 (11.9%) |
245 (10.4%) |
1555 (13.1%) |
|||||||||
|
Missing data |
317 (13.7%) |
205 (8.6%) |
214 (8.8%) |
233 (9.7%) |
220 (9.3%) |
1189 (10.0%) |
|||||||||
|
Intent of injury‡ |
1510 |
1699 |
1681 |
1673 |
1689 |
8252 |
|||||||||
|
Unintentional |
1283 (85.0%) |
1433 (84.3%) |
1438 (85.5%) |
1426 (84.2%) |
1441 (85.3%) |
7021 (85.1%) |
|||||||||
|
Self‐harm |
38 (2.5%) |
50 (2.9%) |
47 (2.8%) |
48 (2.9%) |
42 (2.5%) |
255 (2.7%) |
|||||||||
|
Assault |
151 (10.0%) |
179 (10.5%) |
164 (9.8%) |
163 (9.7%) |
171 (10.1%) |
828 (10.0%) |
|||||||||
|
Other§ |
5 (0.3%) |
3 (0.2%) |
0 |
3 (0.2%) |
2 (0.1%) |
13 (0.2%) |
|||||||||
|
Missing data |
33 (2.2%) |
34 (2.0%) |
32 (1.9%) |
33 (2.0%) |
33 (2.0%) |
165 (2.0%) |
|||||||||
|
|
|||||||||||||||
|
* By person, animal, or object. † Data for eighteen sites that satisfied data completeness criteria. ‡ Data for eight sites that satisfied data completeness criteria. § Legal intervention, operations of war or acts of terrorism, adverse effect or complications of medical and surgical care. |
|||||||||||||||
Box 5 – People admitted to hospital following moderate to severe traumatic brain injury, Australia, 2015–20: external cause type, by year, broad age group and sex*
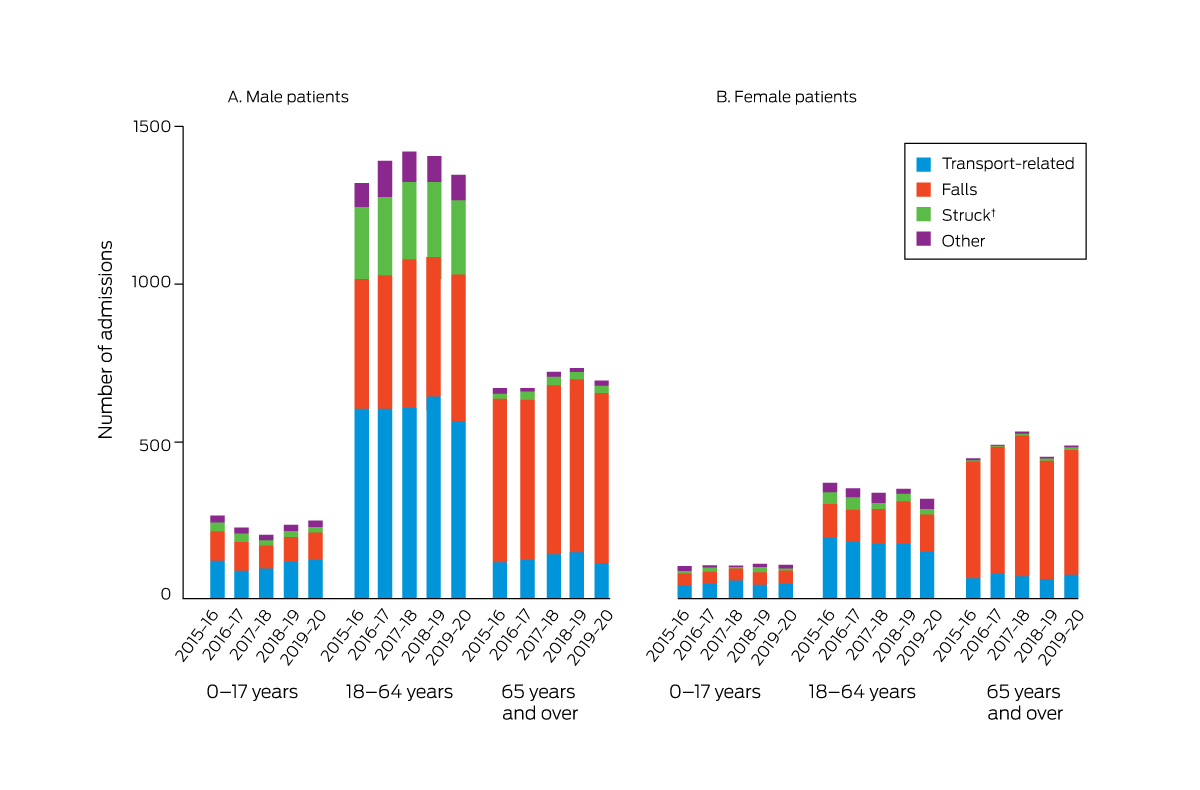
* The data for this graph are included in the Supporting Information, table 2.
† Struck by person, animal, or object.
Box 6 – Characteristics of moderate to severe traumatic brain injury leading to hospitalisation, Australia, 2015–20: injury severity, by year
|
Characteristic |
2015–16 |
2016–17 |
2017–18 |
2018–19 |
2019–20 |
All years |
|||||||||
|
|
|||||||||||||||
|
Admissions |
3204 |
3271 |
3335 |
3305 |
3235 |
16 350 |
|||||||||
|
Injury Severity Score* |
|
|
|
|
|
|
|||||||||
|
< 13 (and death) |
5 (0.2%) |
18 (0.5%) |
8 (0.2%) |
15 (0.4%) |
10 (0.3%) |
56 (0.3%) |
|||||||||
|
13–14 |
415 (12.9%) |
462 (14.1%) |
450 (13.5%) |
471 (14.4%) |
429 (13.3%) |
2227 (13.6%) |
|||||||||
|
16–24 |
1363 (42.6%) |
1329 (40.6%) |
1418 (42.5%) |
1351 (40.9%) |
1330 (41.1%) |
6791 (41.5%) |
|||||||||
|
25–40 |
1205 (37.6%) |
1223 (37.4%) |
1223 (36.7%) |
1221 (36.9%) |
1248 (38.6%) |
6120 (37.4%) |
|||||||||
|
41–75 |
216 (6.7%) |
238 (7.3%) |
236 (7.1%) |
246 (7.4%) |
218 (6.7%) |
1154 (7.1%) |
|||||||||
|
Missing data |
0 |
1 (< 0.1%) |
0 |
1 (< 0.1%) |
0 |
2 (0.1%) |
|||||||||
|
Isolated traumatic brain injury |
|
|
|
|
|
|
|||||||||
|
Yes† |
1234 (38.5%) |
1186 (36.3%) |
1155 (34.6%) |
1193 (36.1%) |
1196 (37.0%) |
5964 (36.5%) |
|||||||||
|
No |
1970 (61.5%) |
2085 (63.7%) |
2180 (65.4%) |
2112 (63.9%) |
2039 (63.0%) |
10 386 (63.5%) |
|||||||||
|
Abbreviated Injury Scale: head score* |
|
|
|
|
|
|
|||||||||
|
3 |
1045 (32.6%) |
1123 (34.3%) |
1106 (33.2%) |
1128 (34.1%) |
1052 (32.5%) |
5454 (33.4%) |
|||||||||
|
4 |
1195 (37.3%) |
1155 (35.3%) |
1241 (37.2%) |
1191 (36.0%) |
1214 (37.6%) |
5996 (36.7%) |
|||||||||
|
5 |
959 (29.9%) |
989 (30.2%) |
981 (29.4%) |
982 (29.7%) |
966 (29.8%) |
4877 (29.8%) |
|||||||||
|
6 |
5 (0.2%) |
4 (0.1%) |
7 (0.2%) |
4 (0.1%) |
3 (0.1%) |
23 (0.1%) |
|||||||||
|
Glasgow Coma Scale* |
|
|
|
|
|
|
|||||||||
|
3–8 |
684 (21.3%) |
527 (16.1%) |
711 (21.3%) |
796 (24.1%) |
769 (23.8%) |
3487 (21.3%) |
|||||||||
|
9–12 |
219 (6.8%) |
221 (6.8%) |
226 (6.8%) |
214 (6.5%) |
239 (7.4%) |
1119 (6.8%) |
|||||||||
|
13–15 |
1839 (57.4%) |
1926 (58.9%) |
2030 (60.8%) |
2027 (61.3%) |
1940 (59.9%) |
9762 (59.7%) |
|||||||||
|
Illegitimate: endotracheal tube |
44 (1.4%) |
348 (7.6%) |
189 (5.7%) |
143 (3.8%) |
69 (2.1%) |
793 (4.9%) |
|||||||||
|
Missing data: no endotracheal tube |
418 (13.0%) |
249 (7.7%) |
179 (5.4%) |
125 (3.8%) |
218 (6.7%) |
1189 (7.3%) |
|||||||||
|
Shock index* |
|
|
|
|
|
|
|||||||||
|
Normal (≤ 1.0) |
2869 (89.5%) |
2883 (88.1%) |
2987 (89.6%) |
2936 (88.8%) |
2901 (89.7%) |
14 576 (89.2%) |
|||||||||
|
Abnormal (> 1.0) |
320 (10.0%) |
365 (11.2%) |
332 (10.0%) |
352 (10.7%) |
322 (9.9%) |
1691 (10.3%) |
|||||||||
|
Missing data |
15 (0.5%) |
23 (0.7%) |
16 (0.5%) |
17 (0.5%) |
12 (0.4%) |
83 (0.5%) |
|||||||||
|
|
|||||||||||||||
|
* On arrival at the definitive hospital. † Abbreviated Injury Scale head score > 2 and no other body region > 1. |
|||||||||||||||
Box 7 – Characteristics of moderate to severe traumatic brain injury leading to death in hospital, Australia, 2015–20: injury type, by year
|
Characteristic |
2015–16 |
2016–17 |
2017–18 |
2018–19 |
2019–20 |
All years |
|||||||||
|
|
|||||||||||||||
|
Deaths |
473 |
512 |
492 |
469 |
491 |
2437 |
|||||||||
|
Time of injury |
|
|
|
|
|
|
|||||||||
|
00:00–07:59 |
142 (30.0%) |
159 (31.1%) |
150 (30.5%) |
155 (33.1%) |
157 (31.9%) |
763 (32.3%) |
|||||||||
|
08:00–15:59 |
181 (38.3%) |
187 (36.5%) |
202 (41.1%) |
175 (37.3%) |
191 (39.0%) |
936 (38.4%) |
|||||||||
|
16:00–23:59 |
150 (31.7%) |
166 (32.4%) |
140 (28.4%) |
139 (29.6%) |
143 (29.1%) |
738 (30.3%) |
|||||||||
|
Dominant cause |
|
|
|
|
|
|
|||||||||
|
Blunt |
458 (96.8%) |
496 (96.8%) |
476 (96.8%) |
450 (95.9%) |
473 (96.4%) |
2353 (96.6%) |
|||||||||
|
Penetrating |
11 (2.3%) |
11 (2.2%) |
11 (2.2%) |
16 (3.4%) |
9 (1.8%) |
58 (2.4%) |
|||||||||
|
Other |
1 (0.2%) |
4 (0.8%) |
3 (0.6%) |
3 (0.7%) |
8 (1.6%) |
19 (0.8%) |
|||||||||
|
Missing data |
3 (0.7%) |
1 (0.2%) |
2 (0.4%) |
0 |
1 (0.2%) |
7 (0.2%) |
|||||||||
|
External cause |
|
|
|
|
|
|
|||||||||
|
Transport‐related |
164 (34.7%) |
175 (34.2%) |
171 (34.7%) |
159 (33.9%) |
153 (31.3%) |
822 (33.8%) |
|||||||||
|
Falls |
235 (49.7%) |
254 (49.6%) |
269 (54.7%) |
254 (54.2%) |
275 (55.9%) |
1287 (52.8%) |
|||||||||
|
Struck* |
22 (4.6%) |
30 (5.9%) |
24 (4.9%) |
37 (7.9%) |
32 (6.5%) |
145 (5.9%) |
|||||||||
|
Other |
36 (7.6%) |
33 (6.4%) |
26 (5.3%) |
17 (3.6%) |
26 (5.3%) |
138 (5.6%) |
|||||||||
|
Missing data |
16 (3.4%) |
20 (3.9%) |
2 (0.4%) |
2 (0.4%) |
5 (1.0%) |
45 (1.9%) |
|||||||||
|
Location of injury† |
361 |
354 |
365 |
328 |
336 |
1744 |
|||||||||
|
Home |
140 (38.8%) |
129 (36.4%) |
136 (37.3%) |
123 (37.5%) |
134 (39.9%) |
662 (37.9%) |
|||||||||
|
Residential care institution |
22 (6.1%) |
12 (3.4%) |
22 (6.0%) |
27 (8.2%) |
21 (6.3%) |
104 (5.9%) |
|||||||||
|
Street or highway |
92 (25.5%) |
115 (32.5%) |
127 (34.8%) |
103 (31.4%) |
102 (30.4%) |
539 (30.9%) |
|||||||||
|
Workplace |
12 (3.3%) |
22 (6.2%) |
28 (7.7%) |
22 (6.7%) |
30 (8.9%) |
114 (6.6%) |
|||||||||
|
Other |
44 (12.2%) |
56 (15.8%) |
31 (8.5%) |
34 (10.4%) |
23 (6.8%) |
188 (10.8%) |
|||||||||
|
Missing data |
51 (14.1%) |
20 (5.7%) |
21 (5.7%) |
19 (5.8%) |
26 (7.7%) |
137 (7.9%) |
|||||||||
|
Intent of injury‡ |
205 |
265 |
217 |
214 |
246 |
1147 |
|||||||||
|
Unintentional |
174 (84.9%) |
224 (84.5%) |
182 (83.9%) |
176 (82.2%) |
212 (86.1%) |
968 (84.4%) |
|||||||||
|
Self‐harm |
9 (4.3%) |
17 (6.4%) |
16 (7.4%) |
12 (5.6%) |
12 (4.9%) |
66 (5.7%) |
|||||||||
|
Assault |
13 (6.3%) |
18 (6.8%) |
12 (5.5%) |
14 (6.5%) |
12 (4.9%) |
69 (6.0%) |
|||||||||
|
Other§ |
1 (0.5%) |
‐ |
‐ |
1 (0.5%) |
‐ |
2 (0.2%) |
|||||||||
|
Missing data |
8 (3.9%) |
6 (2.3%) |
7 (3.2%) |
11 (5.2%) |
10 (4.1%) |
42 (3.7%) |
|||||||||
|
|
|||||||||||||||
|
* By person, animal, or object. † Data for eighteen sites that satisfied data completeness criteria. ‡ Data for eight sites that satisfied data completeness criteria. § Legal intervention, operations of war or acts of terrorism, adverse effect or complications of medical and surgical care. |
|||||||||||||||
Box 8 – Characteristics of moderate to severe traumatic brain injury leading to death in hospital, Australia, 2015–20: injury severity, by year
|
Characteristic |
2015–16 |
2016–17 |
2017–18 |
2018–19 |
2019–20 |
All years |
|||||||||
|
|
|||||||||||||||
|
Deaths |
473 |
512 |
492 |
469 |
491 |
2437 |
|||||||||
|
Injury Severity Score* |
|
|
|
|
|
|
|||||||||
|
< 13 (and death) |
5 (1.1%) |
18 (3.5%) |
8 (1.6%) |
15 (3.2%) |
10 (2.0%) |
56 (2.3%) |
|||||||||
|
13–14 |
6 (1.3%) |
6 (1.2%) |
3 (0.6%) |
8 (1.7%) |
7 (1.4%) |
30 (1.2%) |
|||||||||
|
16–24 |
51 (10.8%) |
56 (10.9%) |
83 (16.9%) |
56 (11.9%) |
59 (12.0%) |
305 (12.6%) |
|||||||||
|
25–40 |
325 (68.7%) |
318 (62.1%) |
289 (58.7%) |
300 (64.0%) |
327 (66.6%) |
1559 (63.9%) |
|||||||||
|
41–75 |
86 (18.2%) |
114 (22.3%) |
109 (22.2%) |
90 (19.2%) |
88 (17.9%) |
487 (20.0%) |
|||||||||
|
Isolated traumatic brain injury |
|
|
|
|
|
|
|||||||||
|
Yes† |
198 (41.9%) |
188 (36.7%) |
199 (40.4%) |
199 (42.4%) |
216 (44.1%) |
1000 (41.1%) |
|||||||||
|
No |
275 (58.1%) |
324 (63.3%) |
293 (59.5%) |
270 (57.6%) |
275 (55.9%) |
1437 (58.9%) |
|||||||||
|
Abbreviated Injury Scale: head score* |
|
|
|
|
|
|
|||||||||
|
3 |
46 (9.7%) |
69 (13.5%) |
45 (9.1%) |
57 (12.2%) |
67 (13.6%) |
284 (11.7%) |
|||||||||
|
4 |
84 (17.8%) |
85 (16.6%) |
115 (23.4%) |
79 (16.8%) |
94 (19.1%) |
457 (18.8%) |
|||||||||
|
5 |
338 (71.5%) |
355 (69.3%) |
325 (66.1%) |
329 (70.1%) |
327 (66.7%) |
1674 (68.7%) |
|||||||||
|
6 |
5 (1.1%) |
3 (0.6%) |
7 (1.4%) |
4 (0.9%) |
3 (0.6%) |
22 (1.0%) |
|||||||||
|
Glasgow Coma Scale (if no endotracheal tube)* |
|
|
|
|
|
|
|||||||||
|
3–8 |
246 (52.0%) |
209 (40.8%) |
265 (53.9%) |
272 (58.0%) |
273 (55.7%) |
1265 (51.9%) |
|||||||||
|
9–12 |
46 (9.7%) |
46 (9.0%) |
44 (8.9%) |
33 (7.0%) |
52 (10.6%) |
221 (9.1%) |
|||||||||
|
13–15 |
66 (14.0%) |
81 (15.8%) |
80 (16.3%) |
91 (19.4%) |
87 (17.7%) |
405 (16.6%) |
|||||||||
|
Missing data: no endotracheal tube |
100 (21.1%) |
58 (11.3%) |
28 (5.7%) |
24 (5.1%) |
47 (9.5%) |
257 (10.5%) |
|||||||||
|
Illegitimate: endotracheal tube |
15 (3.2%) |
118 (23.1%) |
75 (15.2%) |
49 (10.4%) |
32 (6.5%) |
289 (11.8%) |
|||||||||
|
Shock index* |
|
|
|
|
|
|
|||||||||
|
Normal (≤ 1.0) |
353 (74.4%) |
383 (74.8%) |
399 (81.1%) |
375 (80.0%) |
395 (80.5%) |
1905 (78.1%) |
|||||||||
|
Abnormal (> 1.0) |
105 (22.2%) |
106 (20.7%) |
78 (15.9%) |
79 (16.8%) |
88 (17.9%) |
456 (18.7%) |
|||||||||
|
Missing data |
15 (3.4%) |
23 (4.5%) |
15 (3.0%) |
15 (3.2%) |
8 (1.6%) |
76 (3.2%) |
|||||||||
|
|
|||||||||||||||
|
* On arrival at the definitive hospital. † Abbreviated Injury Scale head score > 2 and no other body region > 1. |
|||||||||||||||
Received 21 April 2022, accepted 29 June 2023
- Gerard M O'Reilly1,2
- Kate Curtis3
- Biswadev Mitra1
- Yesul Kim2,4
- Afsana Afroz1
- Kate Hunter5,6
- Courtney Ryder7
- Delia V Hendrie8
- Nick Rushworth9
- Jin Tee2
- Shane D'Angelo7
- Emma Solly2
- Oashe Bhattacharya2
- Mark C Fitzgerald1,2
- Gerard M O'Reilly1,2
- Kate Curtis3
- Biswadev Mitra1
- Yesul Kim2,4
- Afsana Afroz1
- Kate Hunter5,6
- Courtney Ryder7
- Delia V Hendrie8
- Nick Rushworth9
- Jin Tee2
- Shane D'Angelo7
- Emma Solly2
- Oashe Bhattacharya2
- Mark C Fitzgerald1,2
- 1 Alfred Hospital, Melbourne, VIC
- 2 National Trauma Research Institute, Alfred Hospital, Melbourne, VIC
- 3 Sydney Nursing School, University of Sydney, Sydney, NSW
- 4 Central Clinical School, Monash University, Melbourne, VIC
- 5 The George Institute for Global Health, Sydney, NSW
- 6 The University of New South Wales, Sydney, NSW
- 7 College of Medicine and Public Health, Flinders University, Adelaide, SA
- 8 Curtin University, Perth, WA
- 9 Brain Injury Australia, Sydney, NSW
Open access:
Open access publishing facilitated by Monash University, as part of the Wiley – Monash University agreement via the Council of Australian University Librarians.
The Australian Traumatic Brain Injury National Data (ATBIND) Project, in which all authors are either chief investigators or project research staff, received funding from the Medical Research Future Fund (MRFF) Research Grants: Traumatic Brain Injury Mission (MRF2007671) on 30 June 2021. The Australia New Zealand Trauma Registry, fundamental to the success of the ATBIND Project, has received contributions from the Australian Department of Health and Aged Care (administration of the ATR: GO2992) and non‐government sources (Accident Compensation Corporation, New Zealand). The salaries of Courtney Ryder, Delia Hendrie, Afsana Afroz, Emma Solly, and Shane D'Angelo are funded by the MRFF Traumatic Brain Injury Mission grant.
The following organisations have contributed significantly to the design of the protocol or its implementation: the National Trauma Research Institute, the Alfred Hospital, Monash University, the Australia and New Zealand Trauma Registry, the George Institute for Global Health, the University of Sydney, Brain Injury Australia, Flinders University, and Curtin University.
No relevant disclosures.
- 1. World Health Organization. Injuries and violence. 19 Mar 2021. https://www.who.int/news‐room/fact‐sheets/detail/injuries‐and‐violence (viewed July 2023).
- 2. Dewan MC, Rattani A, Gupta S, et al. Estimating the global incidence of traumatic brain injury. J Neurosurg 2018; 130: 1080‐1097.
- 3. GBD 2016 Traumatic Brain Injury and Spinal Cord Injury Collaborators. Global, regional, and national burden of traumatic brain injury and spinal cord injury, 1990–2016: a systematic analysis for the Global Burden of Disease Study 2016. Lancet Neurol 2019; 18: 56‐87.
- 4. Queensland Brain Institute. What is traumatic brain injury? 26 June 2018. https://qbi.uq.edu.au/concussion/what‐traumatic‐brain‐injury (viewed July 2023).
- 5. Savitsky B, Givon A, Rozenfeld M, et al. Traumatic brain injury: it is all about definition. Brain Inj 2016; 30: 1194‐1200.
- 6. Menon DK, Schwab K, Wright DW, Maas AI; Demographics and Clinical Assessment Working Group of the International and Interagency Initiative toward Common Data Elements for Research on Traumatic Brain Injury and Psychological Health. Position statement: definition of traumatic brain injury. Arch Phys Med Rehabil 2010; 91: 1637‐1640.
- 7. Malec JF, Brown AW, Leibson CL, et al. The Mayo classification system for traumatic brain injury severity. J Neurotrauma 2007; 24: 1417‐1424.
- 8. Fitzgerald M, Tan T, Rosenfeld JV, et al. An initial Glasgow Coma Scale score of 8 or less does not define severe brain injury. Emerg Med Australas 2022; 34: 459‐461.
- 9. Australian Department of Health and Aged Care. Traumatic Brain Injury Mission. Updated 2 June 2023. https://www.health.gov.au/initiatives‐and‐programs/traumatic‐brain‐injury‐mission (viewed July 2023).
- 10. Australian Institute of Health and Welfare. Injury in Australia. Updated 6 July 2023. https://www.aihw.gov.au/reports/injury/injury‐in‐australia/contents/all‐causes‐of‐injury (viewed July 2023).
- 11. Fortune N, Wen X. The definition, incidence and prevalence of acquired brain injury in Australia (Cat. no. DIS 15). 20 Dec 1999. https://www.aihw.gov.au/reports/disability/definition‐incidence‐prevalence‐of‐brain‐injury‐au/summary (viewed July 2023).
- 12. O'Reilly GM, Curtis K, Kim Y, et al. Establishing determinants and quality indicators for getting home alive following moderate to severe traumatic brain injury: the Australian Traumatic Brain Injury National Data Project. Emerg Med Australas 2021; 33: 1121‐1123.
- 13. O'Reilly GM, Curtis K, Kim Y, et al. The Australian Traumatic Brain Injury National Data (ATBIND) project: a mixed methods study protocol. Med J Aust 2022; 217: 361‐365. https://www.mja.com.au/journal/2022/217/7/australian‐traumatic‐brain‐injury‐national‐data‐atbind‐project‐mixed‐methods
- 14. Fitzgerald MC, Curtis K, Cameron PA, et al; AusTQIP Consortium. The Australian trauma registry. ANZ J Surg 2019; 89: 286‐290.
- 15. Association for the Advancement of Automotive Medicine. Abbreviated Injury Scale. Undated. https://www.aaam.org/abbreviated‐injury‐scale‐ais (viewed July 2023).
- 16. Australia New Zealand Trauma Registry. Bi‐National Trauma Minimum Dataset (BNTMDS) Australia and New Zealand. Core data items data dictionary, version 1.51. Sept 2018. https://atr.org.au/s/BNTMDS_v151.pdf (viewed July 2023).
- 17. Australian Bureau of Statistics. National, state and territory population. https://www.abs.gov.au/statistics/people/population/national‐state‐and‐territory‐population (viewed July 2023).
- 18. Pozzato I, Tate RL, Rosenkoetter U, Cameron ID. Epidemiology of hospitalised traumatic brain injury in the state of New South Wales, Australia: a population‐based study. Aust N Z J Public Health. 2019; 43: 382‐388.
- 19. Bierbaum M, Lystad RP, Curtis K, Mitchell R. Incidence and severity of head injury hospitalisations in Australian children over a 10‐year period. Health Promot J Aust 2019; 30: 189‐198.
- 20. Brown E, Tohira H, Bailey P, et al. A comparison of major trauma patient transport destination in metropolitan Perth, Western Australia. Australas Emerg Care 2020; 23: 90‐96.
- 21. Stephens S, Campbell R, Chaseling R, Ma N. Traumatic brain injuries in a paediatric neurosurgical unit: a Queensland experience. J Clin Neurosci 2019; 70: 27‐32.
- 22. Hunter K, Bestman A, Elkington J, et al. National Injury Prevention Strategy: literature review. The George Institute for Global Health; July 2019. https://www.georgeinstitute.org.au/national‐injury‐prevention‐strategy‐literature‐review (viewed July 2023).
- 23. Australian Department of Health and Aged Care. National Injury Prevention Strategy. Updated 2 June 2023. https://www.health.gov.au/our‐work/national‐injury‐prevention‐strategy (viewed July 2023).
- 24. American Society For Biochemistry and Molecular Biology. Brain Injury Awareness Month 2021. ASBMB Today, 1 Mar 2021. https://www.asbmb.org/asbmb‐today/science/030121/brain‐injury‐awareness‐month‐2021 (viewed July 2023).
- 25. Brazinova A, Rehorcikova V, Taylor MS, et al. Epidemiology of traumatic brain injury in Europe: a living systematic review. J Neurotrauma 2021; 38: 1411‐1440.
Abstract
Objective: To describe the frequency of hospitalisation and in‐hospital death following moderate to severe traumatic brain injury (TBI) in Australia, both overall and by patient demographic characteristics and the nature and severity of the injury.
Design, setting: Cross‐sectional study; analysis of Australia New Zealand Trauma Registry data.
Participants: People with moderate to severe TBI (Abbreviated Injury Score [head] greater than 2) who were admitted to or died in one of the twenty‐three major Australian trauma services that contributed data to the ATR throughout the study period, 1 July 2015 – 30 June 2020.
Major outcome measures: Primary outcome: number of hospitalisations with moderate to severe TBI; secondary outcome: number of deaths in hospital following moderate to severe TBI.
Results: During 2015–20, 16 350 people were hospitalised with moderate to severe TBI (mean, 3270 per year), of whom 2437 died in hospital (14.9%; mean, 487 per year). The mean age at admission was 50.5 years (standard deviation [SD], 26.1 years), and 11 644 patients were male (71.2%); the mean age of people who died in hospital was 60.4 years (SD, 25.2 years), and 1686 deaths were of male patients (69.2%). The overall number of hospitalisations did not change during 2015–20 (per year: incidence rate ratio [IRR], 1.00; 95% confidence interval [CI], 0.99–1.02) and death (IRR, 1.00; 95% CI, 0.97–1.03).
Conclusion: Injury prevention and trauma care interventions for people with moderate to severe TBI in Australia reduced neither the incidence of the condition nor the associated in‐hospital mortality during 2015–20. More effective care strategies are required to reduce the burden of TBI, particularly among younger men.