


Summary box
The known: Inherited retinal diseases (IRDs) have significant cost implications, both for people with these disorders and for their families. Comprehensive information about the costs of IRDs in Australia, however, have not been published.
The new: Using a microsimulation model, we estimated an overall lifetime cost of $5.2 million per person with an IRD. Societal costs, including government support and lost income for people with impaired sight and their families, accounted for 87% of all costs, health care costs for only 13%.
The implications: To correctly assess the cost‐effectiveness of IRD treatments, including genomic testing and gene therapies, the substantial societal costs of IRDs must be taken into account.
Inherited retinal diseases (IRDs) comprise a group of heterogeneous monogenic disorders characterised by retinal dysfunction and degeneration, often leading to progressive vision loss and blindness.1 Genomic variant prevalence data suggest that IRDs affect about one in 1000 people,2,3 and IRDs are now the leading cause of blindness in working age adults.4 As early onset of disease often causes significant vision deficits during childhood and throughout life, their impact, both on those directly affected and on their families, is considerable.5
The limited treatment options in Australia have gradually improved since voretigene neparvovec (Luxturna, Novartis) was approved for people with RPE65 retinopathy in 2020, the first publicly subsidised in vivo gene therapy in Australia;6 the first patient was treated in the same year.7 The Medical Services Advisory Committee (MSAC) acknowledged the clinical need for an effective treatment, but also noted some limitations, including in the cost–effectiveness analysis for the application (which did not take benefits for carers into account), and required a full review within three years of its approval.8
The impact of vision loss includes increased risk of poverty, reduced quality of life and employment opportunities, and greater expenses for informal care.9,10,11 Information on the total cost of IRDs, including use of health and social services, education, employment and income, is limited.10,12 In the United States, mean annual health care costs for people with IRDs were US$7317 higher than for the general population,13 but this estimate, like those of other overseas studies,14,15 did not take all health care (eg, allied health, vision aids) and other costs into account.
Two recent overseas investigations found that the annual national costs of IRDs are considerable: US$13.4–31.8 billion in the United States and CAN$1.6–6.7 billion in Canada,16 and £42.6 million in Ireland and £523.3 million in the United Kingdom.17 The costs associated with reduced workforce participation and quality of life were substantial, health care expenses comprising only 2–7% of total costs. However, these studies included people with non‐IRD vision impairment, included large loss of quality of life components in addition to disease costs, did not compare income losses for people with IRDs with mean population incomes, did not control for factors such as age and education, and relied on mean welfare payments and tax rates rather than collecting primary data on these items. Further, their online surveys of people with vision impairment were subject to selection biases (including vision capacity).
A health care system and societal perspective is needed when assessing the costs and benefits of new clinical interventions, including genomic testing and targeted therapies. However, no complete overview of the costs associated with IRDs in Australia has been reported. We therefore estimated the health and societal costs of IRDs, analysing both primary and administrative health care data for a group of people with IRDs and their carers. We used microsimulation modelling to estimate income losses, important flow‐on costs (eg, subsidies for housing), and National Disability Insurance Scheme (NDIS) costs.
Methods
Our microsimulation modelling study is one component of the Economic and Psychosocial Impact of Caring for Families Affected by Visual Impairment (EPIC‐Vision) study. All people with clinical IRD diagnoses who had ophthalmic or genetic consultations at the Children's Hospital at Westmead or the Save Sight Institute (Sydney Eye Hospital campus, University of Sydney) during 1 January 2019 – 31 December 2020 and their carers or partners were invited to participate. Specialist clinicians interviewed participants using the EPIC‐Vision questionnaire, a tailored IRD questionnaire designed in consultation with ophthalmologists, clinical geneticists, genetic counsellors, and health economists; it includes questions on social services use (government support, NDIS) and other costs (education, aids, and modifications). When appropriate, carers were also interviewed on behalf of people with IRDs, including all those under 18 years of age.
Costs analysis
Costs data for our simulation model were derived from the EPIC‐Vision questionnaire responses and from linked Medicare Benefits Schedule (MBS) and Pharmaceutical Benefits Schedule (PBS) data. This information was provided to Services Australia, which performed the data linkage and supplied de‐identified data to the investigators. The health care‐related, income and employment, and societal parameters included and their data sources, together with the indices used for adjustment to December 2022 prices, are summarised in the Supporting Information. All analyses were undertaken in SAS 9.4.
Income and tax effects
We estimated the income and tax effects of IRDs in a static income model (STINMOD) based on a representative sample of people and households in Australia (Box 1). People with IRDs and their carers and partners were matched in STINMOD with respect to age, gender, and highest level of education, and 1000 simulations run for each person. The mean outcomes were then used as the counterfactuals for each participant (ie, the estimated value if they did not have an IRD), and the effect of the IRD defined as the difference between the simulation outcomes and EPIC‐Vision data for the participant. STINMOD data reflect income and tax levels at the end of 2019.18
Household and lifetime cost
Participants were grouped by age (0–5, 6–18, 19–29, 30–39, 40–49, 50–59, 60–69, 70–80 years). Total lifetime costs were calculated from the mean costs for each age group. As none of the participants were over 80 years of age, we used mean annual costs for the 70–80 year age group to project costs to the mean life expectancy age in Australia (84 years).19 The estimated total costs for each person diverge from the sum of the component costs because of an adjustment that reflects the fact that as income declines for an individual, they receive increasing welfare support.
Visual acuity and inherited retinal disease diagnosis
To assess whether costs differed by visual acuity, we estimated a model in which people were grouped as to whether they were eligible to be registered as being legally blind in Australia (Snellen visual acuity poorer than 6/60) or had measured visual acuity of better than normal to moderate vision impairment (6/60 or better).
Health and societal costs
Health costs are costs related directly to the health system and use of health products such as pharmaceuticals. Societal costs refer to all other costs, including income losses, as well as government service and NDIS costs. We report the proportions of all costs attributed to health and societal costs.
Total national costs
Because of uncertainty regarding the prevalence of IRDs, we used two estimated values for estimating total national costs: 0.1%1 and 0.05%.20
Ethics approval
The EPIC‐Vision study was approved by the Sydney Children's Hospitals Network Human Research Ethics Committee (HREC/18/SCHN/292).
Results
Of 112 adults invited to participate in the study, 74 agreed to do so (66%) and 71 completed the survey (63%). Their mean age was 42.1 years (standard deviation [SD], 17.3 years) and 47 were women (66%). The visual acuity of 39 participants (53%) was less than 6/60 (legally blind). Twenty‐two people were working full‐time (31%), 22 part‐time (31%), eight were unemployed and looking for work (11%), and nineteen were unemployed and not looking for paid work (27%); for eighteen of those not in paid employment, health was cited as the reason. Four participants were Aboriginal or Torres Strait Islander people (6%; 2021 census: 3%21) and nineteen were not born in Australia (28%; 2021 census: 29%22); 29 had NDIS plans (41%) (Box 2).
Carers completed surveys on behalf of ten adults with IRDs; the mean age of these adults was 31.7 years (SD, 17.6 years), and visual acuity less than 6/60 vision for nine. Seven of these adults also completed surveys themselves; their responses, not the proxy responses of their carers, were included in our analysis.
Of thirty people under 18 years invited to participate, the carers of twenty agreed on their behalf and completed the surveys (66%). Their mean age was 11.0 years (SD, 4.6 years) and eight were girls (40%). The visual acuity of ten children (50%) was less than 6/60 (legally blind); twelve had NDIS plans (60%) (Box 2).
Of 47 carers invited to participate in the study, thirty agreed to do so and completed the surveys (63%). Their mean age was 47.0 years (SD, 11.0 years) and 25 were women (83%). Nineteen carers had university degrees (63%); ten had full‐time employment (33%), nine had part‐time work (30%), and eleven (30%) were not employed (Box 2).
Overall costs
The total estimated lifetime cost was $5.2 million per person with an IRD and $5.6 million per household. The mean annual cost was highest for the 50–59‐year age group ($96 167), attributable to income loss for both people with IRDs and for their spouses and carers. The mean annual cost was lowest for the 18–29 (smaller income losses) and 70–80‐year age groups (not eligible for NDIS plans) (Box 3). Of total costs, 87% were societal costs and 13% health care costs. The three highest cost items were $1.4 million in lost income for people with IRDs, $1.1 million in lost income for their carers and spouses, and $1.0 million in social spending by the Australian government (excluding NDIS expenses) (Box 4). The mean annual costs were about 40% higher for male than female participants (Box 5), including greater loss of income and NDIS expenses (data not shown).
Health care costs
Total lifetime health care costs were estimated to be $690 725 per person with an IRD: $324 429 borne by the Australian government (47%), $206 614 by state governments (30%), $120 789 by people with IRDs (17%), and $38 893 by private insurance (6%) (Box 4). Lifetime health care costs were highest for the 0–5 year age group (higher health service use) and the 30–39 year age group (explained by extended hospital stays for one person with an IRD) (Box 3).
Income and taxes
Total estimated lifetime loss of income was $2.6 million per person with an IRD (people with IRDs, $1 440 453 [56%]; carers and spouses, $1 137 364 [44%]) (Box 4). Mean annual lost income for people with IRDs aged 19–30 years was $4286, and peaked at $44 494 for those aged 50–59 years (Box 3). Total estimated lifetime loss in federal tax receipts was $816 171 (Box 4); the highest mean annual loss was for people aged 50–59 years (Box 3).
Federal government social and welfare support
Total estimated lifetime Australian government social support costs (excluding the NDIS) was $1.0 million per person with an IRD; total lifetime NDIS costs for a person with an IRD were $749 462 (Box 4). Social support costs were generally higher for older age groups (Box 3). The estimated lifetime cost to the federal government for social support for carers and spouses was $264 113 per person with an IRD (Box 4), primarily associated with caring for a person under 18 years of age with an IRD (Box 3).
Visual acuity
The total estimated annual cost for people with visual acuity poorer than 6/60 (ie, legally blind) were $83 910 per person, more than twice those for people with IRDs but whose visual acuity was at least 6/60 (Box 5); the difference was attributable to greater lost income and higher social support costs (including NDIS costs). However, total health care costs were slightly lower for the people with visual acuity poorer than 6/60 (data not shown).
Total national annual cost
The estimated total annual cost attributable to IRDs in Australia was $781 million to $1.56 billion. After adjusting for the larger proportion of female participants with IRDs in our study, the estimated annual cost was $830 million to $1.66 billion (data not shown).
Discussion
On the basis of primary and linked administrative data, we estimate that the lifetime cost associated with an IRD is $5.2 million per person, or a total of $781 million to $1.56 billion per year. Of these costs, 87% are societal costs and 13% health care costs.
Previous studies have found that vision loss in general is associated with substantial costs.11,12,23,24 Interpreting the findings of two recent studies specifically concerned with IRDs16,17 is made difficult by their data limitations and imprecise estimates of income losses. In our study, microsimulation modelling overcame these limitations by matching a group of people with diagnosed IRDs and their carers with people in the general population with similar characteristics rather than relying on comparisons with mean population income. This approach provides more precise estimates of the income and tax values we would expect for our participants if they did not have IRDs. Further, we found that estimated costs were highest for the 50–59‐year age group, primarily because of lost income.
People with IRDs receive a mixture of NDIS services, and their lifetime NDIS costs are greater than their health care costs. As people with NDIS plans before the age of 65 years can choose to remain in the NDIS beyond this age, our modelling would underestimate costs for people over 65 were the NDIS to support more services in the future than are currently available to people over 65 years of age.
We found that IRDs are associated with substantial income losses, exceeding $44 000 per year for people aged 50–59 years. This finding was consistent with comments by survey participants that they worked less because of their IRD or had left the workforce entirely. This suggests that helping people with IRDs with employment could improve societal outcomes. The impacts on both carers and spouses were also notable. For carers, lost income was largely linked with caring for children with IRDs. Although spouses might not be full‐time carers, the burden could nevertheless affect their ability to undertake paid work.
Health care costs were slightly higher for people with better vision, but overall costs were much higher for those who were legally blind. Societal costs must be considered when assessing the costs and benefits of IRDs, as health care cost estimates may not capture all costs.
Out‐of‐pocket health expenses comprised a small portion of total health costs, consistent with the lack of treatment options available for people with IRDs. They also spend substantial amounts on housing and transport modifications, and they may not be aware of all support provided by health care, the NDIS, and other agencies and consequently not receive appropriate support. Further, as some data were collected during the early phases of the coronavirus disease 2019 pandemic, our estimates of service use and related costs may be conservative.
Limitations
The data for our study were collected from a large group of people with IRDs, allowing a comprehensive assessment of costs. Further, our simulation model was designed to be adaptable and applicable to other medical conditions. However, as the proportion of women in our study was larger than in the Australian population, income loss may have been underestimated, given the higher employment and income rates of men and the greater use of health services by women. Finally, we did not include any people near the end of life living in institutions such as nursing homes. The health care and other costs for people with IRDs near the end of life require further investigation.
Conclusion
In our simulation study, we identified that IRDs are associated with substantial health care and societal costs. Given that 87% of the overall costs were societal, largely related to lower rates of employment for both patients and carers and their greater need for social support, it is crucial that societal costs are considered by cost‐effectiveness evaluations of future IRD interventions, including genomic testing and targeted therapies.
Box 1 – The microsimulation model used for estimating income and tax costs associated with inherited retinal diseases
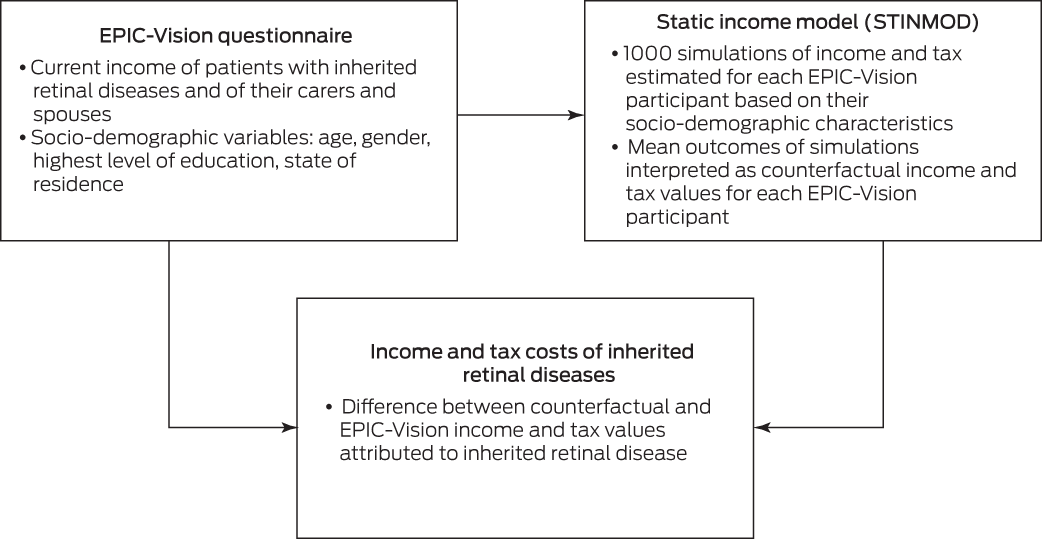
EPIC‐Vision = Economic and Psychosocial Impact of Caring for Families Affected by Visual Impairment study.
Box 2 – Characteristics of the people with inherited retinal disease and their carers who participated in the EPIC‐Vision survey, 2019 and 2020
|
|
People with inherited retinal diseases |
|
|||||||||||||
|
Characteristic |
Adults* |
Children† |
Carers |
||||||||||||
|
|
|||||||||||||||
|
Participants |
74 |
20 |
30 |
||||||||||||
|
Age (years), mean (SD) |
42.1 (17.3) |
11.0 (4.6) |
47.0 (11.0) |
||||||||||||
|
Gender |
|
|
|
||||||||||||
|
Women |
47 (64%) |
8 (40%) |
25 (83%) |
||||||||||||
|
Men |
27 (36%) |
12 (60%) |
5 (5%) |
||||||||||||
|
Aboriginal or Torres Strait Islander Australians‡ |
7 (6%) |
NA |
0 |
||||||||||||
|
Born in Australia‡ |
|
|
|
||||||||||||
|
Yes |
50 (70%) |
NA |
16 (53%) |
||||||||||||
|
No |
19 (27%) |
NA |
14 (47%) |
||||||||||||
|
No response |
2 |
NA |
0 |
||||||||||||
|
Visual acuity |
|
|
|
||||||||||||
|
> 6/18 (normal to mild visual impairment) |
15 (20%) |
5 (25%) |
NA |
||||||||||||
|
6/18 to 6/60 (moderate visual impairment) |
20 (27%) |
5 (25%) |
NA |
||||||||||||
|
< 6/60 (legally blind; severe visual impairment) |
22 (30%) |
< 5 |
NA |
||||||||||||
|
< 3/60 (legally blind; profound visual impairment) |
17 (23%) |
6 (30%) |
NA |
||||||||||||
|
Inherited retinal disease diagnosis§ |
|
|
|
||||||||||||
|
Rod‐dominated inherited retinal disease |
34 (46%) |
< 5 |
NA |
||||||||||||
|
Macular dystrophy |
15 (20%) |
< 5 |
NA |
||||||||||||
|
Cone‐dominated inherited retinal disease |
12 (16%) |
5 (25%) |
NA |
||||||||||||
|
Inherited retinal disease, and a systemic disorder |
13 (18%) |
9 (45%) |
NA |
||||||||||||
|
National Disability Insurance Scheme plan |
|
|
|
||||||||||||
|
No, awaiting decision; or applied and did not receive a package |
7 (9%) |
< 5 |
NA |
||||||||||||
|
No, I have never applied |
35 (47%) |
6 (30%) |
NA |
||||||||||||
|
Yes |
32 (43%) |
12 (60%) |
NA |
||||||||||||
|
Employment status‡ |
|
|
|
||||||||||||
|
Full‐time paid work |
22 (31%) |
NA |
10 (33%) |
||||||||||||
|
Part‐time paid work |
22 (31%) |
NA |
9 (30%) |
||||||||||||
|
Unemployed, looking for paid work |
8 (11%) |
NA |
< 5 |
||||||||||||
|
Unemployed, not looking for paid work |
19 (27%) |
NA |
8 (27%) |
||||||||||||
|
Reason for being out of work‡ |
|
|
|
||||||||||||
|
Ill health or disability |
18/27 (67%) |
NA |
NA |
||||||||||||
|
Caring for child/relative with inherited retinal disease |
NA |
NA |
5 (50%) |
||||||||||||
|
Other |
9/27 (33%) |
NA |
5 (50%) |
||||||||||||
|
Main source of income‡ |
|
|
|
||||||||||||
|
Wage/salary |
33 (46%) |
NA |
NA |
||||||||||||
|
Self‐employed |
5 (7%) |
NA |
NA |
||||||||||||
|
Government benefits |
25 (35%) |
NA |
NA |
||||||||||||
|
Investments/superannuation |
5 (7%) |
NA |
NA |
||||||||||||
|
Other or no income |
< 5 |
NA |
NA |
||||||||||||
|
Highest education level‡ |
|
|
|
||||||||||||
|
Less than year 12 |
8 (11%) |
NA |
5 (17%) |
||||||||||||
|
Year 12 |
14 (20%) |
NA |
0 |
||||||||||||
|
Trade/apprenticeship |
5 (7%) |
NA |
0 |
||||||||||||
|
Certificate/diploma |
12 (17%) |
NA |
6 (20%) |
||||||||||||
|
University degree |
20 (28%) |
NA |
12 (40%) |
||||||||||||
|
Higher university degree |
12 (17%) |
NA |
7 (23%) |
||||||||||||
|
|
|||||||||||||||
|
EPIC‐Vision = Economic and Psychosocial Impact of Caring for Families Affected by Visual Impairment; NA = not applicable; SD = standard deviation. * Includes three adults for whom carers completed the survey as proxies; for the characteristics marked with a double dagger (see below), the denominator for proportions is consequently 71, not 74. For seven cases in which both the person with an IRD and their carer completed the survey question on costs, the responses of the person with an IRD were used. † Completed by their family carers as proxies. ‡ Asked only of adults completing the survey on their own behalf. § Rod‐dominated inherited retinal disease includes rod–cone dystrophy, retinitis pigmentosa, choroideraemia, enhanced S‐cone syndrome, and Leber congenital amaurosis. Macular dystrophy includes Stargardt diseases and other macular dystrophy types. Cone‐dominated IRD includes cone‐rod dystrophy, cone dystrophy, and achromatopsia. IRD plus systemic disorder includes Usher syndrome and other. |
|||||||||||||||
Box 3 – Estimated mean annual costs associated with inherited retinal diseases (IRDs), per person, by age group and expense type (Australian dollars, December 2022 prices)
|
|
Age group (years) |
||||||||||||||
|
Characteristic |
0–5 |
6–18 |
19–29 |
30–39 |
40–49 |
50–59 |
60–69 |
70–84 |
|||||||
|
|
|||||||||||||||
|
People with IRDs |
6 |
17 |
21 |
9 |
15 |
14 |
6 |
6 |
|||||||
|
Costs for person with IRD |
|
|
|
|
|
|
|
|
|||||||
|
Australian government |
|
|
|
|
|
|
|
|
|||||||
|
Health system |
15 859 |
1675 |
874 |
9767 |
2003 |
2693 |
3382 |
2 522 |
|||||||
|
Social support |
1335 |
7955 |
11 430 |
10 889 |
10 999 |
15 653 |
16 683 |
17 025 |
|||||||
|
National Disability Insurance Scheme |
7948 |
7844 |
4106 |
7895 |
5365 |
3910 |
7612 |
— |
|||||||
|
Tax receipts |
— |
282 |
599 |
9015 |
11 535 |
17 198 |
8373 |
333 |
|||||||
|
State government |
|
|
|
|
|
|
|
|
|||||||
|
Health system |
14 482 |
272 |
158 |
9020 |
933 |
1000 |
1079 |
615 |
|||||||
|
Social support |
4004 |
4314 |
— |
— |
— |
— |
333 |
— |
|||||||
|
National Disability Insurance Scheme |
5755 |
5680 |
2973 |
5717 |
3885 |
2831 |
5512 |
— |
|||||||
|
People with IRDs |
|
|
|
|
|
|
|
|
|||||||
|
Health care costs |
3655 |
1198 |
894 |
825 |
1968 |
1533 |
2108 |
912 |
|||||||
|
Other |
3266 |
2646 |
544 |
343 |
416 |
793 |
1210 |
1137 |
|||||||
|
Lost income |
— |
1263 |
4286 |
31 163 |
29 009 |
44 494 |
29 028 |
2853 |
|||||||
|
Other (private hospital services) |
79 |
56 |
45 |
105 |
221 |
1181 |
1339 |
630 |
|||||||
|
Costs for carers and spouses |
|
|
|
|
|
|
|
|
|||||||
|
Australian government |
|
|
|
|
|
|
|
|
|||||||
|
Social support |
9356 |
13 721 |
2348 |
751 |
— |
— |
563 |
— |
|||||||
|
Tax receipts |
4587 |
11 122 |
3889 |
200 |
577 |
5250 |
4043 |
2074 |
|||||||
|
Carers and spouses |
|
|
|
|
|
|
|
|
|||||||
|
Lost income |
16 210 |
32 408 |
11 796 |
1112 |
1185 |
14 841 |
15 862 |
12 518 |
|||||||
|
Total annual costs* |
77 181 |
74 185 |
34 798 |
75 215 |
57 320 |
96 167 |
80 650 |
23 788 |
|||||||
|
Lifetime costs † |
|
|
|
|
|
|
|
|
|||||||
|
Per person |
385 906 |
1 350 313 |
1 733 090 |
2 485 243 |
3 058 440 |
4 020 110 |
4 826 609 |
5 159 644 |
|||||||
|
Per household |
416 372 |
1 456 916 |
1 869 913 |
2 681 447 |
3 299 896 |
4 337 487 |
5 207 657 |
5 566 985 |
|||||||
|
|
|||||||||||||||
|
* The estimated total costs will diverge from the sum of the components because of adjustment to reflect the fact that as income declines for an individual, they receive welfare support. † To the end of the corresponding age bracket. The household value assumes that each household statistically includes slightly more than one person with an inherited retinal disease. |
|||||||||||||||
Box 4 – Estimated lifetime costs associated with inherited retinal diseases, per person, by expense type and payer (Australian dollars, December 2022 prices)
|
Characteristic |
Value |
||||||||||||||
|
|
|||||||||||||||
|
Australian government |
2 855 820 |
||||||||||||||
|
Health care |
324 429 |
||||||||||||||
|
Social support* (person) |
1 016 419 |
||||||||||||||
|
National Disability Insurance Scheme |
434 688 |
||||||||||||||
|
Social spending (carer) |
264 113 |
||||||||||||||
|
Tax receipts (person) |
476 140 |
||||||||||||||
|
Tax receipts (carer/spouse) |
340 031 |
||||||||||||||
|
State government |
600 828 |
||||||||||||||
|
Health care |
206 614 |
||||||||||||||
|
Social support (person) |
79 439 |
||||||||||||||
|
National Disability Insurance Scheme |
314 774 |
||||||||||||||
|
Person/household |
2 798 860 |
||||||||||||||
|
Health care† |
120 789 |
||||||||||||||
|
Other, including aids/modifications |
100 254 |
||||||||||||||
|
Lost income (person) |
1 440 453 |
||||||||||||||
|
Lost income (spouse/carer) |
1 137 364 |
||||||||||||||
|
Private health insurance costs‡ |
38 893 |
||||||||||||||
|
Total cost (after adjustment)§ |
5 159 644 |
||||||||||||||
|
|
|||||||||||||||
|
* Excludes National Disability Insurance Scheme expenses. † Medicare co‐payments, orthoptics, alternative medicines, transport and accommodation costs linked with hospital stays. ‡ For hospital services. § The estimated total costs will diverge from the sum of its components because of adjustment to reflect the fact that as income declines for an individual, they receive welfare support. |
|||||||||||||||
Box 5 – Estimated annual costs for people with inherited retinal diseases, per person, by gender and visual acuity (Australian dollars, December 2022 prices)
|
Characteristic |
Value |
||||||||||||||
|
|
|||||||||||||||
|
Gender |
|
||||||||||||||
|
Girls/women (N = 55) |
54 527 |
||||||||||||||
|
Boys/men (N = 39) |
76 067 |
||||||||||||||
|
Visual acuity |
|
||||||||||||||
|
Better than or equal to 6/60 (N = 45) |
41 357 |
||||||||||||||
|
Less than 6/60 (N = 49) |
83 910 |
||||||||||||||
|
|
|||||||||||||||
|
|
|||||||||||||||
Received 25 November 2022, accepted 9 May 2023
- Deborah Schofield1
- Joshua Kraindler1
- Owen Tan1
- Rupendra N Shrestha1
- Sarah West1
- Natalie Hart1
- Liny Tan2,3
- Alan Ma2,3,4
- John R Grigg2,3,4
- Robyn V Jamieson2,3,4
- 1 GenIMPACT: Centre for Economic Impacts of Genomic Medicine, Macquarie Business School, Macquarie University, Sydney, NSW
- 2 Children's Medical Research Institute, Sydney Children's Hospitals Network, University of Sydney, Sydney, NSW
- 3 Save Sight Institute, University of Sydney, Sydney, NSW
- 4 The University of Sydney, Sydney, NSW
Open access:
Open access publishing facilitated by Macquarie University, as part of the Wiley – Macquarie University agreement via the Council of Australian University Librarians.
This project was supported by the National Health and Medical Research Council (NHMRC) Centre for Research Excellence (APP 1116360: From discovery to therapy in genetic eye diseases) and the Luminesce Alliance, a not‐for‐profit cooperative joint venture involving the Sydney Children's Hospitals Network, the Children's Medical Research Institute, and the Children's Cancer Institute, established with the support of the New South Wales government. Luminesce Alliance is also affiliated with the University of Sydney and the University of New South Wales. Alan Ma is supported by a Sydney Health Partners Early Career Research Fellowship. The funders had no role in the planning, writing or publication of this work and no role in the study design, data collection, analysis or interpretation, reporting or publication.
We thank Laura Wedd (Children's Medical Research Institute, the University of Sydney) for her assistance with the study and data entry and preparation.
Deborah Schofield, Robyn Jamieson, and John Grigg are supported by grant funding from the NHMRC (APP1116360) and the Luminesce Alliance. John Grigg and Robyn Jamieson have received consultancy fees from Novartis and are principal investigators in clinical trials undertaken by Belite Bio and Nacuity Pharmaceuticals. Robyn Jamieson is named on Australian provisional patent applications 2020904689 (AAV capsids and vectors) and 2022903363 (Treatment methods for inherited retinal diseases).
- 1. Duncan JL, Pierce EA, Laster AM, et al. Foundation Fighting Blindness Scientific Advisory Board. Inherited retinal degenerations: current landscape and knowledge gaps. Transl Vis Sci Technol 2018; 7: 6.
- 2. Liew G, Michaelides M, Bunce C. A comparison of the causes of blindness certifications in England and Wales in working age adults (16–64 years), 1999–2000 with 2009–2010. BMJ Open 2014; 4: e004015.
- 3. Hanany M, Rivolta C, Sharon D. Worldwide carrier frequency and genetic prevalence of autosomal recessive inherited retinal diseases. Proc Natl Acad Sci U S A 2020; 117: 2710‐2716.
- 4. Viriato D, Bennett N, Sidhu R, et al. An economic evaluation of voretigene neparvovec for the treatment of biallelic RPE65‐mediated inherited retinal dystrophies in the UK. Adv Ther 2020; 37: 1233‐1247.
- 5. Grigg J, Jamieson R, Chen F, et al. Guidelines for the assessment and management of patients with inherited retinal diseases (IRD). Royal Australia and New Zealand College of Ophthalmologists; 1 Feb 2020. https://ranzco.edu/policies_and_guideli/guidelines‐for‐the‐assessment‐and‐management‐of‐patients‐with‐inherited‐retinal‐degenerations‐ird (viewed Mar 2022).
- 6. Therapeutic Goods Administration. Luxturna [Australian prescription medicine decision summaries]. 13 Aug 2020. https://www.tga.gov.au/apm‐summary/luxturna (viewed June 2022).
- 7. Australian Broadcasting Corporation. Gene therapy prevents teens going blind [video]. ABC News (Australia), 7 Oct 2021. https://www.abc.net.au/news/2021‐10‐07/gene‐therapy‐prevents‐teens‐going‐blind/13575768 (viewed June 2022).
- 8. Medical Services Advisory Committee. 1623. Voretigene neparvovec (Luxturna) for the treatment of biallelic RPE‐65‐mediated inherited retinal dystrophies [Public summary document; application number 1623]. 2020. http://www.msac.gov.au/internet/msac/publishing.nsf/Content/925970AEEB124D57CA258536000ED370/$File/1623%20Final%20PSD.pdf (viewed June 2022).
- 9. Marques AP, Ramke J, Cairns J, et al. Global economic productivity losses from vision impairment and blindness. EClinicalMedicine 2021; 35: 100852.
- 10. Schofield D, Kraindler J, Tan O, et al. Patient‐reported health‐related quality of life in individuals with inherited retinal diseases. Ophthalmol Sci 2022; 2: 100106.
- 11. Köberlein J, Beifus K, Schaffert C, Finger RP. The economic burden of visual impairment and blindness: a systematic review. BMJ Open 2013; 3: e003471.
- 12. Bertelsen M, Linneberg A, Rosenberg T. Socio‐economic characteristics of patients with generalized retinal dystrophy in Denmark. Acta Ophthalmol 2015; 93: 134‐140.
- 13. Frick KD, Roebuck MC, Feldstein JI, et al. Health services utilization and cost of retinitis pigmentosa. Arch Ophthalmol 2012; 130: 629‐634.
- 14. Aziz K, Swenor BK, Canner JK, Singh MS. The direct healthcare cost of Stargardt disease: a claims‐based analysis. Ophthalmic Epidemiol 2021; 28: 533‐539.
- 15. Dong S, Tsao N, Hou Q, et al. US health resource utilization and cost burden associated with choroideremia. Clin Ophthalmol 2021; 15: 3459‐3465.
- 16. Gong J, Cheung S, Fasso‐Opie A, et al. The impact of inherited retinal diseases in the United States of America (US) and Canada from a cost‐of‐illness perspective. Clin Ophthalmol 2021; 15: 2855‐2866.
- 17. Galvin O, Chi G, Brady L, et al. The impact of inherited retinal diseases in the Republic of Ireland (ROI) and the United Kingdom (UK) from a cost‐of‐illness perspective. Clin Ophthalmol 2020; 14: 707‐719.
- 18. Lambert S, Percival R, Schofield D, Paul S. An introduction to STINMOD: a static microsimulation model. (STINMOD technical paper, no. 1). National Centre for Social and Economic Modelling; Oct 1994. https://research‐management.mq.edu.au/ws/portalfiles/portal/91170978/90961683.pdf (viewed Mar 2022).
- 19. Australian Bureau of Statistics. Life tables. Reference period 2019–2021. 8 Nov 2022. https://www.abs.gov.au/statistics/people/population/life‐tables/latest‐release (viewed Nov 2022).
- 20. Rattner A, Sun H, Nathans J. Molecular genetics of human retinal disease. Annu Rev Genet 1999; 33: 89‐131.
- 21. Australian Bureau of Statistics. Census of population and housing: counts of Aboriginal and Torres Strait Islander Australians. Reference period: 2021. 31 Aug 2022. https://www.abs.gov.au/statistics/people/aboriginal‐and‐torres‐strait‐islander‐peoples/census‐population‐and‐housing‐counts‐aboriginal‐and‐torres‐strait‐islander‐australians/latest‐release#references (viewed Feb 2023).
- 22. Australian Bureau of Statistics. Australia's population by country of birth. Reference period: 2021. 26 Apr 2022. https://www.abs.gov.au/statistics/people/population/australias‐population‐country‐birth/latest‐release (viewed Feb 2023).
- 23. Bramley T, Peeples P, Walt JG, et al. Impact of vision loss on costs and outcomes in Medicare beneficiaries with glaucoma. Arch Ophthalmol 2008; 126: 849‐856.
- 24. Taylor HR, Keeffe JE, Vu HT, et al. Vision loss in Australia. Med J Aust 2005; 182: 565‐568. https://www.mja.com.au/journal/2005/182/11/vision‐loss‐australia
Abstract
Objectives: To estimate the health care and societal costs of inherited retinal diseases (IRDs) in Australia.
Design, setting, participants: Microsimulation modelling study based on primary data — collected in interviews of people with IRDs who had ophthalmic or genetic consultations at the Children's Hospital at Westmead or the Save Sight Institute (both Sydney) during 1 January 2019 – 31 December 2020, and of their carers and spouses — and linked Medicare Benefits Schedule (MBS) and Pharmaceutical Benefits Schedule (PBS) data.
Main outcome measures: Annual and lifetime costs for people with IRDs and for their carers and spouses, grouped by payer (Australian government, state governments, individuals, private health insurance) and type (health care costs; societal costs: social support, National Disability Insurance Scheme (NDIS), income and taxation, costs associated with caring for family members with IRDs); estimated annual national cost of IRDs.
Results: Ninety‐four people (74 adults, 20 people under 18 years; 55 girls and women [59%]) and 30 carers completed study surveys (participation rate: adults, 66%; children, 66%; carers, 63%). Total estimated lifetime cost was $5.2 million per person with an IRD, of which 87% were societal and 13% health care costs. The three highest cost items were lost income for people with IRDs ($1.4 million), lost income for their carers and spouses ($1.1 million), and social spending by the Australian government (excluding NDIS expenses: $1.0 million). Annual costs were twice as high for people who were legally blind as for those with less impaired vision ($83 910v $41 357 per person). The estimated total annual cost of IRDs in Australia was $781 million to $1.56 billion.
Conclusion: As the societal costs associated with IRDs are much larger than the health care costs, both contributors should be considered when assessing the cost‐effectiveness of interventions for people with IRDs. The increasing loss of income across life reflects the impact of IRDs on employment and career opportunities.