


Masks effectively reduce severe acute respiratory syndrome coronavirus 2 (SARS‐CoV‐2) transmission.1 However, the impact of mask wearing over an extended period on morbidity and mortality at the population level is less clear, particularly given the interplay between mask effectiveness, population immunity, and other public health and social measures.
We recently reported the results of an integrated epidemiologic and economic agent‐based model that assessed the costs and benefits of more than one hundred coronavirus disease 2019 (COVID‐19) control policies used in Victoria, in combination with nine scenarios of SARS‐CoV‐2 variant emergence, during the eighteen months from April 2022.2 We included mask interventions implemented only during large epidemic waves that increased both general mask wearing and the proportion of mask wearing that involved respirators (eg, N95 masks). These policies had minimal impact on health outcomes.2 For this study, we extended these analyses to determine the impact of age‐stratified consistent community‐level mask wearing (ie, at all times when outside the home) on numbers of SARS‐CoV‐2 infections and COVID‐19‐related deaths.
We modelled different levels of consistent mask‐wearing by people under 60 years of age (none, 20%, 35%, 50%; lower proportions were applied to people under 20 years of age: see footnote to Box 1) together with equal or greater levels of mask wearing by people aged 60 years or more (about 20% of the population),3 to a maximum of 75%. At each level of use, 80% of masks used were assumed to be cloth or surgical masks and 20% to be respirators. Other public health and social measures were fixed. The model began in April 2022 with Omicron BA.1 and BA.2 as the dominant SARS‐CoV‐2 variants, with the gradual emergence of BA.4 and BA.5 from May 2022. We calculated quarterly and cumulative median numbers of infections and deaths (from 500 model runs for each scenario, allowing for stochastic and input parameter uncertainty) during the twelve months from April 2022. Odds ratios for the relative risk of infection for people exposed to an infected person (wearing a mask v not wearing a mask) were set at 0.47 for cloth and surgical masks and 0.20 for respirators1 (further model details: Supporting Information, supplementary methods). As we used publicly available data, we did not seek formal ethics approval for our study.
Compared with no mask wearing, consistent mask use by 20% in both age groups (under 60 years, 60 years or more) reduced the median number of infections by 16.4% (uncertainty interval [UI; 5th to 95th percentiles], –30.4% to +2.7%) and the median number of deaths by 10.6% (UI, –33.0% to +20.7%). Increasing mask wearing in both age groups to 50% reduced infections by 38.4% (UI, –96.0% to –6.7%) and deaths by 25.8% (UI, –97.0% to +26.1%). The effects at any given level of mask wearing by people under 60 were not markedly influenced by the level for people aged 60 years or more (Box 1). The largest reductions in infection and death numbers achieved were during the first quarter of the modelled time period (Box 2). The rise in the numbers of deaths during the third quarter may be related to reduced infection‐derived immunity following lower viral transmission earlier in the model run; however, the cumulative infection and death numbers were still lower for these scenarios than with zero mask wearing. The effects of mask wearing on COVID‐19‐related hospitalisations were similar to those for infections and deaths (Supporting Information, table 5).
As our model specified that older people have fewer contacts with others, but not the probability of contact with people from specific age strata, we may have underestimated the impact of protecting older people by specifically increasing mask use by people aged 60 years or more. Further, the uncertainty intervals for our modelled outputs are quite broad. This is the result of input parameter uncertainty, including for estimated mask effectiveness (Supporting Information, supplementary methods), and stochastic uncertainty (our model included only 5000 agents). Finally, our mask effectiveness estimates were based on the findings of a single study.1 The literature on mask effectiveness is highly heterogeneous,4 and the topic requires further, high quality research.
The net impact of mask wearing will vary according to the levels of other interventions, including vaccination rates. Nevertheless, our findings suggest that consistently higher mask wearing rates across all ages would reduce the cumulative infection and mortality burden in Victoria.
Box 1 – Median proportional change in cumulative numbers of infections and deaths over twelve months deaths in Victoria, April 2022 –March 2023 (based on 500 model runs with separate draws of input parameters), compared to no mask wearing by either age group
|
|
Mask wearing: people under 60 years of age* |
||||||||||||||
|
Outcome/mask wearing: people aged 60 years or more† |
20% |
35% |
50% |
||||||||||||
|
|
|||||||||||||||
|
Proportional change in cumulative infections, median (UI) |
|
|
|
||||||||||||
|
20% |
–16.4% (–30.4% to +2.7%) |
— |
— |
||||||||||||
|
35% |
–17.9% (–33.0% to +1.6%) |
–28.0% (–68.5% to –3.3%) |
— |
||||||||||||
|
50% |
–18.9% (–33.6% to +0.2%) |
–28.5% (–65.7% to –1.1%) |
–38.4% (–96.0% to –6.7%) |
||||||||||||
|
75% |
–20.0% (–35.2% to +1.4%) |
–30.0% (–79.9% to –4.4%) |
–39.6% (–96.3% to –7.5%) |
||||||||||||
|
Proportional change in cumulative deaths, median (UI) |
|
|
|
||||||||||||
|
20% |
–10.6% (–33.0% to +20.7%) |
— |
— |
||||||||||||
|
35% |
–13.2% (–40.1% to +23.2%) |
–17.3% (–54.5% to +29.6%) |
— |
||||||||||||
|
50% |
–15.2% (–38.0% to +18.7%) |
–18.5% (–52.9% to +28.5%) |
–25.8% (–97.0% to +26.1%) |
||||||||||||
|
75% |
–17.2% (–41.5% to +16.8%) |
–23.9% (–68.1% to +22.5%) |
–28.3% (–97.5% to +23.3%) |
||||||||||||
|
|
|||||||||||||||
|
UI = uncertainty interval (5th – 95th percentiles). * Mask use proportions apply to people aged 20–59 years; level for children and adolescents aged 10–19 years set to two‐thirds of this value, and for 0–9‐year‐old children to two‐thirds of the proportion for 10–19‐year‐old children and adolescents. † We only modelled mask wearing rates for people aged 60 years or more that matched or exceeded the rate for people under 60. ‡ As proportional changes were calculated for each iteration of the 500 model runs to determine the UI, the proportional changes in this table differ from those for the median numbers of infections and deaths, reported in the Supporting Information, table 4. |
|||||||||||||||
Box 2 – Modelled quarterly numbers of infections and deaths in Victoria, April 2022 –March 2023 (based on 500 model runs with separate draws of input parameters), by mask wearing levels for people under 60 years and those aged 60 years or more*
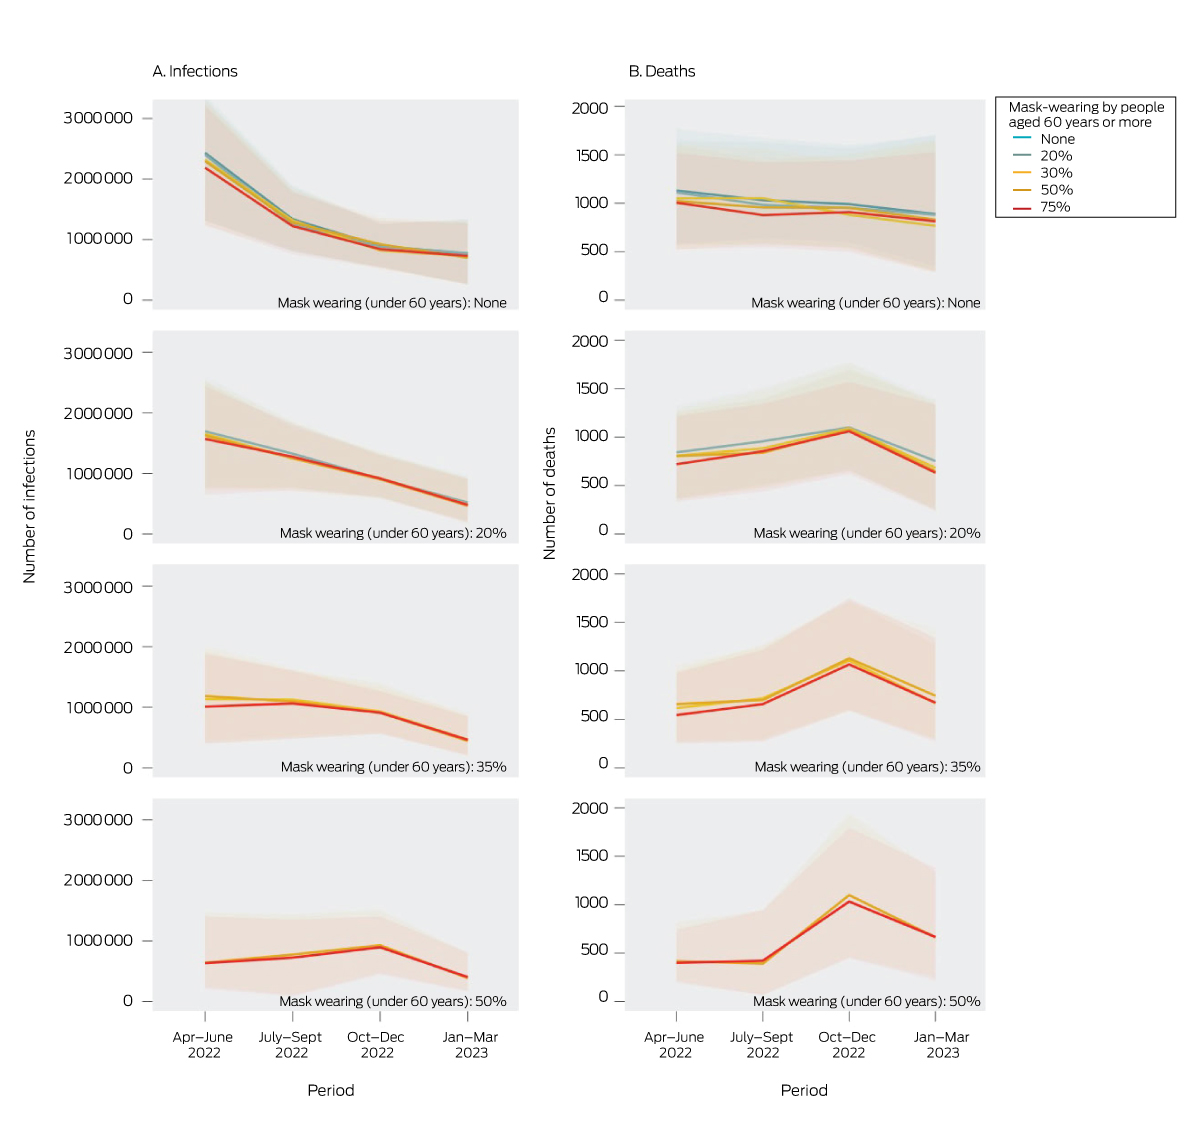
* The dominant variants in April 2022 were set as Omicron BA.1 and BA.2 (R0 = 8–10), followed by the gradual emergence of BA.4 and BA.5 from May 2022 (same R0, greater immune escape capacity; Supporting Information). Mask use proportions apply to people aged 20–59 years; level for children and adolescents aged 10–19 years set to two‐thirds of this value, and for 0–9‐year‐old children to two‐thirds of the proportion for 10–19‐year‐old children and adolescents. The lines depict median quarterly values, the shading 25th to 75th percentile values. We only modelled mask wearing rates for people aged 60 years or more that matched or exceeded the rate for people under 60.
Received 27 January 2023, accepted 4 May 2023
- 1. Andrejko KL, Pry JM, Myers JF, et al; California COVID‐19 Case‐Control Study Team. Effectiveness of face mask or respirator use in indoor public settings for prevention of SARS‐CoV‐2 infection: California, February–December 2021. MMWR Morb Mortal Wkly Rep 2022; 71: 212‐216.
- 2. Szanyi J, Wilson T, Howe S, et al. Epidemiologic and economic modelling of optimal COVID‐19 policy: public health and social measures, masks and vaccines in Victoria, Australia. Lancet Reg Health West Pac 2023; 32: 100675.
- 3. Australian Bureau of Statistics. Victoria: 2021 census All person QuickStats. 2022. https://www.abs.gov.au/census/find‐census‐data/quickstats/2021/2 (viewed Dec 2022).
- 4. Jefferson T, Dooley L, Ferroni E, et al. Physical interventions to interrupt or reduce the spread of respiratory viruses. Cochrane Database Syst Rev 2023; CD006207.
Open access:
Open access publishing facilitated by The University of Melbourne, as part of the Wiley – The University of Melbourne agreement via the Council of Australian University Librarians.
We acknowledge funding from an anonymous donation (administered by the Population Interventions Unit via University of Melbourne Advancement) to the earlier version of the on which this article is based. The funder had no involvement in the design, conduct or analysis of either study.
The Population Interventions Unit is currently completing a study of COVID‐19 vaccine effectiveness in Victoria, sponsored by Moderna. Moderna had no role in the preparation of this article.