


Material basics are essential for our health and wellbeing.1 They represent one of seven domains considered in this supplement on the Future Healthy Countdown 2030. The Nest framework, developed by the Australian Research Alliance for Children and Youth, defined this domain in 2021 through interviews with children and young people.2 According to their collective voices, material basics include stable and suitable housing, nutritious food, and clean water and air.2 They also include necessary school supplies and technology, the ability to take part in social activities, and access to transport and open spaces.2 Material basics are met when families have enough money for all these needs and items.1,2
Children who are raised in families experiencing material deprivation — such as poverty, homelessness or social exclusion — have increased risks of psychological or socio‐emotional difficulties, behavioural problems, educational difficulties, and poor mental health as they grow.3,4 Australia's children and young people shoulder specific inequities. The greatest gaps in outcomes and opportunities exist between Aboriginal and/or Torres Strait Islander families and non‐Indigenous families.5 They are also common for children in rural and remote settings compared with those in major cities.5 Not only a problem for the individual, these entrenched, lifelong disparities harm society by increasing health service costs and reducing economic productivity.6 Meeting basic material needs buffers children, young people and families from the negative consequences of early adversity and enhances the environments that support all children to thrive.7
The measurement of material basics is informed by three complementary and well established areas of science. The first is Maslow's hierarchy of needs, which recognises and outlines basic human needs from water and housing through to personal empowerment.8 The second area encompasses the non‐health factors that play a substantial role in our health and wellbeing, known as the social and cultural determinants of health.9 These determinants, and the way our health, educational and social systems are designed to entrench them, are more impactful than almost all our available health services and supports.10 The third area is the increasing knowledge that adverse childhood experiences drive adult and intergenerational outcomes.11 Adversity refers to experiences of hardship, ranging from poverty and unstable or unsuitable housing through to neglect and abuse. The greater the number and severity of negative early life experiences, the higher the risk of poorer lifelong health and wellbeing.11 Together, these areas of science point to a broad but mutable range of determinants which, if ameliorated, would fundamentally alter children's and young people's developmental trajectories.12 Beyond the individual, such changes would also produce a measurable, positive change in key economic metrics and create a healthier society.13,14
Due to the broad‐ranging nature of material basics, measurement can vary. The Nest definition of this domain intentionally includes all the relevant components, as this enables communities and governments to choose the areas that most align with their contexts and policy priorities. For the Future Healthy Countdown 2030 context, we considered the following criteria to guide our thinking:- items that are measurable and reportable now;
- items that are amenable to policy action within a short (one to five‐year) timeframe; and
- items that are likely to make the most impact when implemented from birth to early adulthood (ages 0–24 years).
We acknowledge the tension between outcome areas that require universal solutions (provided to the whole population) and those that require targeted solutions (provided to priority subpopulations) even if delivered from a universal base (proportionate universalism).
Notably, there are no annual, nationally representative measures of material basics in Australia. Australian censuses conducted by the Australian Bureau of Statistics most closely meet our criteria, with sufficient sample size and data on three domains collected every five years for all priority populations: childhood poverty (ages 0–24 years); housing stress, overcrowding and homelessness (ages 0–24 years); and young people not in education, employment or training (ages 15–24 years). At a minimum, these non‐health determinants must be met to enable a healthy and equitable society. Below, we describe Australian census data on these domains for all children, and by sex (noting that sex [not gender] was collected in the censuses), remoteness, and Aboriginal and/or Torres Strait Islander identity. Distribution of these data by relevant age groups is presented in Box 1, Box 2, Box 3, Box 4, Box 5 and the Supporting Information, and our key findings and conclusions are summarised in Box 6. We recognise that reporting proportions is limited, and that it would be more informative to also measure the amount of time young people experience adverse conditions.
Poverty
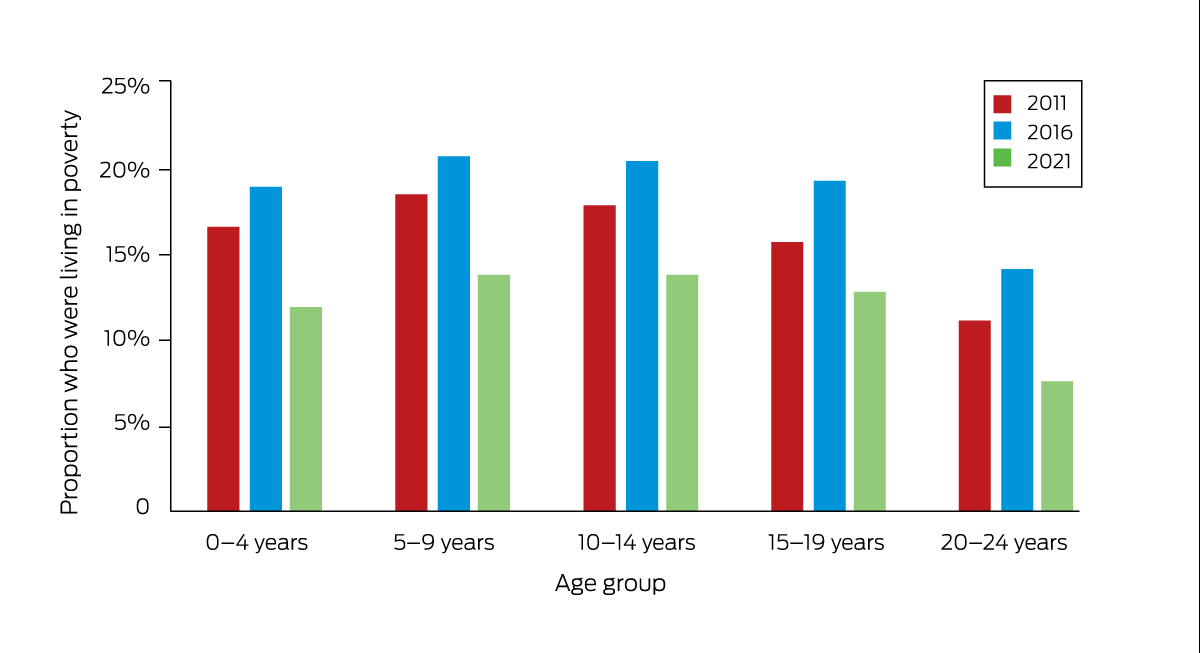
Increased household income benefits children directly through better food, stable housing, and health care (the “investment model”), and indirectly through improved parent mental health and capacity (the “family stress model”).7,15,16 In Australia, the poverty line has been traditionally defined by government as below 50% of median equivalised household income.17 The numbers and proportions of children and young people in poverty from the three most recent censuses are shown in Box 1 and the Supporting Information (table 1).
In 2021, when Australia's population was 25.5 million, 586 274 children aged 0–14 years (13.2%) and 293 672 young people aged 15–24 years (10.2%) were living in poverty. The proportion of Aboriginal and/or Torres Strait Islander children living in poverty (31.4%) was higher than that for non‐Indigenous children (12.1%). In 2021, poverty was highest in remote and very remote areas (22.8%, compared with 12.2% in with major cities) and in the least advantaged areas (30.6%, compared with 3.7% in the most advantaged areas), as defined by the Australian Bureau of Statistics Socio‐Economic Indexes for Areas.18 No difference was found between boys (13.3%) and girls (13.2%) aged 0–14 years.
In 2016, the overall childhood poverty proportion was 20.0% (829 132), suggesting that rates decreased in 2021. This may have been due to the temporary income supplements provided in response to the coronavirus disease 2019 (COVID‐19) pandemic (eg, JobKeeper and JobSeeker payments). By September 2020, the pandemic economic responses had reduced poverty and housing stress to beyond pre‐pandemic levels, but these rebounded a year later after the financial supports were withdrawn.19
Housing stress, overcrowding and homelessness
In this section, we describe three separate but related measures of housing, as each offers policy levers for intervention.
Housing stress
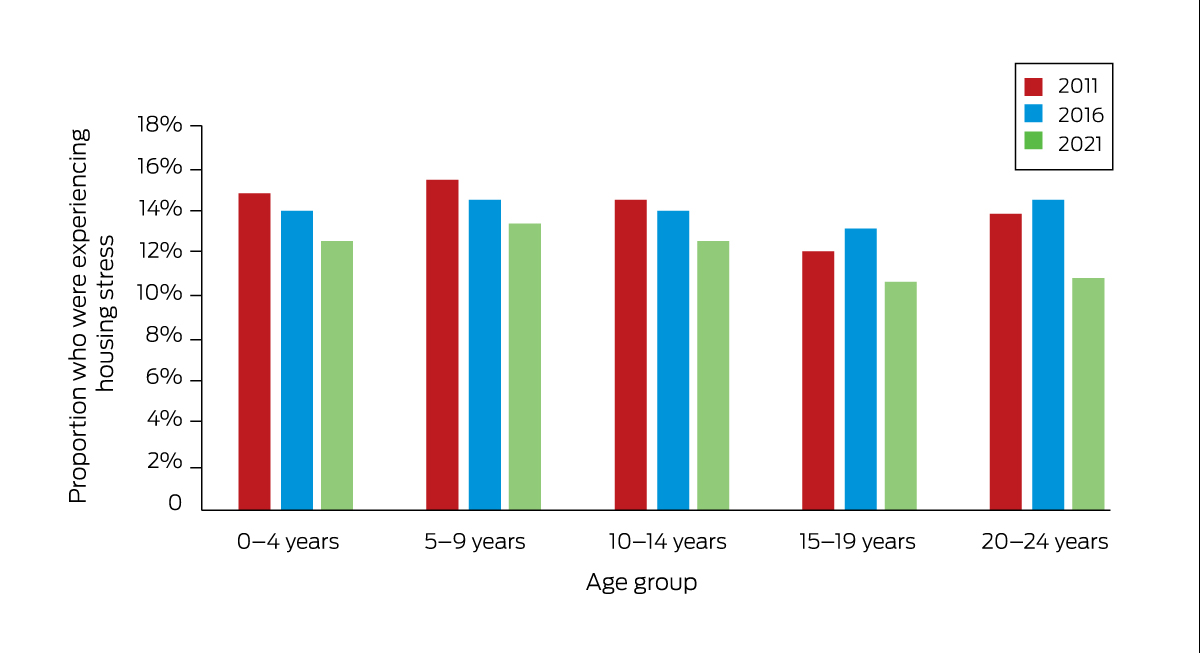
Housing stress is experienced when more than 30% of gross equivalised household income is spent on housing costs such as rent payments and mortgages.20 High housing costs cause increased financial stress, can reduce a household's ability to pay for other living expenses (such as food, transport, utilities and clothing), and can negatively affect health and wellbeing.21 As shown in Box 2 and the Supporting Information (table 2), an estimated 12.1% of 0–24‐year‐olds (803 962) lived in conditions of housing stress in 2021 — a decrease from 14.1% in 2016.
Of the total children and young people experiencing housing stress in 2021, 529 433 of all children aged 0–14 years (12.9%) experienced housing stress and 274 529 of young people aged 15–24 years (10.8%) experienced housing stress. Housing stress was greater for Aboriginal and/or Torres Strait Islander children (20.0%) than for non‐Indigenous children (12.2%). Housing stress was also higher for children in major cities (13.1%) than for those in remote and very remote areas (6.9%). In addition, it was higher for children living in the least advantaged areas (25.2%) compared with those living in the most advantaged areas (4.3%).
In Australia, housing stress has increased with cost‐of‐living pressures. Inflation over the 12 months to March 2023 was 7.3%, and the increase in inflation during the 12 months to November 2022 was the fastest since the 1990s.22 While increases in cost of living are being experienced across the population, they are more pronounced for subgroups such as low income earners, mortgage holders and renters.22
Overcrowding
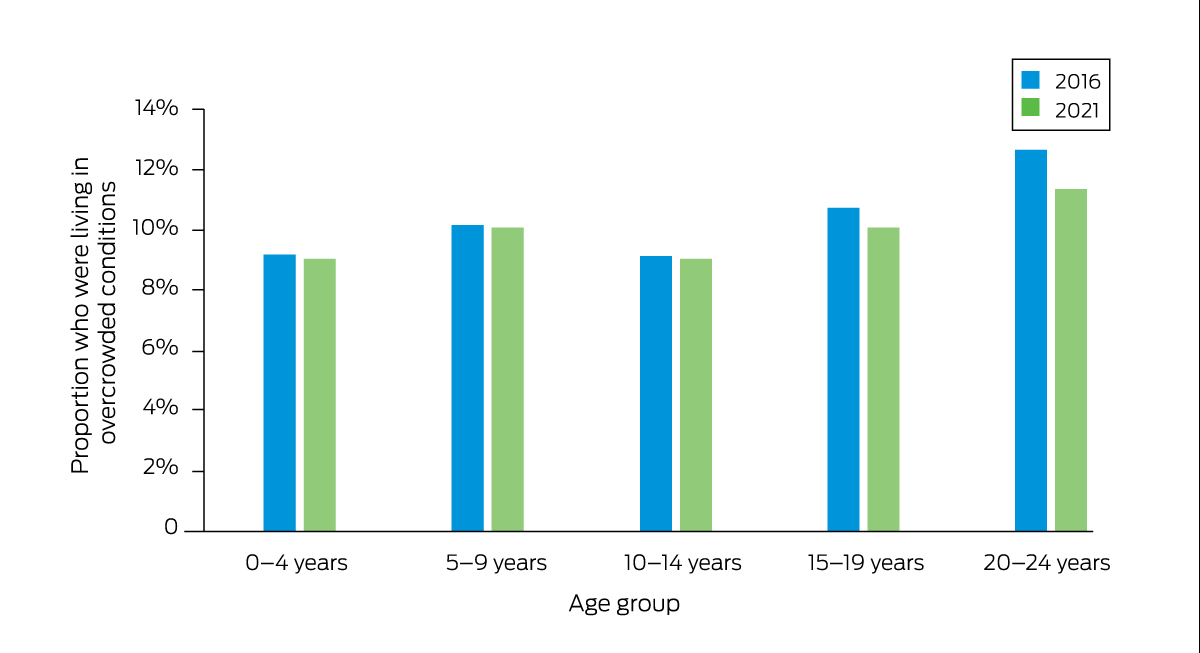
Households are considered overcrowded if they require one to three extra bedrooms according to the Canadian National Occupancy Standard.23 As shown in Box 3 and the Supporting Information (table 3), 724 327 children and young people (9.9%) were living in overcrowded households in 2021. Proportions were similar for different age groups and for boys versus girls. In the 2021 census, it was estimated that 47 515 Aboriginal and/or Torres Strait Islander children (17.9%) lived in overcrowded conditions. Overcrowding was more common in remote and very remote areas (17.2%) compared with major cities (9.5%), and more common in households with children living in the least advantaged areas (20.1%) compared with those in the most advantaged areas (3.5%).
Homelessness
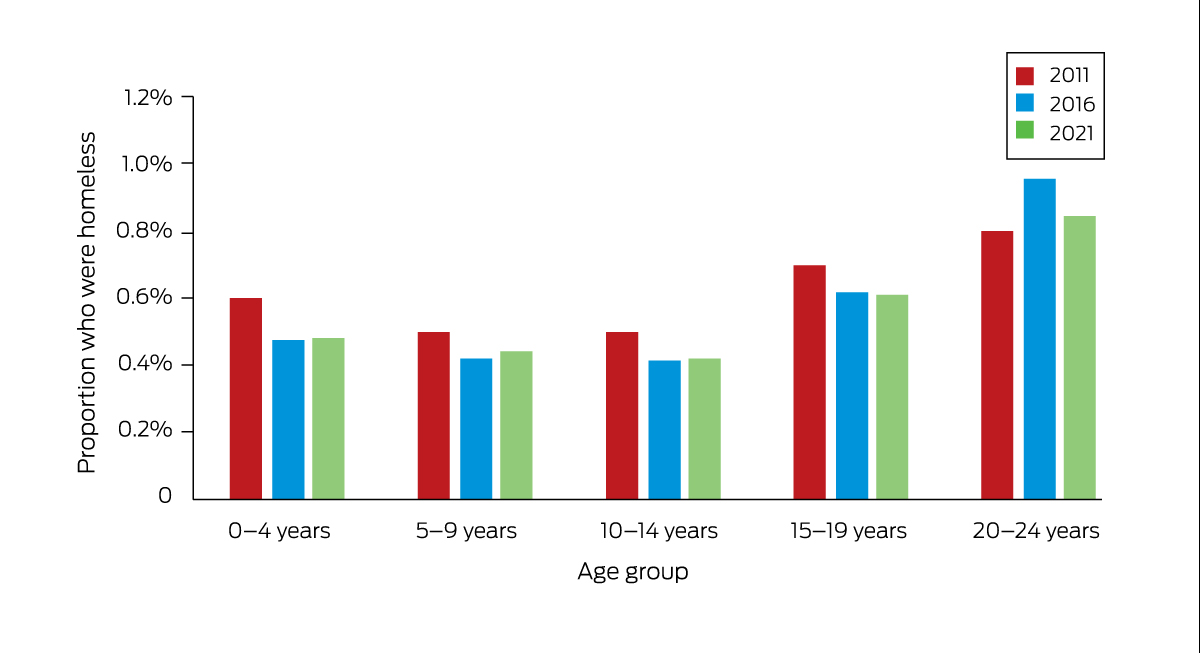
A person is considered to be experiencing homelessness if they are: living in an improvised dwelling, tent or sleeping out; living in supported accommodation for homeless people; staying temporarily with another household, including couch surfing; staying in a boarding house or other temporary lodging; or living in a severely overcrowded situation (requiring four or more extra bedrooms).23 As shown in Box 4 and the Supporting Information (table 4), 41 107 children and young people (0.6%) were homeless in 2021. Rates of homelessness for children did not differ by sex, but 12 411 Aboriginal and/or Torres Strait Islander children were homeless (3.0%). Of children aged 0–14 years living in remote and very remote areas, 4288 (4.7%) were homeless, and the homelessness rate for children aged 0–14 years who were living in the least advantaged areas (1.4%, 11 287 children) was higher than that for children living in the most advantaged areas (0.1%).
Young people not in education, employment or training
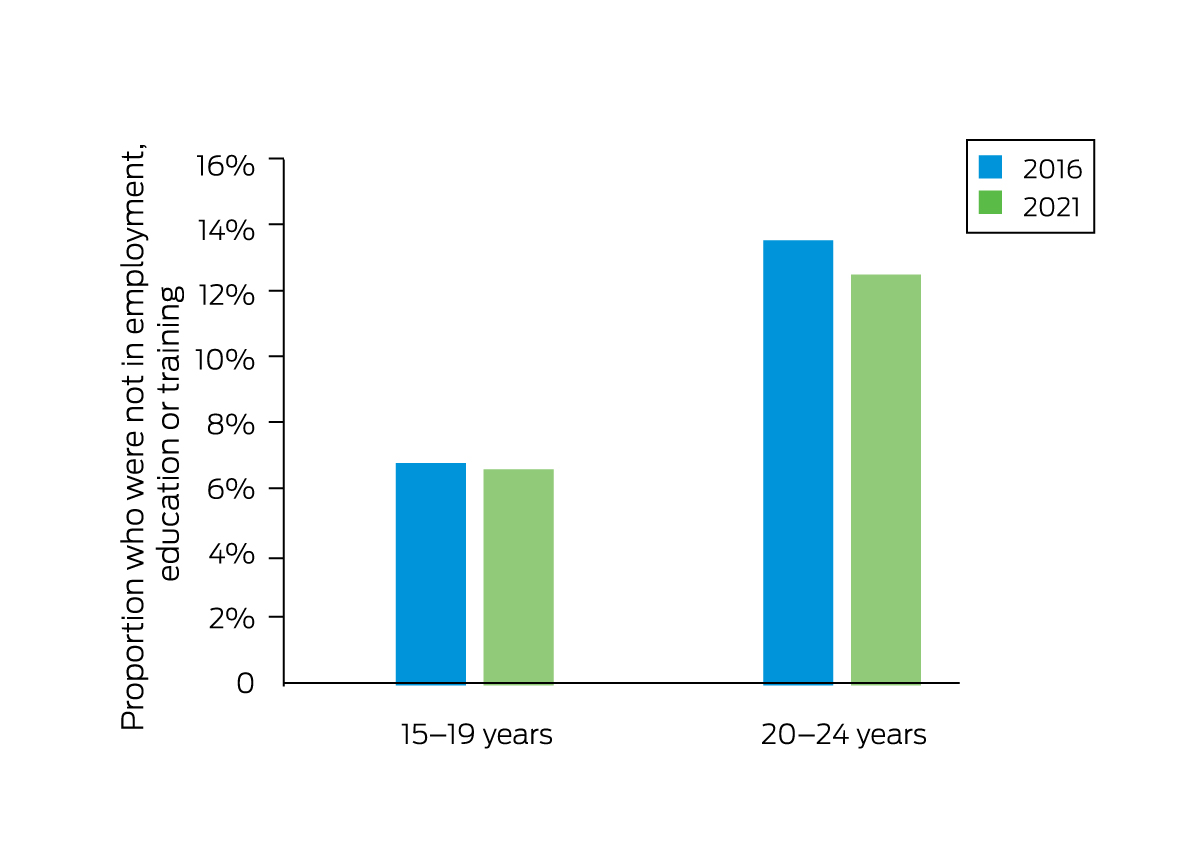
As young people transition into adulthood, a key driver of poverty and poorer life outcomes is not continuing with employment, education or training (EET). As shown in Box 5 and the Supporting Information (table 5), census data from 2021 indicated that 274 387 young people aged 15–24 years (9.6%) were not in EET, of whom 89 660 were aged 15–19 years (6.5% of this age group) and 184 726 were aged 20–24 years (12.5% of this age group). The lower proportion for those aged 15–19 years reflects the fact that most young people in this age group are still at school. Not being in EET was more common for male (10.3%) than female (8.9%) young people.
Overall, proportions declined from 10.2% in 2016 to 9.6% in 2021. Although proportions for male young people were similar in 2016 and 2021, there was a 2.1% percentage point decrease for female young people aged 20–24 years (from 14.1% in 2016 to 12.0% in 2021). In 2021, the proportions of male and female Aboriginal and/or Torres Strait Islander 15–24‐year‐olds who were not in EET were almost the same (28.6% and 27.8% respectively); the proportions of male and female non‐Indigenous 15–24‐year‐olds who were not in EET differed more markedly (9.3% and 7.9% respectively). In 2021, for young people aged 15–24 years, the largest proportion not in EET were living in remote and very remote areas (27.9%), and a much smaller proportion were living in major cities (8.6%). More young people not in EET were living in the least advantaged areas (18.4%) than in the most advantaged areas (4.5%).
What next?
Attending to the material needs of children and young people seems a basic commitment of any just society. It is an area where the perspectives of child rights, economics and societal wellbeing align. We have shown that the proportions of children and young people who are deprived of material basics are stable, and the numbers are large. Although it is challenging to deal with these issues quickly, it should be possible to “move the needle” both in terms of absolute numbers and severity within the next seven years. Indeed, COVID‐19 pandemic support payments showed this, and are increasingly relevant as the cost of living increases and access to material basics decreases.24 Societies that front‐end their investment, spending more on childhood, are healthier societies.14
For next year's supplement on the Future Healthy Countdown 2030, we will invite researchers to demonstrate how ameliorating these factors is doable and beneficial. Current government policy agendas such as the Wellbeing Budget and the Early Years Strategy all point to this reality.25,26,27 Overseas, governments are moving this way too. Scotland, New Zealand, Iceland and Estonia have all made great strides, and the European Union has committed to a child guarantee which includes housing and a universal child benefit.28 The COVID‐19 pandemic has shown us that almost nothing is impossible, including giving families more money. So, if not now, then when?
Box 1 – Proportion of 0–24‐year‐olds who were living in poverty (2011, 2016 and 2021 Australian census data)
Box 2 – Proportion of 0–24‐year‐olds who were experiencing housing stress (2011, 2016 and 2021 Australian census data)
Box 3 – Proportion of 0–24‐year‐olds who were living in overcrowded conditions (2016 and 2021 Australian census data)
Box 5 – Proportion of 15–24‐year‐olds who were not in employment, education or training (2016 and 2021 Australian census data)
Box 6 – Material basics for Australian children, young people and future generations
What are the most pressing issues where change could make a real difference by 2030 and why? |
|||||||||||||||
|
|||||||||||||||
What are some of the key indicator measures available and what is lacking? |
|||||||||||||||
|
|||||||||||||||
What are the key baseline data on these indicator measures that are available? |
|||||||||||||||
|
|||||||||||||||
Provenance: Commissioned; externally peer reviewed.
- 1. Sollis K. Measuring child deprivation and opportunity in Australia. Applying the Nest framework to develop a measure of deprivation and opportunity for children using the Longitudinal Study of Australian Children. Canberra: Australian Research Alliance for Children and Youth, 2019. https://www.aracy.org.au/publications‐resources/command/download_file/id/384/filename/ARACY_Measuring_child_deprivation_and_opportunity_in_Australia.pdf (viewed Oct 2023).
- 2. Goodhue R, Dakin P, Noble K. What's in the Nest? Exploring Australia's wellbeing framework for children and young people. Canberra: Australian Research Alliance for Children and Youth, 2021. https://www.aracy.org.au/documents/item/700 (viewed Oct 2023).
- 3. Saunders P, Bedford M, Brown JE, et al. Material deprivation and social exclusion among young Australians: a child‐focused approach (SPRC Report 24/18). Sydney: Social Policy Research Centre, UNSW Sydney; 2018. https://www.thesmithfamily.com.au/‐/media/files/research/reports/material‐deprivation‐and‐social‐exclusion‐among‐young‐australians‐2018‐full‐report.pdf (viewed Oct 2023).
- 4. Australian Institute of Health and Welfare. Australia's health 2018 (AIHW Cat. No. AUS 221; Australia's Health Series No. 16). Canberra: AIHW, 2018. https://www.aihw.gov.au/reports/australias‐health/australias‐health‐2018/contents/table‐of‐contents (viewed Oct 2023).
- 5. Australian Early Development Census [website]. https://www.aedc.gov.au (viewed Oct 2023).
- 6. Advancing early childhood development: from science to scale [series]. Lancet 2016. https://www.thelancet.com/series/ECD2016 (viewed Oct 2023).
- 7. Cooper K, Stewart K. Does household income affect children's outcomes? A systematic review of the evidence. Child Ind Res 2020; 14: 981‐1005.
- 8. Maslow A, Lewis KJ. Maslow's hierarchy of needs. Salenger Incorporated 1987; 14: 987‐990.
- 9. Australian Institute of Health and Welfare. Social determinants of health. https://www.aihw.gov.au/reports/australias‐health/social‐determinants‐of‐health (viewed Oct 2023).
- 10. Zimmerman FJ. Population health science: fulfilling the mission of public health. Milbank Q 2021; 99: 9‐23.
- 11. Hughes K, Bellis MA, Hardcastle KA, et al. The effect of multiple adverse childhood experiences on health: a systematic review and meta‐analysis. Lancet Public Health 2017; 2: e356‐e366.
- 12. Goldfeld S, O'Connor M, Chong S, et al. The impact of multidimensional disadvantage over childhood on developmental outcomes in Australia. Int J Epidemiol 2018; 47:1485‐1496.
- 13. Kershaw P, Warburton B, Anderson L, et al. The economic costs of early vulnerability in Canada. Can J Public Health 2010; 101 Suppl 3: S8‐12.
- 14. Richardson D, Harris D, Mackinder S, Hudson J. Too little, too late: an assessment of public spending on children by age in 84 countries (Innocenti research report). Florence: UNICEF Office of Research, 2023. https://www.unicef‐irc.org/publications/1747‐too‐little‐too‐late‐an‐assessment‐of‐public‐spending‐on‐children‐by‐age‐in‐84‐countries.html (viewed Oct 2023).
- 15. Brinkman S, Gregory T, Harris J, et al. Associations between the early development instrument at age 5, and reading and numeracy skills at ages 8, 10 and 12: a prospective linked data study. Child Ind Res 2013; 6: 695–708.
- 16. Moore TG, Arefadib N, Deery A, West S. The first thousand days: an evidence paper. Melbourne: Centre for Community Child Health, Murdoch Children's Research Institute, 2017. https://www.rch.org.au/uploadedFiles/Main/Content/ccchdev/CCCH‐The‐First‐Thousand‐Days‐An‐Evidence‐Paper‐September‐2017.pdf (viewed Oct 2023).
- 17. Organisation for Economic Co‐operation and Development. Growing unequal? Income distribution and poverty in OECD countries. Paris: OECD Publishing, 2008. https://www.oecd.org/els/soc/growingunequalincomedistributionandpovertyinoecdcountries.htm (viewed Oct 2023).
- 18. Australian Bureau of Statistics. Socio‐Economic Indexes for Areas (SEIFA) 2016. Canberra: ABS, 2016. https://www.abs.gov.au/ausstats/abs@.nsf/mf/2033.0.55.001 (viewed Oct 2023).
- 19. Davidson P, Bradbury B, Wong M. Poverty in Australia 2022: a snapshot. Sydney: Australian Council of Social Service and UNSW Sydney, 2022. https://povertyandinequality.acoss.org.au/a‐snapshot‐of‐poverty‐in‐australia‐2022 (viewed Oct 2023).
- 20. Australian Housing and Urban Research Institute. Understanding the 30:40 indicator of housing affordability stress. https://www.ahuri.edu.au/analysis/brief/understanding‐3040‐indicator‐housing‐affordability‐stress (viewed Oct 2023).
- 21. Rowley S, Ong R. Housing affordability, housing stress and household wellbeing in Australia (AHURI Final Report No. 192). Melbourne: Australian Housing and Urban Research Institute, 2012. https://melbourneinstitute.unimelb.edu.au/assets/documents/hilda‐bibliography/other‐publications/2012/Rowley_etal_Housing_affordability_housing_stress_and_household_wellbeing_in_Australia.pdf (viewed Oct 2023).
- 22. Hutchens G. Inflation's cost‐of‐living pinch hits mortgage borrowers, low‐income and older households. ABC News 2022; 12 Nov. https://www.abc.net.au/news/2022‐11‐12/low‐income‐facing‐highest‐cost‐of‐living‐inflation/101639080 (viewed Oct 2023).
- 23. Australian Bureau of Statistics. Housing statistics for Aboriginal and Torres Strait Islander peoples: collation of housing and household characteristics statistics from ABS collections [reference period 2021]. Canberra: ABS, 2022. https://www.abs.gov.au/statistics/people/aboriginal‐and‐torres‐strait‐islander‐peoples/housing‐statistics‐aboriginal‐and‐torres‐strait‐islander‐peoples/latest‐release#homelessness (viewed Oct 2023).
- 24. J P Morgan Research. Inflation and the cost of living: are consumers spending less? 2022; 14 Sept. https://www.jpmorgan.com/insights/research/inflation‐cost‐of‐living (viewed Oct 2023).
- 25. Australian Government. Statement 4: Measuring What Matters. In: Budget October 2022–23. Budget strategy and outlook (Budget Paper No. 1). https://archive.budget.gov.au/2022‐23‐october/bp1/download/bp1_2022‐23.pdf (viewed Oct 2023).
- 26. Australian Government. Part 2: Payment measures. In: Budget October 2022–23. Budget measures (Budget Paper No. 2). https://archive.budget.gov.au/2022‐23‐october/bp2/download/bp2_2022‐23.pdf (viewed Oct 2023).
- 27. Australian Government. Department of Health and Aged Care. National Action Plan for the Health of Children and Young People 2020–2030. https://www.health.gov.au/resources/publications/national‐action‐plan‐for‐the‐health‐of‐children‐and‐young‐people‐2020‐2030 (viewed Oct 2023).
- 28. European Commission. European Child Guarantee. https://ec.europa.eu/social/main.jsp?catId=1428&langId=en (viewed Oct 2023).
Open access:
Open access publishing facilitated by The University of Melbourne, as part of the Wiley – The University of Melbourne agreement via the Council of Australian University Librarians.
This article is part of the MJA supplement on the Future Healthy Countdown 2030, which was funded by the Victorian Health Promotion Foundation (VicHealth) — a pioneer in health promotion that was established by the Parliament of Victoria as part of the Tobacco Act 1987, and an organisation that is primarily focused on promoting good health and preventing chronic disease for all. VicHealth has played a convening role in scoping and commissioning the articles contained in the supplement. It has also covered the costs of publication. We thank Chathuranga Jayarathne, Daminda Solangaarachchi and Chun Oberst for their help with census data analysis.
No relevant disclosures.