


Continuous glucose monitoring (CGM) has transformed diabetes management, particularly in type 1 diabetes, and is used as an adjunct to diabetes management. Data from type 1 diabetes registries reported an increase in CGM use in paediatrics from 3% in 2011 to 22% in 2016 in the United States, with similar rates of uptake in other developed countries.1
Glycated haemoglobin (HbA1c) has long been the gold standard for assessing long term glycaemia in diabetes.2 However, HbA1c does not reflect glucose variability. Individuals with the same HbA1c level can have markedly different glucose trends,3 so self‐monitoring of blood glucose with finger‐prick glucose measurement is recommended to supplement HbA1c measurement. However, self‐monitoring provides isolated glucose readings with limited information on glucose patterns over time, and is painful and time‐consuming.4 In contrast, CGM provides real‐time continuous glucose information including glycaemic patterns, which is more meaningful for clinicians and people with diabetes.4 CGM data can be collated over time and presented in an ambulatory glucose profile (AGP) report.
Continuous glucose monitoring
CGM is a minimally invasive modality of monitoring glucose levels via a tiny subcutaneous sensor.5 Information, including current and previous glucose levels and trends, is sent via a transmitter to a detector, such as a phone or insulin pump.6,7 The detector can use these data in complex algorithms to predict glycaemia. There are two types of CGM: real‐time CGM and flash glucose monitoring. Real‐time CGM passively transmits glucose information without user engagement, whereas flash glucose monitoring requires the user to scan the sensor to access data.8 An exception is the alarm feature of the FreeStyle Libre 2 (Abbott) flash monitoring device, which alerts the user of impending dysglycaemia without the need for scanning.9
Studies have found that CGM use in type 1 and type 2 diabetes resulted in significant improvements in HbA1c levels, time in range (TIR), and reduced hypoglycaemia,10,11,12 including reduced rates of hospital presentations for hypoglycaemia.13 Studies have also demonstrated high user satisfaction, improved diabetes‐related quality of life, and reduced fear of hypoglycaemia.10,11,14
There are some limitations associated with CGM. Devices are costly. Previously, the Australian Government only offered reimbursement for people with type 1 diabetes who met specific concession criteria, with no subsidy for people with type 2 diabetes.15 As of July 2022, everyone with type 1 diabetes is now able to access subsidised CGM for a co‐payment of $32.50 per month, which equates to an annual cost of $390.16 Without subsidy, the annual cost of CGM ranges between $3000 and $6000,17 including the sensor ($75–$110, wear‐life 7–14 days) and transmitter ($400–$1000, wear‐life 3–12 months).7 CGM measures interstitial glucose levels and has a mean absolute relative difference of 10–20%, a physiological lag time of 5–10 minutes, and reduced accuracy at the extremes of glycaemia and during rapid glucose changes.5,8 Older CGMs require finger‐prick calibration multiple times daily to maintain correlation between interstitial and blood glucose levels (BGLs). Newer CGM and flash glucose monitoring devices are factory calibrated and therefore avoid the need to perform finger pricks.7 Furthermore, frequent alarms at times of dysglycaemia can cause alarm fatigue, leading to immediate alarm silencing and disengagement with CGM.6,14
Ambulatory glucose profile report
The AGP is a report summarising CGM data over multiple days of wear.18 The AGP can be produced from 5 days to 3 months of CGM data. Studies have shown that 14 days of data correlate strongly with 3 months of data for mean glucose levels, TIR, and hyperglycaemia.19,20 Multiple international consensus statements have agreed on using the AGP as the default report. The core CGM metrics include data completeness; glucose level statistics (eg, hypoglycaemia, hyperglycaemia); glucose profile based on a “summary day” (also named the AGP); glucose management indicator (GMI); and daily glucose profiles21,22,23 (Supporting Information, appendix 1).
Components of the AGP report
Data completeness
Data completeness describes the duration and proportion of time that the CGM was worn. Although 14 days of CGM data are sufficient, ≥ 70% wear (ideally ≥ 90% as per guidelines) is required for data to reliably indicate usual patterns.22,24 Flash glucose monitor users are required to scan their sensor at least every 8 hours, otherwise data will be lost, and the report will show data gaps.3
Glucose level statistics
Glucose level statistics include time in hypoglycaemia, time in hyperglycaemia, and TIR. The goal of diabetes management is to increase TIR while reducing hypoglycaemia.18,25 The definitions provided are standard international definitions of glycaemia. Glycaemic targets may vary for some groups, such as older people or those with comorbidities.
Time in hypoglycaemia
Hypoglycaemia is defined as BGL < 3.9 mmol/L. Hypoglycaemia is further classified into low (3.0–3.9 mmol/L), and very low (< 3.0 mmol/L).20,24 Guidelines recommend reducing time below 3.9 mmol/L to < 1 hour/day (< 4%), and time below 3.0 mmol/L to < 15 minutes/day (< 1%).18,21
Time in range
TIR is defined as BGL 3.9–10.0 mmol/L.24 The target for TIR is > 70%, equivalent to 10 days out of a 14‐day wear.18 TIR has an accurate predictive value for glycaemia, where 70% TIR predicts an HbA1c level of 7.0%.23 A 10% change above or below TIR predicts an increase or decrease in HbA1c of 0.5%, respectively.23 Increased TIR is associated with slowed progression of microvascular complications, particularly retinopathy and microalbuminuria.26
Time in hyperglycaemia
Hyperglycaemia, defined as BGL > 10.0 mmol/L, is divided into high (10.1–13.9 mmol/L), and very high (> 13.9 mmol/L) BGL.20,24 High BGL should be monitored closely, whereas very high BGL warrants consideration of an insulin bolus to correct hyperglycaemia.24 There is no target time in hyperglycaemia, although guidelines suggest minimisation of hyperglycaemia while focusing on increasing TIR and reducing hypoglycaemia.18
Ambulatory glucose profile
The AGP combines input from multiple days of CGM wear, displaying data as if all the readings had occurred in a single 24‐hour period,8,22 allowing the user to appreciate glucose patterns throughout the day and night. It depicts information including median glucose level, interquartile and interdecile glucose ranges, and the target glucose range, allowing clinicians to easily identify suboptimal glucose patterns (Box).
Glucose management indicator
The GMI (historically termed “estimated HbA1c”) represents average glycaemia derived from CGM data, and is becoming increasingly used as an endpoint in clinical trials.4,27 Estimated HbA1c based on 14 days of CGM data compares favourably to actual HbA1c, provided there have been no significant factors affecting glycaemia.19 In practice, illness, changes in diabetes management, diet and exercise, and red blood cell disorders are common and reduce the correlation of estimated to actual HbA1c.21 To avoid confusion, the term “estimated HbA1c” was changed to “glucose management indicator”.24
A significant difference between the GMI and HbA1c level can have management implications. A GMI lower than the HbA1c level indicates that the individual’s BGLs are lower than would be typically associated with the HbA1c level.21 Aggressive up‐titration of hypoglycaemic agents can lead to increased risk of hypoglycaemia.28 However, these individuals are more prone to glycation, with increased risk of diabetes‐related nephropathy, retinopathy and mortality despite the same glucose exposure.29 Conversely, individuals with a GMI greater than HbA1c level do not have the same risk of hypoglycaemia with therapy intensification, with reduced risk of diabetes‐related complications.28
Glucose variability
Glucose variability refers to the amplitude and frequency of variation from the average glucose level.30 Coefficient of variation is the most reliable marker of glucose variability.24,30 The suggested target coefficient of variation is < 36%, indicating low glucose variability and stable glycaemia,22,24 although a target of < 33% can provide additional protection against hypoglycaemia for people on insulin or sulfonylureas.31 Some AGPs report glucose variability as a standard deviation, which is reliable when glucose values are normally distributed, but this is rarely the case in diabetes.4,24 Unlike standard deviation, coefficient of variation can be compared across time irrespective of changes in mean glucose level, allowing clinicians to monitor true glucose variability over time.21
Glucose variability is not directly correlated with HbA1c or GMI,24 although it can supplement HbA1c or GMI to guide therapy. Increased glucose variability is associated with increased risk of hypoglycaemia.32,33 Therefore, in individuals with elevated HbA1c with increased glucose variability, a more conservative approach in intensifying therapy should be taken. In Supporting Information, appendix 2, the GMIs (labelled as “estimated HbA1c”) in both AGPs are 8.3%. However, the coefficient of variation in figure B (46.6%) is much higher than that of figure A (32.8%). The AGP in figure B reflects high glucose variability, with nocturnal hypoglycaemia at 2 am approximately 10% of the time. It is evident that increasing treatment based on HbA1c or GMI alone may result in increased hypoglycaemia in people with high glucose variability.21
Daily glucose profiles
Daily glucose profiles are daily tracings of glucose levels, and if entered by the CGM user, may include markers denoting the timing of meals and exercise. Review of daily glucose profiles allows more detailed interrogation of glycaemia, allowing correlation of dysglycaemia with specific causes.22,34
Interpreting the AGP report
Multiple consensus‐based approaches have been developed to facilitate interpretation of the AGP report.4,21 Our method of interpretation is based on the approach developed by a group of European experts35 and endorsed by the Australian Diabetes Society in a recent consensus statement:22
- Ensure adequate data completeness. At least 14 days of CGM data with > 70% wear is required to guide management.21,24
- Review the individual’s daily routine. People with diabetes should be advised to keep a log detailing the timing of medications, food and exercise, as well as any stressors or illness.36
- Identify any hypoglycaemic episodes. Review whether the 10% line of the AGP approaches or is in the hypoglycaemic range.22 The time in hypoglycaemia and daily glucose profiles can supplement this. Hypoglycaemic episodes should be correlated with food intake and exercise and discussed with the patient, followed by consideration of adjusting insulin timing and dosage.22,34 Other parameters including basal insulin dosing, insulin‐to‐carbohydrate ratio, insulin sensitivity factor, and active insulin time should be reviewed and adjusted as appropriate.
- Review the AGP. Review the AGP, examining median glucose levels before each meal and overnight. Evaluate regular times of dysglycaemia, and consider alterations to diabetes management accordingly.35
- Evaluate day‐to‐day variability. Examine the AGP for times of large variability, supplemented by the daily glucose profiles, with consideration given to whether an understandable cause for variability can be identified. Review the glucose variability, aiming for a coefficient of variation < 36% in general, although targets should be individualised where appropriate.22,24
- Review the TIR and GMI, and summarise the key messages. Compare TIR, GMI and other CGM metrics to the previous visit. Evaluate any effects of medication or lifestyle changes, and discuss this with the patient.35
Limitations
There are several challenges associated with the AGP. Clinicians and people with diabetes must have suitable technology and be trained to enable data sharing to view CGM data.21 Data need to be near complete to allow accurate interpretation.22,37 Day‐to‐day inconsistencies in the timing of meals, exercise, and insulin administration can make interpretation challenging.22 Glucose variability between days may be diluted in summary data, and the lowest glucose levels (ie, below the 10th centile) are not shown on the AGP.37 It has been proposed that displaying time in hypoglycaemia and hyperglycaemia, and TIR by time of day for individual days and pooled over multiple days may help evaluate the risks of dysglycaemia at specific times of day.38
Conclusion
CGM is rapidly becoming an integral adjunct in diabetes management. With increasing government recognition and federal funding, the AGP report will be increasingly utilised and clinicians will need to know how to interpret the AGP. The AGP report displays the key CGM metrics agreed on by multiple international consensus statements, as well as summary and daily glucose profiles. Components of the AGP including TIR and GMI will be increasingly used in trials. The AGP allows clinicians and people with diabetes to understand, assess and optimise diabetes management.
Box – Ambulatory glucose profile constructed from 14 days of continuous glucose monitoring data*
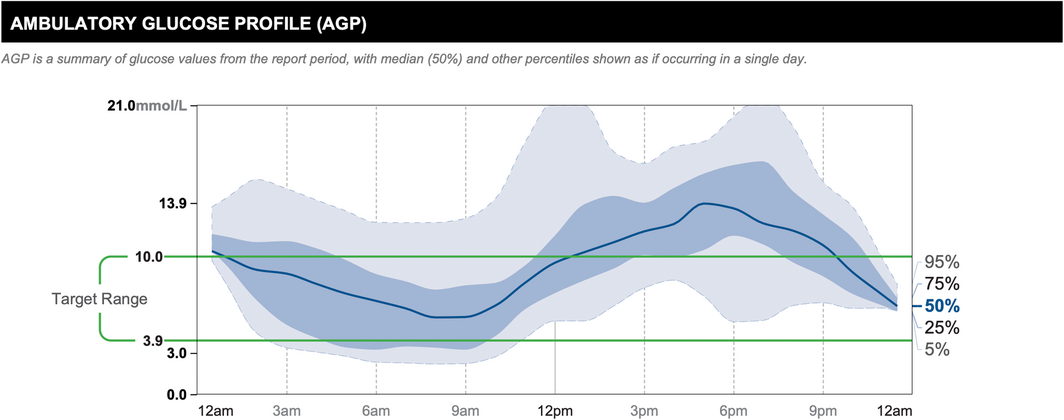
* Reproduced with permission of Abbott, © 2022. All rights reserved.
The solid dark blue line represents the median or 50% line, where half of all glucose readings were above, and half were below the line. The interquartile range is represented by the area shaded in dark blue, between the 25% and 75% lines. The interdecile range is represented by the area shaded in light blue, between the dashed light blue 5% and 95% lines. The target glucose range (3.9–10.0 mmol/L) is denoted between the green lines. The AGP allows clinicians to easily identify times of regular dysglycaemia. In this example, there is regular hyperglycaemia in the evening.
Provenance: Not commissioned; externally peer reviewed.
- 1. DeSalvo DJ, Miller KM, Hermann JM, et al. Continuous glucose monitoring and glycemic control among youth with type 1 diabetes: International comparison from the T1D Exchange and DPV Initiative. Pediatr Diabetes 2018; 19: 1271‐1275.
- 2. Royal Australian College of General Practitioners. General practice management of type 2 diabetes: 2016‐18. Melbourne: RACGP, 2016. https://www.racgp.org.au/FSDEDEV/media/documents/ClinicalResources/Guidelines/Diabetes/General‐practice‐management‐of‐type‐2‐diabetes_1.pdf (viewed June 2022).
- 3. Hirsch IB. Professional flash continuous glucose monitoring as a supplement to A1C in primary care. Postgrad Med 2017; 129: 781‐790.
- 4. Brown SA, Basu A, Kovatchev BP. Beyond HbA1c: using continuous glucose monitoring metrics to enhance interpretation of treatment effect and improve clinical decision‐making. Diabet Med 2019; 36: 679‐687.
- 5. Mian Z, Hermayer KL, Jenkins A. Continuous glucose monitoring: review of an innovation in diabetes management. Am J Med Sci 2019; 358: 332‐339.
- 6. Bruttomesso D, Laviola L, Avogaro A, et al. The use of real time continuous glucose monitoring or flash glucose monitoring in the management of diabetes: a consensus view of Italian diabetes experts using the Delphi method. Nutr Metab Cardiovasc Dis 2019; 29: 421‐431.
- 7. Lin R, Brown F, James S, Jones J, Ekinci E. Continuous glucose monitoring: a review of the evidence in type 1 and 2 diabetes mellitus. Diabet Med 2021; 38: e14528.
- 8. Ang E, Lee ZX, Moore S, Nana M. Flash glucose monitoring (FGM): A clinical review on glycaemic outcomes and impact on quality of life. J Diabetes Complications 2020; 34: 107559.
- 9. Abbott. Abbott’s FreeStyle Libre 2, with optional real‐time alarms, secures CE Mark for use in Europe [media release]. 1 Oct 2018. https://abbott.mediaroom.com/2018‐10‐01‐Abbott‐s‐FreeStyle‐R‐Libre‐2‐with‐Optional‐Real‐Time‐Alarms‐Secures‐CE‐Mark‐for‐Use‐in‐Europe (viewed May 2022).
- 10. Bolinder J, Antuna R, Geelhoed‐Duijvestijn P, et al. Novel glucose‐sensing technology and hypoglycaemia in type 1 diabetes: a multicentre, non‐masked, randomised controlled trial. Lancet 2016; 388: 2254‐2563.
- 11. Lind M, Polonsky W, Hirsch IB, et al. Continuous glucose monitoring vs conventional therapy for glycemic control in adults with type 1 diabetes treated with multiple daily insulin injections: the GOLD randomized clinical trial. JAMA 2017; 317: 379‐387.
- 12. Beck RW, Riddlesworth T, Ruedy K, et al. Effect of continuous glucose monitoring on glycemic control in adults with type 1 diabetes using insulin injections: the DIAMOND randomized clinical trial. JAMA 2017; 317: 371‐378.
- 13. Karter AJ, Parker MM, Moffet HH, et al. Association of real‐time continuous glucose monitoring with glycemic control and acute metabolic events among patients with insulin‐treated diabetes. JAMA 2021; 325: 2273‐2284.
- 14. Lawton J, Blackburn M, Allen J, et al. Patients’ and caregivers’ experiences of using continuous glucose monitoring to support diabetes self‐management: qualitative study. BMC Endocr Disord 2018; 18: 12.
- 15. Department of Health. 58,000 type 1 diabetics to have free access to new glucose monitoring device Australia. 3 Feb 2020. https://www.health.gov.au/ministers/the‐hon‐greg‐hunt‐mp/media/58000‐type‐1‐diabetics‐to‐have‐free‐access‐to‐new‐glucose‐monitoring‐device (viewed May 2022).
- 16. Diabetes Australia. Diabetes technology for all people living with type 1 diabetes [media release]. 3 July 2022. https://www.diabetesaustralia.com.au/mediarelease/diabetes‐technology‐for‐all‐people‐living‐with‐type‐1‐diabetes (viewed July 2022)
- 17. Pyrlis F, Brown F, Ekinci EI. Recent advances in management of type 1 diabetes. Aust J Gen Pract 2019; 48: 256‐261.
- 18. Battelino T, Danne T, Bergenstal RM, et al. Clinical targets for continuous glucose monitoring data interpretation: recommendations from the international consensus on time in range. Diabetes Care 2019; 42: 1593‐1603.
- 19. Riddlesworth TD, Beck RW, Gal RL, et al. Optimal sampling duration for continuous glucose monitoring to determine long‐term glycemic control. Diabetes Technol Ther 2018; 20: 314‐316.
- 20. Deeb A, Muammar T, Alsaffar H, et al. Use of ambulatory glucose monitoring and analysis of ambulatory glucose profile in clinical practice for diabetes management; a position statement of the Arab Society of Paediatric Endocrinology and diabetes. Diabetes Res Clin Pract 2021; 173: 108671.
- 21. Johnson ML, Martens TW, Criego AB, et al. Utilizing the ambulatory glucose profile to standardize and implement continuous glucose monitoring in clinical practice. Diabetes Technol Ther 2019; 21 (S2): S217‐S25.
- 22. Twigg S, Cohen N, Wischer N, Andrikopoulos S. Consensus position statement on: Utilising the ambulatory glucose profile (AGP) combined with the glucose pattern summary to support clinical decision making in diabetes care. Australian Diabetes Society, 2019. https://diabetessociety.com.au/downloads/20200626%20ADS%20AGP%20Consensus%20Statement%2024062020%20‐%20FINAL.pdf (viewed June 2022).
- 23. Bergenstal RM, Beck RW, Close KL, et al. Glucose management indicator (GMI): a new term for estimating A1C from continuous glucose monitoring. Diabetes Care 2018; 41: 2275‐2280.
- 24. American Diabetes Association. Role of continuous glucose monitoring in diabetes treatment. Arlington, VA: American Diabetes Association, 2018. https://professional.diabetes.org/sites/professional.diabetes.org/files/media/final_ada‐abbott_cgm_compendium_final.pdf (viewed May 2022).
- 25. American Diabetes Association. 7. Diabetes technology: standards of medical care in diabetes‐2020. Diabetes Care 2020; 43 (Suppl 1): S77‐S88.
- 26. Beck RW, Bergenstal RM, Riddlesworth TD, et al. Validation of time in range as an outcome measure for diabetes clinical trials. Diabetes Care 2019; 42: 400‐405.
- 27. Beck RW, Connor CG, Mullen DM, et al. The fallacy of average: How using HbA1c alone to assess glycemic control can be misleading. Diabetes Care 2017; 40: 994‐999.
- 28. Gomez‐Peralta F, Choudhary P, Cosson E, et al. Understanding the clinical implications of differences between glucose management indicator and glycated haemoglobin. Diabetes Obes Metab 2022; 24: 599‐608.
- 29. Liu H, Yang D, Deng H, et al. Impacts of glycemic variability on the relationship between glucose management indicator from iPro2 and laboratory hemoglobin A1c in adult patients with type 1 diabetes mellitus. Ther Adv Endocrinol Metab 2020; 11: 2042018820931664.
- 30. Kovatchev B, Cobelli C. Glucose variability: timing, risk analysis, and relationship to hypoglycemia in diabetes. Diabetes Care 2016; 39: 502‐510.
- 31. Monnier L, Colette C, Wojtusciszyn A, et al. Toward defining the threshold between low and high glucose variability in diabetes. Diabetes Care 2017; 40: 832‐838.
- 32. Rodbard D. Hypo‐ and hyperglycemia in relation to the mean, standard deviation, coefficient of variation, and nature of the glucose distribution. Diabetes Technol Ther 2012; 14: 868‐876.
- 33. Qu Y, Jacober SJ, Zhang Q, et al. Rate of hypoglycemia in insulin‐treated patients with type 2 diabetes can be predicted from glycemic variability data. Diabetes Technol Ther 2012; 14: 1008‐1012.
- 34. Aleppo G, Webb K. Continuous glucose monitoring integration in clinical practice: a stepped guide to data review and interpretation. J Diabetes Sci Technol 2019; 13: 664‐673.
- 35. Matthaei S, Dealaiz RA, Bosi E, et al. Consensus recommendations for the use of ambulatory glucose profile in clinical practice. Br J Diabetes Vasc Dis 2014; 14: 153‐157.
- 36. Hirsch IB, Verderese CA. Professional flash continuous glucose monitoring with ambulatory glucose profile reporting to supplement A1c: rationale and practical implementation. Endocr Pract 2017; 23: 1333‐1344.
- 37. Bergenstal RM, Ahmann AJ, Bailey T, et al. Recommendations for standardizing glucose reporting and analysis to optimize clinical decision making in diabetes: the ambulatory glucose profile (AGP). Diabetes Technol Ther 2013; 15: 198‐211.
- 38. Rodbard D. The ambulatory glucose profile: opportunities for enhancement. Diabetes Technol Ther 2021; 23: 332‐341.
Open access
Open access publishing facilitated by The University of Melbourne, as part of the Wiley – The University of Melbourne agreement via the Council of Australian University Librarians.
Elif Ekinci’s institution has received research funding from MTPConnect, the Medical Research Future Fund, the National Health and Medical Research Council, Eli Lilly, Sanofi, Boehringer Ingelheim, Bayer, Sanofi, CSL and Insulet for unrelated research; honoraria received from his presentations and participation in advisory boards (Bayer, Pfizer, Eli Lilly and Sanofi) are donated directly to his institution towards diabetes research.