


The known: Health, income, and education differences are associated with variations in the local incidence of SARS‐CoV‐2 infections in the United States, but their impact in Australia is less explored.
The new: The incidence of SARS‐CoV‐2 infections was higher in Victorian postcodes with larger proportions of people who were unemployed, without paid leave benefits, or experiencing mortgage or rent stress, and in areas with higher population and housing density or larger proportions of people who speak languages other than English at home.
The implications: The disparate local incidence of SARS‐CoV‐2 infections in Victoria during 2020 suggest that socio‐economic and other factors should be considered by public health policy for mitigating the impact of the pandemic.
A total of 56 565 infections with the severe acute respiratory syndrome coronavirus 2 (SARS‐CoV‐2) were recorded in Australia during 25 January 2020 – 3 September 2021.1 Strategies for reducing attack rates and slowing viral spread during influenza pandemics — isolating infected people, closing schools and workplaces, working from home, restricting domestic and international travel, compulsory wearing of masks, vaccination2 — have also been employed in Australia during the coronavirus disease 2019 (COVID‐19) pandemic.
Initial efforts to suppress the spread of SARS‐CoV‐2 in Victoria were successful. The relatively small first wave (25 January to late 9 April 2020) was dominated by infections acquired overseas (59.5% of cases).3 The second wave, which commenced in May 2020, was characterised by locally acquired infections (91% of cases); genomic sequencing indicated that the two transmission networks during this wave originated with infected people in hotel quarantine.3 To reduce community transmission, the Victorian government introduced compulsory mask‐wearing, curfews, travel restrictions, closure of non‐essential businesses, and limits on the permitted number of household visitors.
A United States study identified several factors that reduce the effectiveness of strategies for slowing SARS‐CoV‐2 transmission, including lack of access to paid leave benefits, higher housing density, housing insecurity, multi‐generation households, and inadequate access to healthy food and drinking water.4 The authors attributed these barriers, which disproportionately affected minority ethnic groups, to structural racism and social inequality, compounded by inequitable access to health care and education systems.4
The extent to which these factors influenced the incidence of SARS‐CoV‐2 infections in Victoria is relatively unexplored. We therefore examined associations in Victoria between socio‐economic factors and the local incidence (by postcode area) of SARS‐CoV‐2 infections.
Methods
We analysed Department of Health and Human Services (Victoria) (DHHS) data published on The Age newspaper website on 6 August 2020,5 updated with DHHS data on 13 August 2020. The aggregate data on the DHHS website (https://www.coronavirus.vic.gov.au/victorian‐coronavirus‐covid‐19‐data) include cases from outbreaks we did not include in our analysis. We aggregated data by postcode for confirmed SARS‐CoV‐2 infections during 1 March – 13 August 2020. We obtained socio‐economic data by postcode for 2014–19 from the Australian Bureau of Statistics (ABS) website: basic demographic, education, and ethnic background data, economic and employment‐related factors, housing‐related factors, and social disadvantage decile (Socio‐Economic Indexes for Areas [SEIFA] Index of Relative Social Disadvantage [IRSD]).6
We estimated the proportion of employees without paid leave benefits for a postcode by multiplying the number of people in each employment sector living in the postcode6 by the national proportion of employees in that sector without paid leave benefits.7 We defined working age as 15–64 years of age; an unemployed person is defined by the ABS as a person 15 years or older actively looking for or available for full‐ or part‐time work.8
Statistical analysis
We used Stata/IC 16 for data cleaning and descriptive analyses. Data were cleaned to retain data for all Victorian Statistical Areas 2 (SA2s) and then aligned with postcodes using the Australian Statistical Geography Standard (ASGS) coding 2019 locality to 2016 SA2 index9 (Supporting Information, file 1). Infections not associated with specific postcodes were not included in our analysis.
Incidence was calculated as the number of SARS‐CoV‐2 infections per 100 000 population by postcode area. Postcodes were grouped into case number percentiles, for all Victorian postcodes and for metropolitan and regional postcodes separately. We examined associations of incidence with socio‐economic factors in generalised linear regression models, with postcode area population as the exposure variable and assuming a zero‐inflated negative binomial distribution for incidence. This distribution was preferred because variance greatly exceeded the mean incidence value, and a zero‐inflated model was employed to fit the distribution while including a large number of postcodes with zero confirmed infections.
Two models were examined. Model 1 (unadjusted) included a single socio‐economic covariate across all postcodes; model 2 assessed differences between metropolitan and regional postcodes as an interaction term between the location indicator and the socio‐economic covariate. Model fit was assessed with the Akaike information criterion (AIC). The interaction term was retained for a model component if P < 0.05 or if model fit was better according to the AIC. As almost all postcodes with zero counts were in regional areas, the zero component largely reflected the relationship between a socio‐economic covariate and the zero count in regional areas.
Incidence rate ratios (IRRs) per unit change in a covariate are reported with 95% confidence intervals (CIs) for the count component, and as odds ratios (ORs) for the log‐odds of a zero count for the zero component.
The relationship between the incidence of SARS‐CoV‐2 infections in postcode areas with at least one reported infection and area‐level social disadvantage (IRSD) was examined in separate negative binomial regression models for regional and metropolitan postcodes.
Ethics approval
Our analysis was approved by the Barwon Health Research, Ethics, Governance and Integrity Unit as a negligible risk project (reference, 20/189).
Results
During 1 March – 13 August 2020, a total of 15 482 SARS‐CoV‐2 infections with associated postcodes were recorded in Victoria (Box 1); a further 275 cases were labelled as “other”, and 104 were in unknown postcodes (2.4% of all infections). The incidence ranged from 14.7 infections per 100 000 population for the 100 Victorian postcodes in the lowest 24 percentiles to 3723 per 100 000 for the four postcodes in the top percentile (postcodes 3021, 3029, 3030, 3064). Most postcodes without recorded infections were regional (311 of 320, 97%), and the overall incidence was higher for metropolitan than regional postcodes (418.3 v 62 infections per 100 000 population; IRR, 6.2; 95% CI, 4.6–8.2) (Box 1; Supporting Information, file 2, figure 1). The predicted mean numbers of infections per postcode were 51.9 (95% CI, 37.9–66.0) infections per metropolitan postcode and 5.1 (95% CI, 4.3–6.0) per regional postcode.
Demographic characteristics
The incidence of SARS‐CoV‐2 infections declined in metropolitan and regional Victoria with postcode median age (IRR, 0.89; 95% CI, 0.87–0.91); the likelihood of zero infections increased with median age in regional postcodes (IRR, 1.13; 95% CI, 1.08–1.20). The incidence of SARS‐CoV‐2 infections increased with population density in both regional (per 100 people/km2: IRR, 1.15; 95% CI, 1.09–1.21) and metropolitan areas (IRR, 9.19; 95% CI, 9.56–12.9). It also increased with the working age proportion in regional areas (per percentage point: IRR, 1.20; 95% CI, 1.16–1.25), but not in metropolitan areas (IRR, 1.01; 95% CI, 0.98–1.04) (Box 2).
In metropolitan areas, SARS‐CoV‐2 infection incidence increased with the proportion of the working age population who had not completed school year 10 (per percentage point: IRR, 1.10; 95% CI, 1.05–1.15) and declined with the proportion who had university qualifications (IRR, 0.96; 95% CI, 0.95–0.98). In regional areas, the incidence of SARS‐CoV‐2 infections declined with the proportion of the working age population who had not completed year 10 (IRR, 0.89; 95% CI, 0.85–0.94).
Ethnic background
The incidence of SARS‐CoV‐2 infections increased with the proportion of the postcode population who spoke a language other than English at home in both metropolitan (per percentage point: IRR, 1.01; 95% CI, 1.002–1.02) and regional areas (IRR, 1.08; 95% CI, 1.06–1.11). In regional postcodes, it increased with the proportion of people born overseas (per percentage point: IRR, 1.09; 95% CI, 1.07–1.13), but not in metropolitan areas. In regional postcodes, the likelihood of zero infections declined with the proportions of people born overseas or speaking a language other than English (Box 3).
In metropolitan postcodes, the incidence of SARS‐CoV‐2 infections increased with the proportion of the population who were Aboriginal or Torres Strait Islander people (per percentage point: IRR, 1.91; 95% CI, 1.10–2.73); in regional areas, the likelihood of zero infections increased with the proportion of Indigenous Australians (IRR, 1.62; 95% CI, 1.20–2.20) (Box 3).
Economic and employment‐related factors
The incidence of SARS‐CoV‐2 infections increased with household stress, as indicated by the proportions of people in households with mortgage repayments (metropolitan and regional) or rent levels (regional only) that exceeded 30% of household income; in regional postcodes the likelihood of zero infections declined as postcode household stress rose. Similarly, incidence increased with unemployment level in both regional (per percentage point: IRR, 1.50; 95% CI, 1.33–1.69) and metropolitan postcodes (IRR, 1.14; 95% CI, 1.05–1.23), and declined with the proportion of people with private health insurance (IRR, 0.95; 95% CI, 0.93–0.96) (Box 4).
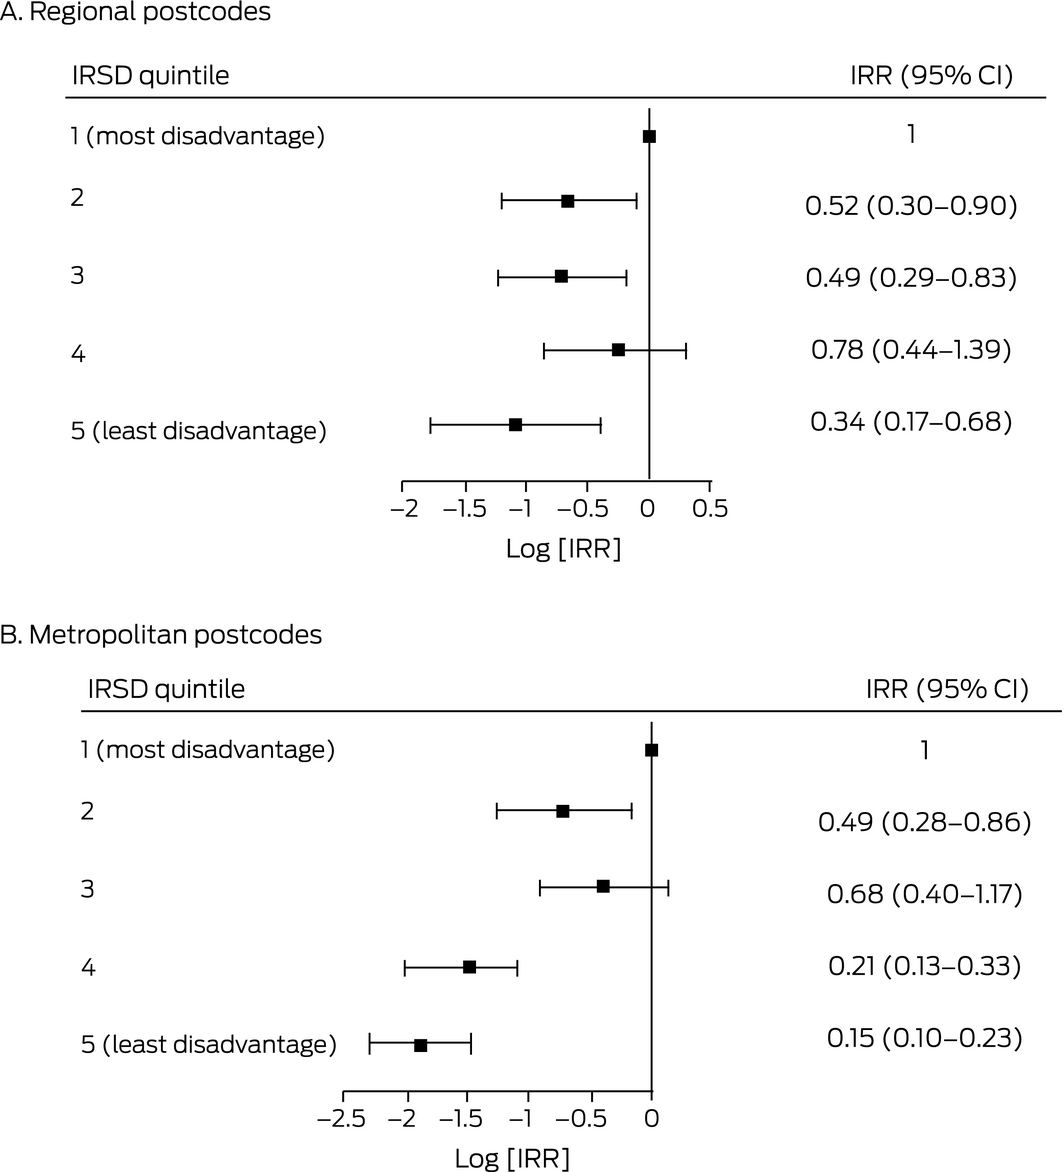
For postcodes with at least one confirmed SARS‐CoV‐2 infection, incidence was lower in areas in IRSD quintile 5 (regional postcodes) and quintiles 4 and 5 (metropolitan postcodes) than areas in quintile 1 (the most disadvantaged quintile) (Box 5).
For regional postcodes, the incidence of SARS‐CoV‐2 infections increased with median weekly household income (per $100: IRR, 1.33; 95% CI, 1.14–1.56); for metropolitan postcodes, it declined (IRR, 0.82; 95% CI, 0.76–0.88). Incidence increased with the proportion of working age people in metropolitan postcodes without paid leave benefits (per percentage point: IRR, 1.22; 95% CI, 1.02–1.45), but not in regional areas (Box 4).
Housing
The incidence of SARS‐CoV‐2 infections increased with mean household size in regional postcodes (per person: IRR, 7.30; 95% CI, 4.37–12.2), and the likelihood of zero infections declined (IRR, 0.07; 95% CI, 0.02–0.24). Incidence increased with housing density, the proportion of people residing in rented properties, and the homelessness rate in regional areas, but not in metropolitan areas (Box 6).
Discussion
The first COVID‐19 wave in Victoria was linked with returned overseas travellers, the second wave with inadequate quarantining of returned overseas travellers in hotel quarantine in Melbourne.3 Early outbreaks during the second wave were initially restricted to ten suburbs, subject to strict lockdown restrictions announced on 29 June 2020,11 and nine housing towers in North Melbourne and Flemington (about 3000 residents), subject to lockdown from 9 July 2020.12 These targeted containment measures were unsuccessful, and rapid transmission ensued across metropolitan Melbourne and, to a lesser extent, regional Victoria.
We found that the incidence of SARS‐CoV‐2 infections was higher in Victorian postcodes with lower median age, larger proportions of people who spoke a language other than English at home, larger proportions of people who rented their homes or for whom mortgage or rent payments exceeded 30% of household income, higher rates of homelessness, and a larger proportion of people employed without paid leave. These associations suggest that socio‐economic differences influence SARS‐CoV‐2 exposure.
The influence of age may be partially related to work‐related socio‐economic factors. Compared with younger people, older workers have greater job security, lower rates of casual employment, and greater access to paid leave, while retired people are less prone to workplace exposure.13 Job insecurity and lack of leave entitlements discourage employees from seeking health care and reporting illness.14 Access to paid sick leave can reduce transmission during a pandemic by enabling workers to isolate themselves. It is also associated with preventive health and health improvement behaviours, such as routine health checks, influenza vaccination, and fewer visits to hospital emergency departments.14
Homeless people and people living in higher density housing were also disproportionately affected in earlier pandemics. Infection rates were reported to be higher in lower socio‐economic groups in the United States during the 1918–19 influenza pandemic.15 Homelessness and housing density can be temporarily relieved by providing crisis accommodation for self‐isolation and quarantine. An early program provided free accommodation to emergency and health care workers in the Victorian outbreak if they were required to isolate themselves.16 However, the workplaces with the highest numbers of SARS‐CoV‐2 infections in Victoria were abattoirs and warehouses, workplaces deemed economically essential,17 and these workers could probably not readily isolate themselves from others in their households. Further, jobs in abattoirs and warehouses are often casual, low wage positions, factors associated with other social risks for poor health.18
Box 7 depicts our basic conceptual model of the complex interactions between socio‐economic factors that can influence the incidence of SARS‐CoV‐2 infections. Despite the limitations these interactions place on defining the influence of individual factors, the associations we found our consistent with differences in job security, access to paid sick leave, affordable housing, and health care that affect people from culturally and linguistically diverse communities and younger people, to a greater extent than other people. Disseminating timely and effective health advice to people in areas with larger proportions of migrants and people from non‐English speaking backgrounds, where the incidence of SARS‐CoV‐2 infections was higher, is a major challenge during a pandemic.
Limitations
We explored at the population level socio‐economic factors that may have influenced the incidence of SARS‐CoV‐2 infections in Victoria during 2020. The capacity of ecological study designs to explore these interactions is limited, and relationships at the area level may not reflect those at the individual level; for example, that incidence declined with postcode median age does not imply that younger people were more prone to infection. Variations in the incidence of SARS‐CoV‐2 infections across Melbourne and Victoria probably reflect the effects of a combination of physical, behavioural, environmental, and socio‐economic factors. More comprehensive research is required to evaluate the validity of the associations we have described, and how community partnerships and other models of public health practice can deal with their complexity. In future outbreaks, the high uptake of vaccination by adults may modify the patterns we observed in this study. Nevertheless, our findings provide insights for research and policy development aimed at reducing the impact of COVID‐19.
Conclusion
We report evidence that postcode‐level socio‐economic differences influenced the local incidence of SARS‐CoV‐2 infections in Victoria during 2020. The generalisability of our ecological analysis is limited, but our findings contribute to the pool of knowledge regarding the drivers of the COVID‐19 pandemic. Policies and health care reform that take social and economic inequalities into account could mitigate future waves of COVID‐19, help target vaccination programs to people at particular risk, better prepare Australia for future pandemics, and improve the health and wellbeing of all Australians, wherever they live.
Box 1 – Numbers and incidence of SARS‐CoV‐2 infections, Victoria, 1 March ‒ 13 August 2020, by incidence percentile and geographic location
|
Percentile range |
All Victorian postcodes |
Metropolitan postcodes |
Regional postcodes |
||||||||||||
|
Postcodes |
Infections |
Incidence (per 100 000 population) |
Postcodes |
Infections |
Incidence (per 100 000 population) |
Postcodes |
Infections |
Incidence (per 100 000 population) |
|||||||
|
|
|||||||||||||||
|
100 |
4 |
2784 |
3723 |
2 |
1715 |
3723 |
3 |
572 |
847 |
||||||
|
90‒99 |
36 |
6216 |
959.0 |
16 |
4498 |
989.3 |
20 |
1413 |
313 |
||||||
|
75‒89 |
62 |
3708 |
320.4 |
27 |
2727 |
322.0 |
36 |
540 |
127 |
||||||
|
50‒74 |
103 |
2139 |
133.0 |
47 |
2210 |
135.6 |
63 |
271 |
46 |
||||||
|
24‒49 |
95 |
496 |
48.8 |
46 |
1046 |
55.0 |
98 |
136 |
14 |
||||||
|
1‒24 |
100 |
139 |
14.7 |
42 |
354 |
42.8 |
— |
— |
— |
||||||
|
No confirmed infections |
320 |
0 |
0 |
9 |
0 |
0 |
311 |
0 |
0 |
||||||
|
Total |
720 |
15 482 |
199.8 |
189 |
12 550 |
418.3 |
531 |
2932 |
62 |
||||||
|
|
|||||||||||||||
|
|
|||||||||||||||
Box 2 – Relationship of postcode demographic and education level characteristics with incidence of SARS‐CoV‐2 infections, Victoria, 1 March ‒ 13 August 2020: incidence rate ratios (IRRs) with 95% confidence intervals (CIs)
|
|
|
Model 2 |
|||||||||||||
|
Characteristic |
Model 1 |
Regional and metropolitan* |
P (interaction†) |
Regional postcodes |
Metropolitan postcodes |
||||||||||
|
|
|||||||||||||||
|
Count component |
|
|
|
|
|
||||||||||
|
Postcode (metropolitan) |
6.17 |
— |
— |
— |
— |
||||||||||
|
Population density (per 100 persons/km2) |
1.03 |
— |
< 0.001 |
1.15 |
9.19 |
||||||||||
|
Median age (per year) |
0.83 |
0.89 |
0.24 |
— |
— |
||||||||||
|
Working age population proportion (per percentage point) |
1.16 |
— |
< 0.001 |
1.20 |
1.01 |
||||||||||
|
Proportion of working age people with highest education below year 10 (per percentage point) |
0.98 |
— |
< 0.001 |
0.89 |
1.10 |
||||||||||
|
Proportion of working age people with university qualifications (per percentage point) |
1.00 |
— |
0.003 |
1.00 |
0.96 |
||||||||||
|
Zero component |
|
|
|
|
|
||||||||||
|
Postcode (metropolitan) |
0.00 |
— |
— |
— |
— |
||||||||||
|
Population density (per 100 persons/km2) |
0.00 |
0.00 |
0.98 |
— |
— |
||||||||||
|
Median age (per year) |
1.25 |
1.13 |
0.07 |
— |
— |
||||||||||
|
Working age population proportion (per percentage point) |
0.75 |
0.89 |
1.0 |
— |
— |
||||||||||
|
Proportion of working age people with highest education below year 10 (per percentage point) |
1.44 |
1.29 |
1.0 |
— |
— |
||||||||||
|
Proportion of working age people with university qualifications (per percentage point) |
0.81 |
0.84 |
1.0 |
— |
— |
||||||||||
|
|
|||||||||||||||
|
* Adjusted for metropolitan/regional postcode without term for interaction between risk factor and metropolitan/regional postcode. † Between risk factor and metropolitan/regional postcode. If statistically non‐significant, separate IRRs for metropolitan and regional postcodes were not estimated. Model coefficients with standard errors and Akaike information criterion statistics are reported in the online Supporting Information, file 2, table 1. |
|||||||||||||||
Box 3 – Relationship of postcode ethnic background characteristics with incidence of SARS‐CoV‐2 infections, Victoria, 1 March ‒ 13 August 2020: incidence rate ratios (IRRs) with 95% confidence intervals (CIs)
|
|
|
Model 2 |
|||||||||||||
|
Characteristic |
Model 1 |
Regional and metropolitan* |
P (interaction†) |
Regional* |
Metropolitan |
||||||||||
|
|
|||||||||||||||
|
Count component |
|
|
|
|
|
||||||||||
|
Proportion born overseas (by percentage point) |
1.07 |
— |
< 0.001 |
1.09 |
1.01 |
||||||||||
|
Proportion speaking languages other than English at home (by percentage point) |
1.05 |
— |
< 0.001 |
1.08 |
1.01 |
||||||||||
|
Proportion of Aboriginal and Torres Strait Islander people (by percentage point) |
1.10 |
— |
< 0.001 |
0.87 |
1.91 |
||||||||||
|
Zero component |
|
|
|
|
|
||||||||||
|
Proportion born overseas (by percentage point) |
0.71 |
0.76 |
1.0 |
— |
— |
||||||||||
|
Proportion speaking languages other than English at home (by percentage point) |
0.65 |
0.74 |
0.08 |
— |
— |
||||||||||
|
Proportion of Aboriginal and Torres Strait Islander people (by percentage point) |
3.01 |
1.62 |
1.0 |
— |
— |
||||||||||
|
|
|||||||||||||||
|
* Unless interaction is statistically significant, adjusted for metropolitan/regional postcode without interaction term. † Between risk factor and metropolitan/regional postcode. If statistically non‐significant, separate IRRs for metropolitan and regional postcodes were not estimated. Model coefficients with standard errors and Akaike information criterion statistics are reported in the online Supporting Information, file 2, table 2. |
|||||||||||||||
Box 4 – Relationship of postcode economic and employment‐related characteristics with incidence of SARS‐CoV‐2 infections, Victoria, 1 March ‒ 13 August 2020: incidence rate ratios (IRRs) with 95% confidence intervals (CIs)
|
|
|
Model 2 |
|||||||||||||
|
Characteristic |
Model 1 |
Regional and metropolitan* |
P (interaction† ‡ ) |
Regional |
Metropolitan |
||||||||||
|
|
|||||||||||||||
|
Count component |
|
|
|
|
|
||||||||||
|
Proportion with mortgage repayments exceeding 30% of household income |
1.12 |
— |
0.007 |
1.22 |
1.08 |
||||||||||
|
Proportion with rent exceeding 30% of household income |
1.13 |
— |
0.001 |
1.15 |
1.01 |
||||||||||
|
Proportion unemployed |
1.38 |
— |
< 0.001 |
1.50 |
1.14 |
||||||||||
|
Proportion with private health insurance |
0.96 |
0.95 |
0.53 |
— |
— |
||||||||||
|
Median equivalised total household income‡ (weekly) (per $100) |
1.00 |
|
< 0.001 |
1.33 |
0.82 |
||||||||||
|
Proportion without paid leave benefits |
1.11 |
— |
0.06 |
1.00 |
1.22 |
||||||||||
|
Jobs per 100 persons |
0.95 |
0.96 |
0.30 |
— |
— |
||||||||||
|
Zero component |
|
|
|
|
|
||||||||||
|
Proportion with mortgage repayments exceeding 30% of household income |
0.48 |
0.69 |
1.0 |
— |
— |
||||||||||
|
Proportion with rent exceeding 30% of household income |
0.67 |
0.83 |
1.0 |
— |
— |
||||||||||
|
Proportion unemployed |
0.34 |
0.97 |
1.0 |
— |
— |
||||||||||
|
Proportion with private health insurance |
0.93 |
0.93 |
0.51 |
— |
— |
||||||||||
|
Median equivalised total household income‡ (weekly) (per $100) |
0.33 |
0.39 |
1.0 |
— |
— |
||||||||||
|
Proportion without paid leave benefits |
0.47 |
0.74 |
1.0 |
— |
— |
||||||||||
|
Jobs per 100 persons |
1.08 |
— |
0.003 |
1.04 |
0.89 |
||||||||||
|
|
|||||||||||||||
|
* Unless interaction is statistically significant, adjusted for metropolitan/regional postcode without interaction term, with the exception of “proportion without paid leave benefits”, for which retaining the interaction improved model fit (Akaike information criterion). † Between risk factor and metropolitan/regional postcode. If statistically non‐significant, separate IRRs for metropolitan and regional postcodes were not estimated. ‡ Household income adjusted to facilitate comparison of income levels between households of differing size and composition.10 Model coefficients with standard errors and Akaike information criterion statistics are reported in the online Supporting Information, file 2, table 3. |
|||||||||||||||
Box 5 – Social disadvantage quintile (Index of Relative Social Disadvantage [IRSD], postcode level) and incidence of SARS‐CoV‐2 infections, Victoria, 1 March ‒ 13 August 2020, for postcodes with at least one confirmed case: incidence rate ratios (IRRs) with 95% confidence intervals (CIs)
Box 6 – Relationship of postcode housing‐related characteristics with incidence of SARS‐CoV‐2 infections, Victoria, 1 March ‒ 13 August 2020: incidence rate ratios (IRRs) with 95% confidence intervals (CIs)
|
|
|
Model 2 |
|||||||||||||
|
Characteristic |
Model 1 |
Regional and metropolitan* |
P (interaction†) |
Regional |
Metropolitan |
||||||||||
|
|
|||||||||||||||
|
Count component |
|
|
|
|
|
||||||||||
|
Housing density (per person/km2) |
1.00 |
— |
< 0.001 |
1.16 |
0.999 |
||||||||||
|
Household size (per person) |
3.79 |
— |
< 0.001 |
7.30 |
1.74 |
||||||||||
|
Proportion renting their home |
1.05 |
— |
0.001 |
1.05 |
1.01 |
||||||||||
|
Homelessness rate (per homeless person per 10 000 persons) |
1.02 |
— |
0.030 |
1.02 |
1.005 |
||||||||||
|
Zero component |
|
|
|
|
|
||||||||||
|
Household size (per person) |
0.04 |
0.07 |
1.0 |
— |
— |
||||||||||
|
Housing density (per person/km2) |
0.00 |
0.00 |
0.84 |
— |
— |
||||||||||
|
Proportion renting their home |
0.94 |
0.98 |
1.0 |
— |
— |
||||||||||
|
Homelessness rate (per homeless person per 10 000 persons) |
0.93 |
0.99 |
1.0 |
— |
— |
||||||||||
|
|
|||||||||||||||
|
* Unless interaction is statistically significant, adjusted for metropolitan/regional postcode without interaction term. † Between risk factor and metropolitan/regional postcode. If statistically non‐significant, separate IRRs for metropolitan and regional postcodes were not estimated. Model coefficients with standard errors and Akaike information criterion statistics are reported in the online Supporting Information, file 2, table 4. |
|||||||||||||||
Box 7 – Basic conceptual model linking the measured population‐level socio‐economic factors discussed in this article with local incidence of SARS‐CoV‐2 infections
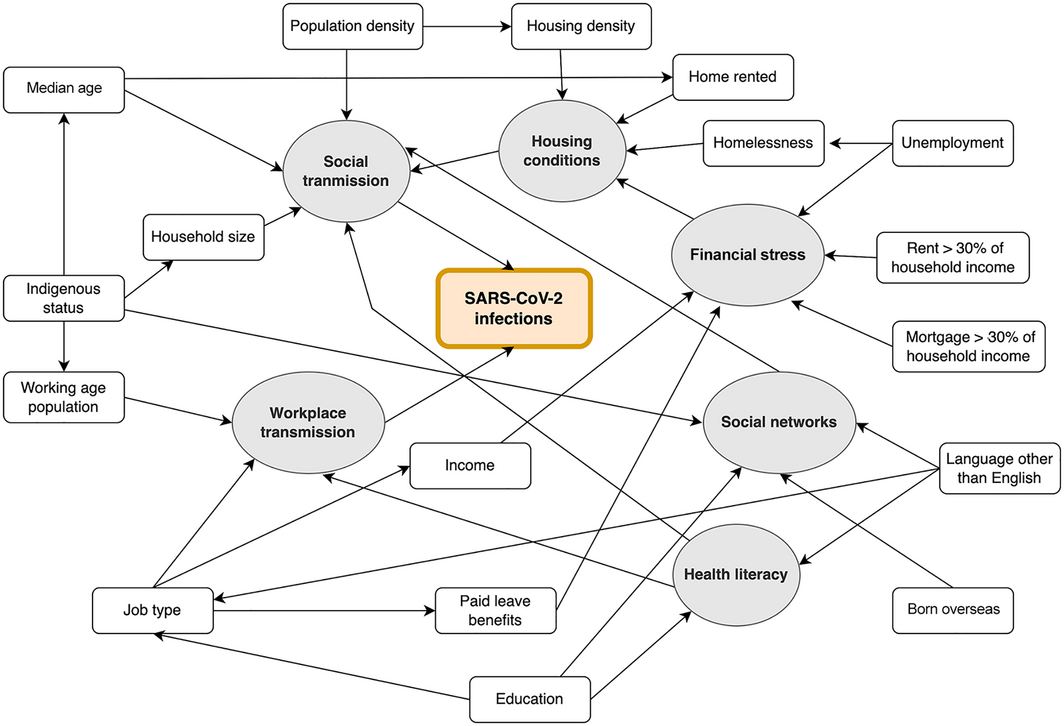
Grey circles indicate unmeasured mechanisms of transmission that link population factors (white) with the postcode incidence of SARS‐CoV‐2 infections. These factors interact with factors influencing workplace and social transmission because of differences in social networks, health literacy, and financial and housing conditions. Demographic characteristics also influence transmission; for example, the median age of the Indigenous population is lower than for other Australians. Postcodes with a larger proportion of working age people are likely to have larger median household sizes and to include younger children than areas with larger proportions of people of retirement age.
Received 28 May 2021, accepted 17 November 2021
- Christine Roder1,2
- Callum Maggs1
- Bridgette J McNamara1,3
- Daniel O'Brien1,4
- Amanda J Wade1,5
- Catherine Bennett6
- Julie A Pasco1,6
- Eugene Athan1,2
- 1 Barwon Health, Geelong, VIC
- 2 Institute for Mental and Physical Health and Clinical Translation (IMPACT), Deakin University, Geelong, VIC
- 3 Centre for Epidemiology and Biostatistics, the University of Melbourne, Melbourne, VIC
- 4 The Royal Melbourne Hospital, Melbourne, VIC
- 5 Centre for Population Health, Burnet Institute, Melbourne, VIC
- 6 Deakin University, Melbourne, VIC
No relevant disclosures.
- 1. Australian Department of Health. Coronavirus (COVID‐19) case numbers and statistics. https://www.health.gov.au/news/health‐alerts/novel‐coronavirus‐2019‐ncov‐health‐alert/coronavirus‐covid‐19‐case‐numbers‐and‐statistics#covid19‐summary‐statistics (viewed 21 Aug 2021).
- 2. Ferguson NM, Cummings DAT, Fraser C, et al. Strategies for mitigating an influenza pandemic. Nature 2006; 442: 448–452.
- 3. Victorian Department of Health COVID‐19 writing group. Population‐based analysis of the epidemiological features of COVID‐19 epidemics in Victoria, Australia, January 2020 – March 2021, and their suppression through comprehensive strategies. Lancet Reg Health West Pac 2021; 17: 100297.
- 4. Tai DBG, Shah A, Doubeni CA, et al. The disproportionate impact of COVID‐19 on racial and ethnic minorities in the United States. Clin Infect Dis 2020; 72: 703–706.
- 5. Butt C, Stehle M. Victoria Melbourne coronavirus postcode data: find out how active COVID‐19 case numbers have changed in your postcode or suburb over the past week. The Age (Melbourne), updated 6 Aug 2020. https://www.theage.com.au/national/victoria/victoria‐coronavirus‐data‐find‐out‐how‐active‐case‐numbers‐have‐changed‐in‐your‐postcode‐in‐the‐past‐week‐20200806‐p55j9n.html (viewed Aug 2020).
- 6. Australian Bureau of Statistics. 1410.0. Data by region, 2014–19. Updated 28 July 2020. https://www.abs.gov.au/AUSSTATS/abs@.nsf/DetailsPage/1410.02014‐19?OpenDocument (viewed Aug 2020).
- 7. Australian Bureau of Statistics. 6310.0. Employee earnings, benefits and trade union memberships, Australia, August 2013. 4 June 2014. https://www.abs.gov.au/AUSSTATS/abs@.nsf/DetailsPage/6310.0August%202013?OpenDocument (viewed Sept 2020).
- 8. Australian Bureau of Statistics. 6202.0 Labour force, Australia, Nov 2016. Updated 12 Apr 2017. https://www.abs.gov.au/ausstats/abs@.nsf/Lookup/6202.0main+features5Nov%202016 (viewed Feb 2022).
- 9. Australian Bureau of Statistics. ASGS coding indexes (2016). Updated 16 Jan 2020. https://data.gov.au/data/dataset/asgs‐coding‐indexes‐2016/resource/c6051960‐6012‐452c‐ac68‐dba55a1f837a (viewed Aug 2021).
- 10. Australian Bureau of Statistics. Equivalised total household income (weekly) (HIED). In: 2901.0. Census of Population and Housing: census dictionary, 2016. 23 Aug 2016. https://www.abs.gov.au/ausstats/abs@.nsf/Lookup/2901.0Chapter31502016 (viewed Feb 2022).
- 11. Department of Health and Human Services (Victoria). Coronavirus update for Victoria [media release]. 29 June 2020. https://www.dhhs.vic.gov.au/coronavirus‐update‐victoria‐29‐june‐2020 (viewed Feb 2022).
- 12. Department of Health and Human Services (Victoria). Stage 3 restrictions for Flemington and North Melbourne states [media release]. 9 July 2020. https://www.dhhs.vic.gov.au/updates/coronavirus‐covid‐19/stage‐3‐restrictions‐flemington‐and‐north‐melbourne‐estates (viewed Feb 2022).
- 13. Rothstein MA, Talbott MK. Encouraging compliance with quarantine: a proposal to provide job security and income replacement. Am J Public Health 2007; 97 (Suppl 1): 49–56.
- 14. Wilson FA, Wang Y, Stimpson JP. Universal paid leave increases influenza vaccinations among employees in the US. Vaccine 2014; 32: 2441–2445.
- 15. Sydenstricker E. The incidence of influenza among persons of different economic status during the epidemic of 1918. Public Health Rep 1931; 46: 154–170.
- 16. Premier of Victoria. Hotels for heroes expanded to more frontline workers [media release]. 30 April 2020. https://www.premier.vic.gov.au/hotels‐heroes‐expanded‐more‐frontline‐workers (viewed Nov 2020).
- 17. Preiss B, Eddie R, Butt C, McMillan A. New data reveals workplaces with most COVID‐19 infections as active cases drop. The Age (Melbourne), 12 Aug 2020. https://www.theage.com.au/national/victoria/new‐data‐reveals‐workplaces‐with‐most‐covid‐19‐infections‐as‐active‐cases‐drop‐20200812‐p55l0l.html (viewed Nov 2020).
- 18. Duckett S. Perils of place: identifying hotspots of health inequality (Grattan Institute Report no. 2016–10). July 2016. https://grattan.edu.au/report/perils‐of‐place‐identifying‐hotspots‐of‐health‐inequality (viewed Aug 2021).
Abstract
Objective: To examine associations between area‐level socio‐economic factors and the incidence of severe acute respiratory syndrome coronavirus 2 (SARS‐CoV‐2) infections in Victoria during 2020.
Design, setting: Population‐level ecological study of the incidence of SARS‐CoV‐2 infections in Victoria, by postcode, 1 March ‒ 13 August 2020.
Main outcome measures: Relationships between the incidence of SARS‐CoV‐2 infections by postcode (Department of Health and Human Services data published on The Age website), and demographic, education level, ethnic background, economic and employment‐related factors, housing‐related factors, and social disadvantage (Australian Bureau of Statistics data for 2014–19), expressed as incidence rate ratios (IRRs).
Results: During the study period, 15 482 SARS‐CoV‐2 infections with associated postcodes were recorded in Victoria. Incidence was higher for metropolitan than regional postcodes (418.3 v 62 infections per 100 000 population; IRR, 6.2; 95% CI, 4.6–8.2). In regional postcodes, incidence rose with mean household size (per person: IRR, 7.30; 95% CI, 4.37–12.2), unemployment proportion (per percentage point: IRR, 1.50; 95% CI, 1.33–1.69), and proportions for whom rent (IRR, 1.15; 95% CI, 1.07–1.22) or mortgage repayments (IRR, 1.22; 95% CI, 1.15–1.28) exceeded 30% of household income. In metropolitan areas, incidence increased with unemployment proportion (IRR, 1.14; 95% CI, 1.05–1.23) and proportion without paid leave (IRR, 1.22; 95% CI, 1.02–1.45). Incidence also increased with proportion speaking languages other than English at home (regional: IRR, 1.08; 95% CI, 1.06–1.11; metropolitan: IRR, 1.01; 95% CI, 1.002–1.02) and with Indigenous Australian proportion (metropolitan only: IRR, 1.91; 95% CI, 1.10–2.73).
Conclusions: Socio‐economic factors may have contributed to the non‐homogeneous incidence of SARS‐CoV‐2 infections across Victoria during 2020.