


The known: Workplace exposure to noise and ototoxic chemicals increases the risk of tinnitus. National information on tinnitus in Australian workers has not been published.
The new: We estimate that about one‐quarter of Australian workers experience tinnitus, including half a million for whom it is always present. Its prevalence is higher among men than women, and increases with age. Tinnitus is more frequent in people employed as automotive workers, drivers, farmers, and in other trades.
The implications: Workers in certain occupations are at particular risk of developing tinnitus, and targeted workplace interventions are needed to reduce its impact on their quality of life.
Tinnitus — the perception of sound in the absence of an external stimulus — is common, and can disturb sleep, cause anxiety and depression, and substantially impair quality of life.1 Tinnitus is an increasing burden for healthcare systems2 and reduces workforce productivity.3 As the pathophysiology of tinnitus is poorly understood and effective treatments are few,4 the key to reducing its impact is prevention.
Risk factors for tinnitus include otologic conditions (eg, otosclerosis, otitis media), other medical conditions (eg, hypertension, thyroid disease), and lifestyle factors (eg, smoking, anxiety).5 However, the major risk factors for tinnitus are increasing age, hearing loss, and excessive noise exposure.6 Noise exposure is a risk factor for tinnitus both with and without hearing loss,7 and its effect is independent of age.6 Other workplace factors, such as solvents and exposure to lead and carbon monoxide, can also contribute to otologic damage.8
Few studies have examined the prevalence of tinnitus in working people,7,9 and national information for Australian workers is not available. We therefore examined the prevalence of occasional, intermittent, and constant tinnitus in Australian workers. Understanding who is at greatest risk of developing tinnitus will aid development of targeted workplace interventions.
Methods
We analysed data from the Australian Workplace Exposure Survey (AWES) ‒ Hearing study, a national cross‐sectional telephone survey using mobile and landline numbers conducted during 7 June 2016 ‒ 20 March 2017 that assessed workplace exposures associated with otological damage in Australia. The design and methodology of the AWES–Hearing study have been described in detail elsewhere.10 Currently employed people aged 18–64 years were recruited by random digit dialling, and a sample of eligible participants representative by sex of the workforce population was achieved by stratified sampling.
Demographic and employment information
Demographic information collected for the survey included age group, highest education level, residential postcode, place of birth, job title, job description, size of employer business, and smoking status (“Are you a current smoker and smoke at least one cigarette a week?”). Occupations were classified by job title and job description according to the Australian and New Zealand Standard Classification of Occupations (ANZSCO)11 (Supporting Information, table 1). Residential areas were classified by postcode as major cities or as regional or remote,12 and countries of birth were categorised by region according to the International Telecommunication Union country classification13 (Supporting Information, table 2).
Tinnitus: characteristics and classification
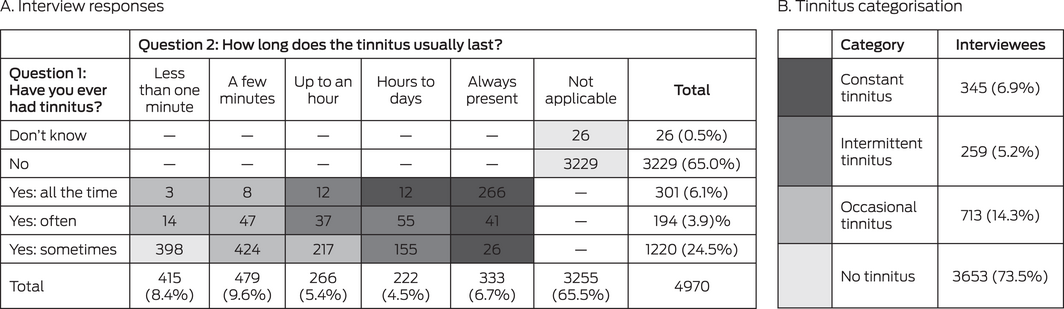
Participants were asked “Have you ever had tinnitus (ringing, buzzing or other sounds in your ears that only you can hear)?”; response options were “no”, “yes: sometimes”, “yes: often”, and “yes: all the time”. If the participant answered “yes”, they were asked “How long does this tinnitus (the noises) usually last?”; response options were “less than one minute”, “a few minutes”, “up to an hour”, “hours to days”, and “always present”. These questions are part of the hearing handicap questionnaire developed by the National Acoustic Laboratories in Sydney and used recently in a survey about recreational noise.14
There are no standard criteria for classifying the temporal characteristics of tinnitus. “Occasional”, “intermittent”, and “constant tinnitus” are terms frequently used in publications, but are neither well defined nor consistently used.15 We applied our own categories, based on answers to the two tinnitus survey questions. Participants who experienced tinnitus sometimes and only for a few minutes were presumed to have transient ear noise, a non‐pathologic phenomenon,15 and we included these participants in our “no tinnitus” category. Those who reported that tinnitus was “always present” were classified as having “constant tinnitus”, even had they also reported having tinnitus “sometimes” or “often”, which we attributed to habituation or varying awareness. “Any tinnitus” was defined as experiencing tinnitus occasionally, intermittently, or constantly.
Statistical analysis
Statistical analyses were conducted in Stata 14 or R (R Foundation for Statistical Computing). To estimate the prevalence of tinnitus in the Australian workforce, survey data were weighted using a raking technique16 that adjusted for differences between the characteristics of our sample and census data for the Australian workforce, accessed via the Australian Bureau of Statistics TableBuilder utility.17 We used 2016 census data for all variables except socio‐economic status (Index of Relative Socio‐economic Advantage and Disadvantage; IRSAD)18 and remoteness area,12 for which 2011 data were used, as 2016 data were not available. Raking was performed with the R anesrake function.19 We compared the sample and census population proportions for seven variables: age group, education level, remoteness, state of residence, birth place (Australia/New Zealand or elsewhere), socio‐economic status, and occupational group. When the sample and census proportions differed by more than five percentage points, we included the variable in the raking procedure; all seven variables met this criterion.
Using the raking weights, we estimated the prevalence (with 95% confidence intervals, CIs) of occasional, intermittent, constant, and any tinnitus in Australian working people by sex, age group, occupation, education level, remoteness, region of birth, smoking status, and employer business size. We estimated the numbers of workers with tinnitus among all Australians with ANZSCO codes recorded in the 2016 census that corresponded to two‐digit ANZSCO codes in our sample (ie, 9 708 644 people, 97% of the total working population).
The associations of constant or any tinnitus with demographic and occupational factors, both overall and stratified by sex, for participants who provided complete data (ie, no missing responses for any variables) were assessed using multiple logistic regression, and reported as odds ratios (ORs) with 95% CIs. For this analysis, we used unweighted sample data, as they had been collected randomly; ie, independently of tinnitus status.
Ethics approval
Our study was approved by the Curtin University Human Research Ethics Committee (HR58/2014).
Results
Of the 5815 contacted people who met the eligibility criteria, 4991 (86%) completed AWES–Hearing interviews; 4970 provided responses to the two tinnitus questions. A total of 713 people were classified as having occasional tinnitus (14.3%), 259 as having intermittent tinnitus (5.2%), and 345 as having constant tinnitus (6.9%); 3653 people were classified as having no tinnitus (73.5%) (Box 1; Supporting Information, table 3).
National prevalence of tinnitus
After rake weighting our survey responses, we estimated that 2.4 million people in the Australian workforce (24.8%; 95% CI, 23.2‒26.4%) experience tinnitus: 1.4 million occasional tinnitus (14.8%; 95% CI, 13.5–16.1%), 0.4 million intermittent tinnitus (4.6%; 95% CI, 3.9–5.4%), and 0.5 million constant tinnitus (5.5%; 95% CI, 4.6–6.3%). The estimated prevalence of occasional and intermittent tinnitus was similar for men and women, but the prevalence of constant tinnitus was greater for men (7.5%; 95% CI, 6.2–8.7%) than for women (3.3%; 95% CI, 2.3–4.3%) (Box 2).
The prevalence of occasional tinnitus was highest among people aged 18‒24 years (17.9%; 95% CI, 13.6–22.2%), but no consistent relationship with age group was evident; the prevalence of intermittent tinnitus was similar in all age groups. The prevalence of constant tinnitus increased steadily by age group, reaching 11.7% (95% CI, 9.3–14.2%) in people aged 55‒64 years (Box 2); this pattern applied to both men and women, but the gradient of increase was steeper for men (18‒24 years: 1.0% [95% CI, 0.0–2.6%]; 55‒64 years: 15.9% [95% CI, 12.5–19.3%]) than for women (18‒24 years: 0.5% [95% CI, 0.0–1.6%]; 55‒64 years: 6.7% [95% CI, 3.5–9.9%]) (Supporting Information, table 4).
Prevalence of tinnitus, by occupation
The sample prevalence of any tinnitus was highest for automotive workers (60 of 142 people, 42%; 95% CI, 34–51%), transport and other vehicle drivers (71 of 197, 36%; 95% CI, 30–43%), farmers (55 of 185, 30%; 95% CI, 24–37%), and other trades workers (79 of 216, 37%; 95% CI, 30–43%). The prevalence of constant tinnitus was also highest in these occupation groups (Box 3; Supporting Information, table 3).
After rake weighting our survey responses, we estimated that 47 707 automotive workers (16.7%; 95% CI, 9.5–23.8%), 58 900 drivers (13.0%; 95% CI, 7.3–18.6%), and 25 095 farmers (12.1%; 95% CI, 5.9–18.4%) in Australia have constant tinnitus (Supporting Information, table 4). Among men aged 55–64 years, we estimate that 17 190 automotive workers (44.0%), 20 362 drivers (17.9%), and 8543 farmers (29.5%) have constant tinnitus (full data not shown).
The adjusted prevalence of any tinnitus was higher among men than women in some occupations (eg, automotive workers: 44% [95% CI, 35–53%] v 11% [95% CI, 0–62%]; other trades: 41% [95% CI, 32–50%] v 10% [95% CI, 0–24%]; construction workers: 32% [95% CI, 24–40%] v 1.3% [95% CI, 0–11%]). For working women, the prevalence of any tinnitus was highest among drivers (40%; 95% CI, 0–81%) and machine operators (38%; 95% CI, 11–65%), with the caveat that the sample sizes for women in these occupations were small (Supporting Information, table 5).
Other risk factors for tinnitus
Complete data were available for 4847 of the 4970 participants (97.5%; 2237 men, 2610 women). After adjusting for all other variables, men were more likely than women to report any tinnitus (OR, 1.42; 95% CI, 1.22–1.66) or constant tinnitus (OR, 1.57; 95% CI, 1.18–2.08). The likelihood of constant tinnitus increased with age for both men (55–64 v 18–24 years: OR, 43.1; 95% CI, 5.9–314) and women (OR, 6.8; 95% CI, 1.6–29.3), but the broad confidence intervals indicate the low precision of these estimates (Supporting Information, table 6).
The likelihood of any tinnitus was higher for men in regional communities than those in major cities (OR, 1.33; 95% CI, 1.10–1.62), but not for women (OR, 1.08; 95% CI, 0.86–1.35). The likelihood of constant tinnitus was higher for men with trade or apprentice qualifications than for men with high school as highest education (OR, 1.53; 95% CI, 1.00–2.34). Men born in Asia were less likely to have any tinnitus (OR, 0.25; 95% CI, 0.17–0.39) or constant tinnitus (OR, 0.26; 95% CI, 0.10–0.64) than working men born in Australia or New Zealand; the odds of any (but not constant) tinnitus were also lower for men born in Africa (OR, 0.31; 95% CI, 0.12–0.75). The odds of any tinnitus, but not of constant tinnitus, were higher for women who smoked (OR, 1.47; 95% CI, 1.07–2.02) (Supporting Information, table 6).
Compared with office workers, the likelihood of any or constant tinnitus in the adjusted analysis was higher for workers in the automotive occupations (any: OR, 1.79 [95% CI, 1.17–2.74]; constant: OR, 3.65 [95% CI, 1.91–6.99]), drivers (any: OR, 1.64 [95% CI, 1.14–2.36]; constant: OR, 2.74 [95% CI, 1.52–4.92]), farmers (constant only: OR, 2.46 [95% CI, 1.32–4.56)]), and other trades (any: OR, 1.54 [95% CI, 1.08–2.21]; constant: OR, 2.35 [95% CI, 1.28‒4.32]) (Supporting Information, table 6).
Discussion
On the basis of our survey, we estimate that one‐quarter of the Australian workforce experience tinnitus. Differences between studies in tinnitus classification and sampling methods make comparisons of its reported prevalence difficult. Our findings are similar to those of the 2008 Swedish Longitudinal Occupational Survey of Health.9 The overall estimated prevalence among Swedish workers was 26% (our study: 24.8%); among men it was 31% (our study: 28.6%), among women 22% (our study: 20.7%). The prevalence of constant tinnitus was 7% in the Swedish survey (our study: 5.5%), and in both countries tinnitus was twice as prevalent among men as among women (Sweden: 10% v 5%; our study: 7.5% v 3.3%). Our estimates are also similar to the reported prevalence of tinnitus among all adults in the United States (25.3%7) and Poland (20.1%20).
We estimate that more than 500 000 Australian workers experience constant tinnitus, and that the prevalence is highest among men aged 55‒64 years (15.9%). As most workers exposed to workplace noise and ototoxic chemicals in Australia are men,10 this finding was unsurprising, but after adjusting for worker characteristics (including occupational group) and demographic factors, the odds of having constant tinnitus were still 57% higher for men than women. This difference may be partially explained by risk factors we did not examine, such as leisure time and firearm noise.7
The prevalence of tinnitus was highest in occupations most exposed to hazardous noise levels (farming, construction work, automotive industries, machine operators10). One exception was the drivers group, for which the likelihood of any tinnitus was second only to that automotive industry workers, despite a much lower risk of hazardous workplace noise exposure.10 Drivers are, however, exposed to ototoxic chemicals, including carbon monoxide (84.1% with medium to high exposure levels10). The association of tinnitus with workplace noise is recognised,6,7 but associations with workplace ototoxic chemicals still require detailed examination.
We found that the likelihood of tinnitus was lower for male workers born in Asia. This finding is consistent with a report that the prevalence of tinnitus among American Asians is significantly lower than for other American ethnic groups, although the difference was reduced by adjusting for comorbid conditions, noise exposure, and depression.21
We found that smoking was a significant risk factor for tinnitus only in women. Smoking has previously been associated with tinnitus, but most studies have not estimated the risk by sex.22
Limitations
Sample bias is a limitation for all population studies, but the AWES–Hearing study used random digit dialling of telephone numbers, stratified by sex, to achieve a representative sample of the Australian workforce. Further, our raking technique corrected for differences between our sample and the Australian working population.
We excluded 16 people who could not hear well enough to complete the telephone survey (0.01% of those deemed ineligible), which also excluded people who ceased working because of hearing loss or tinnitus. We may therefore have underestimated the prevalence of tinnitus. Our study was conducted during 2016‒17; workplace and lifestyle changes caused by the coronavirus disease 2019 (COVID‐19) pandemic — eg, reduced or increased stress, differences in environmental exposures — may have since affected the prevalence patterns of tinnitus.23
Tinnitus questionnaires cannot be validated, as there is no recognised standard for measuring tinnitus. Further, we assessed this complex symptom with two self‐assessment questions. There is no definitive criterion for assessing tinnitus; participants in some cross‐sectional studies have been asked whether they have “bothersome tinnitus”, but it is often unclear what this term encompasses.24 We characterised tinnitus by its persistence because this reflects its presence rather than the participant’s emotional response to the symptom. Our findings were similar to those of comparable studies, suggesting that our questions and methodology were appropriate.
As AWES‒Hearing was a cross‐sectional study, conclusions about causal relationships between reported workplace factors and tinnitus cannot be drawn. Tinnitus is a complex symptom with a variety of otologic, neurologic, infectious, leisure noise, drug‐related, and lifestyle risk factors, but in our study we examined only personal and work‐related characteristics. Finally, we did not consider the significance of past occupations for current tinnitus.
Conclusion
Tinnitus is highly prevalent among working people in Australia, particularly those in certain occupational groups, which may indicate that much of the burden of tinnitus is preventable. A clinically validated instrument for categorising tinnitus is required, and modifiable risk factors should be explored.
Box 1 – Tinnitus status of 4970 interviewees, according to their responses to the two tinnitus‐related questions in the Australian Workplace Exposure Survey (AWES) ‒ Hearing survey
Box 2 – Estimated prevalence of occasional, intermittent, and constant tinnitus in the Australian workforce, by sex and age group
|
|
Occasional tinnitus |
Intermittent tinnitus |
Constant tinnitus |
Any tinnitus |
|||||||||||
|
|
Number |
Proportion |
Number |
Proportion |
Number |
Proportion |
Number |
Proportion |
|||||||
|
|
|||||||||||||||
|
Total |
1 432 552 |
14.8% |
445 979 |
4.6% |
529 343 |
5.5% |
2 407 874 |
24.8% |
|||||||
|
Sex |
|
|
|
|
|
|
|
|
|||||||
|
Men |
797 685 |
15.8% |
266 577 |
5.3% |
376 015 |
7.5% |
144 0277 |
28.6% |
|||||||
|
Women |
634 867 |
13.6% |
179 402 |
3.8% |
153 328 |
3.3% |
967 597 |
20.7% |
|||||||
|
Age group (years) |
|
|
|
|
|
|
|
|
|||||||
|
18–24 |
228 748 |
17.9% |
54 414 |
4.3% |
9838 |
0.8% |
293 000 |
23.0% |
|||||||
|
25–34 |
316 512 |
13.4% |
118 476 |
5.0% |
49 540 |
2.2% |
484 528 |
20.6% |
|||||||
|
35–44 |
362 490 |
16.0% |
107 007 |
4.7% |
115 710 |
5.1% |
585 207 |
25.9% |
|||||||
|
45–54 |
338 106 |
15.2% |
80 958 |
3.7% |
174 166 |
7.9% |
593 230 |
26.8% |
|||||||
|
55–64 |
186 697 |
12.0% |
85 124 |
5.5% |
180 090 |
11.7% |
451 911 |
29.2% |
|||||||
|
|
|||||||||||||||
|
CI = confidence interval. |
|||||||||||||||
Box 3 – Adjusted prevalence of any and constant tinnitus (with 95% confidence intervals), by occupation group*
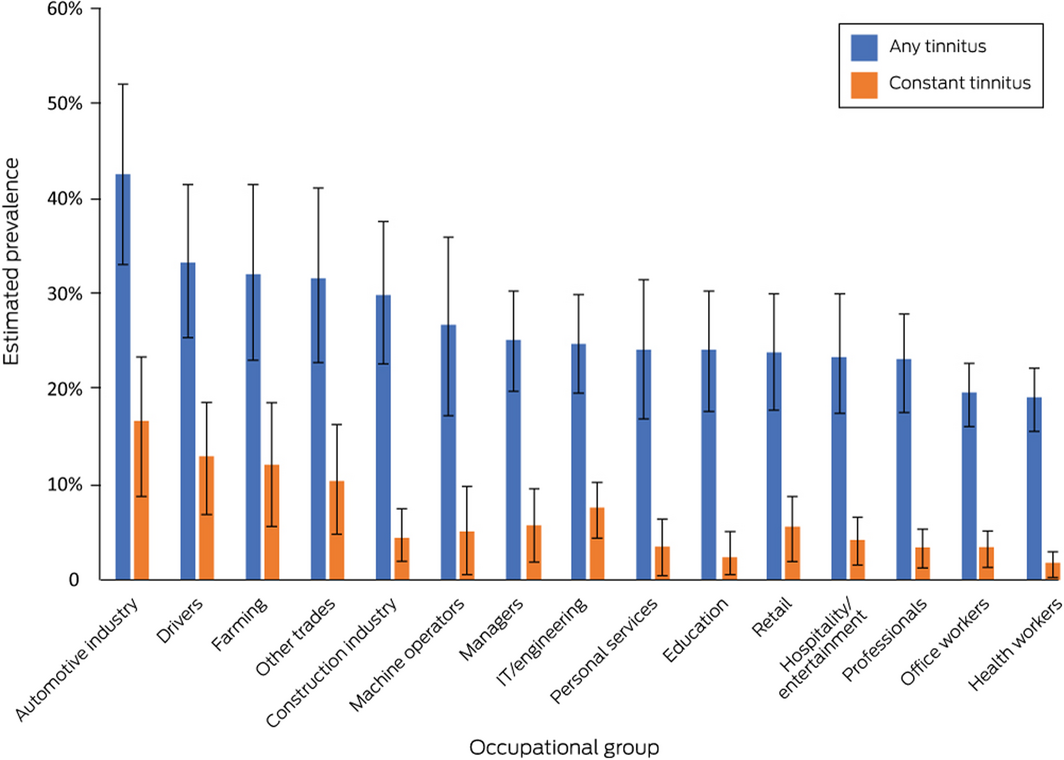
* After rake weighting of responses. Full data are included in the Supporting Information, tables 4 and 5; prevalence by occupation and sex is depicted in the Supporting Information, figure 1.
Received 5 May 2021, accepted 23 August 2021
- Kate Lewkowski1
- Jane Heyworth2
- Elinor Ytterstad3
- Warwick Williams4
- Helen Goulios2
- Lin Fritschi1
- 1 Curtin University, Perth, WA
- 2 The University of Western Australia, Perth, WA
- 3 University of Tromsø – The Arctic University of Norway, Tromsø, Norway
- 4 National Acoustics Laboratory, Macquarie University, Sydney, NSW
This investigation was funded by the National Health and Medical Research Council (#1059562).
No relevant disclosures.
- 1. Langguth B. A review of tinnitus symptoms beyond “ringing in the ears”: a call to action. Curr Med Res Opin 2011; 27: 1635–1643.
- 2. Martinez C, Wallenhorst C, McFerran D, Hall DA. Incidence rates of clinically significant tinnitus: 10‐year trend from a cohort study in England. Ear Hear 2015; 36: e69–e75.
- 3. Maes IH, Cima RF, Vlaeyen JW, et al. Tinnitus: a cost study. Ear Hear 2013; 34: 508–514.
- 4. Lockwood AH, Salvi RJ, Burkard RF. Tinnitus. N Engl J Med 2002; 347: 904–910.
- 5. Baguley D, McFerran D, Hall D. Tinnitus. Lancet 2013; 382: 1600–1607.
- 6. Coles RRA. Epidemiology of tinnitus: demographic and clinical features. J Laryngol Otol Suppl 1984; 98: 195–202.
- 7. Shargorodsky J, Curhan GC, Farwell WR. Prevalence and characteristics of tinnitus among US adults. Am J Med 2010; 123: 711–718.
- 8. Johnson A, Morata TC. Occupational exposure to chemicals and hearing impairment (Report no. NR 2010; 44(4)). Sweden: The Nordic Expert Group for Criteria Documentation of Health Risks from Chemicals, 2009. https://www.norskoljeoggass.no/globalassets/dokumenter/drift/arbeidsmiljo/kjemisk‐arbeidsmiljo/fagtema/horselsskadelige‐kjemikalier/occupational‐exposure‐to‐chemicals‐and‐hearing‐impairment.pdf (viewed Oct 2021).
- 9. Hasson D, Theorell T, Westerlund H, Canlon B. Prevalence and characteristics of hearing problems in a working and non‐working Swedish population. J Epidemiol Community Health 2010; 64: 453–460.
- 10. Lewkowski K, Heyworth JS, Li IW, et al. Exposure to noise and ototoxic chemicals in the Australian workforce. Occup Environ Med 2019; 76: 341–348.
- 11. Australian Bureau of Statistics. 1220.0. ANZSCO: Australian and New Zealand Standard Classification of Occupations, 2013, version 1.2. June 2013. https://www.abs.gov.au/AUSSTATS/abs@.nsf/allprimarymainfeatures/4AF138F6DB4FFD4BCA2571E200096BAD?opendocument (viewed May 2017).
- 12. Australian Bureau of Statistics. 1270.0.55.006. Australian Statistical Geography Standard (ASGS): correspondences, July 2011. June 2012. http://www.abs.gov.au/AUSSTATS/abs@.nsf/Lookup/1270.0.55.006Main+Features1July%202011?OpenDocument (viewed Dec 2017).
- 13. International Telecommunication Union. Economy classifications: ITU regions, corresponding to the regional grouping of the ITU’s Telecommunication Development Bureau. Undated. https://www.itu.int/en/ITU‐D/Statistics/Pages/definitions/regions.aspx (viewed Nov 2017).
- 14. Williams W, Carter L. Tinnitus and leisure noise. Int J Audiol 2017; 56: 219–225.
- 15. Henry JA, Griest S, Austin D, et al. Tinnitus screener: results from the first 100 participants in an epidemiology study. Am J Audiol 2016; 25: 153–160.
- 16. Kalton G, Flores‐Cervantes I. Weighting methods. J Off Stat 2003; 19: 81–97.
- 17. Australian Bureau of Statistics. TableBuilder. https://www.abs.gov.au/websitedbs/D3310114.nsf/home/About+TableBuilder (viewed Dec 2017).
- 18. Australian Bureau of Statistics. 2033.0.55.001. Census of Population and Housing: Socio‐Economic Indexes for Areas (SEIFA), Australia, 2011. IRSAD. Updated Mar 2013. https://www.abs.gov.au/ausstats/abs@.nsf/Lookup/by%20Subject/2033.0.55.001~2016~Main%20Features~IRSAD~20 (viewed Oct 2021).
- 19. Pasek J. anesrake: ANES raking implementation. The Comprehensive R Archive Network, 28 Apr 2018. https://CRAN.R‐project.org/package=anesrake (viewed Dec 2019).
- 20. Fabijańska A, Rogowski M, Bartnik G, Skarżyński H. Epidemiology of tinnitus and hyperacusis in Poland. In: Hazell J, editor. Proceedings of the Sixth International Tinnitus Seminar (Cambridge, UK, 5–9 Sept 1999). London: Tinnitus and Hyperacusis Centre, 2000; pp. 569–571.
- 21. Choi JS, Yu AJ, Voelker CC, et al. Prevalence of tinnitus and associated factors among Asian Americans: results from a national sample. Laryngoscope 2020; 130: E933–E940.
- 22. Veile A, Zimmermann H, Lorenz E, Becher H. Is smoking a risk factor for tinnitus? A systematic review, meta‐analysis and estimation of the population attributable risk in Germany. BMJ Open 2018; 8: e016589.
- 23. Beukes E, Ulep AJ, Eubank T, Manchaiah V. The impact of COVID‐19 and the pandemic on tinnitus: a systematic review. J Clin Med 2021; 10: 2763.
- 24. McCormack A, Edmondson‐Jones M, Somerset S, Hall D. A systematic review of the reporting of tinnitus prevalence and severity. Hear Res 2016; 337: 70–79.
Abstract
Objectives: To estimate the prevalence of tinnitus in Australian working people; to identify occupational and demographic factors associated with tinnitus.
Design: Cross‐sectional national telephone survey of self‐reported frequency and duration of tinnitus.
Setting, participants: Australian Workplace Exposure Survey (AWES) ‒ Hearing; 4970 currently employed people aged 18–64 years, recruited by random digit dialling, representative by sex of the workforce population, 7 June 2016 ‒ 20 March 2017.
Main outcome measures: Prevalence of occasional, intermittent, and constant tinnitus, and of any tinnitus, by occupational group, sex, and other demographic characteristics; estimated numbers of working people with constant or any tinnitus, by occupational group and sex.
Results: Of 4970 respondents, 1317 reported experiencing tinnitus (26.5%): 713 people had occasional tinnitus (14.3%), 259 intermittent tinnitus (5.2%), and 345 constant tinnitus (6.9%). The sample prevalence of constant tinnitus was greater among men (7.5%; 95% CI, 6.2–8.7%) than women (3.3%; 95% CI, 2.3–4.3%), and was higher in older age groups. After rake weighting our survey responses, we estimated that 2.4 million workers (24.8%; 95% CI, 23.2‒26.4%) experience tinnitus, including 529 343 with constant tinnitus (5.5%; 95% CI, 4.6–6.3%). The estimated prevalence of constant tinnitus was highest for automotive workers (16.7%; 95% CI, 9.5–23.8%), drivers (13.0%; 95% CI, 7.3–18.6%), farmers (12.1%; 95% CI, 5.9–18.4%), and workers in other trades (10.4%; 95% CI, 4.6–16.2%).
Conclusions: The prevalence of tinnitus in the Australian workforce is high, particularly in certain occupations. Workplace practices and conditions that increase the risk of tinnitus should be examined, and targeted workplace prevention strategies developed.