





Volume 216 - Issue 3
Lifestyle risks for chronic disease among Australian adolescents: a cross‐sectional survey
Authors: Katrina E Champion, Cath Chapman, Lauren A Gardner, Matthew Sunderland, Nicola C Newton, Scarlett Smout, Louise K Thornton, Leanne Hides, Nyanda McBride, Steve J Allsop, Katherine Mills, Frances Kay‐Lambkin, Maree Teesson and Tim Slade, the Heath4Life team †
Med J Aust 2022; 216 (3): 156-157. || doi: 10.5694/mja2.51333
Published online: 22 November 2021
Published online: 22 November 2021
Screening by GPs for six major risk factors and brief interventions in primary care or schools may help
Physical inactivity, poor diet, alcohol use, smoking, poor sleep, and excessive recreational screen time are lifestyle risk factors that emerge during adolescence, continue into adulthood, and often occur together.1 They are linked with obesity2 and mental health problems in the short term,3 and with increased risk of chronic disease in adulthood.4
We examined the prevalence and socio‐demographic correlates of these major lifestyle risk factors in a large sample of Australian adolescents, analysing cross‐sectional data from the Health4Life Study, a cluster randomised controlled trial of an e‐health intervention at 71 schools in 2019.5 For the baseline assessment, year 7 students were asked to complete an online survey (July‒November 2019) about their moderate to vigorous physical activity (MVPA), sedentary recreational screen time, sleep duration, diet, and alcohol and tobacco use. The frequency of each risk behaviour was estimated by sex, remoteness, and relative socio‐economic status, and the association of behaviours with socio‐demographic characteristics was assessed by logistic regression. To avoid the limitations of odds ratios for frequent outcomes, we instead estimated prevalence ratios (PRs) with 95% confidence intervals (CIs),6 adjusted for all covariates and clustering within schools. Further study details are included in the published protocol.5 The study was approved by the University of Sydney (2018/882), University of Queensland (2019000037) and Curtin University human research ethics committees (HRE2019‐0083), and also under the NSW State Education Research Applications Process (2019006).
Parental consent was provided for 7164 of 9280 students, of whom 6779 agreed to participate; 139 students were not included in the final sample because they did not provide sufficient data or withdrew after survey completion. The sample therefore comprised 6640 students aged 11‒14 years (mean, 12.7 years; standard deviation, 0.5 years); 3311 were boys (50.6%) (Box 1). Most students reported several risk behaviours (three or more, 3330 of 5315 students who provided responses for all behaviours, 62.7%; four or more, 1358 of 5315, 25.6%); total number of risk behaviours was not influenced by socio‐demographic factors (data not shown). Few students reported using alcohol (181 of 6346; 2.9% [95% CI, 2.2–3.5%]) or tobacco (97 of 6306; 1.5% [95% CI, 1.1–1.9%]) in the preceding six months. However, 5565 of 6478 students (85.9%; 95% CI, 84.0–87.8%) exceeded recommended television and electronic device screen time limits (two hours/day), 4969 of 6398 (77.7%; 95% CI, 76.1–79.2%) were not sufficiently active (less than 60 minutes MVPA/day), and 3682 of 6010 (61.3%; 95% CI, 58.9–63.6%) did not meet sleep guidelines (≤ 13 years: 9–11 hours/night; 14–17 years: 8–10 hours/night). Diet (self‐reported sugar‐sweetened beverage, fruit, vegetable, and discretionary food intake) was poor for 2920 of 5815 students (50.2%; 95% CI, 47.7–52.8%).
The prevalence of excessive recreational screen time (PR, 1.04; 95% CI, 1.01–1.06), poor diet (PR, 1.15; 95% CI, 1.08–1.23), alcohol use (PR, 1.82; 95% CI, 1.25–2.64), and tobacco use (PR, 1.94; 95% CI, 1.21–3.12) was higher for boys than girls; that of insufficient MVPA was lower for boys (PR, 0.88; 95% CI, 0.85–0.91). Poor diet was more prevalent among children from major cities than those from regional areas (PR, 1.20; 95% CI, 1.03‒1.40); tobacco use was less prevalent among those from higher socio‐economic status areas (PR, 0.33; 95% CI, 0.19–0.57 (Box 2; online Supporting Information, tables 2–5).
The composition of our sample was similar to that of the Australian population aged 11‒14 years with respect to sex and Australian birth, but students from higher socio‐economic status areas or schools with Index of Community Socio‐Educational Advantage (ICSEA) scores in the upper two quartiles, were over‐represented in our sample, as were students from independent schools (Supporting Information, tables 1 and 6).
Most of our survey participants did not meet national guidelines for screen time, physical activity, or sleep, and having multiple risk behaviours was common. Our findings highlight the need for preventive public health strategies targeting adolescent lifestyle factors that take sex, socio‐economic status, and remoteness into account. Screening by general practitioners for the six major risk factors we have highlighted, and identifying young people with multiple risk behaviours could facilitate early intervention, and brief interventions delivered in primary care or schools may be beneficial.
Box 1 – Selected socio‐demographic characteristics of the 6640 students aged 11–14 years who participated in the Health4Life survey*
|
|
Health4Life sample |
||||||||||||||
|
|
Students |
Proportion |
|||||||||||||
|
|
|||||||||||||||
|
Sex |
|
|
|||||||||||||
|
Boys |
3311 |
50.6% (41.7–59.5%) |
|||||||||||||
|
Girls |
3204 |
48.9% (40.1–57.8%) |
|||||||||||||
|
Non‐binary/gender‐fluid |
30 |
0.5% (0.3–0.6%) |
|||||||||||||
|
No response/missing data |
95 |
— |
|||||||||||||
|
State |
|
|
|||||||||||||
|
New South Wales (N = 37) |
3536 |
53.2% (39.2–67.3%) |
|||||||||||||
|
Queensland (N = 18) |
1789 |
26.9% (14.3–39.6%) |
|||||||||||||
|
Western Australia (N = 16) |
1315 |
19.8% (9.7–29.9%) |
|||||||||||||
|
School type |
|
|
|||||||||||||
|
Government (N = 24) |
2003 |
30.1% (17.2–42.9%) |
|||||||||||||
|
Independent (N = 37) |
3378 |
50.9% (36.7–65.1%) |
|||||||||||||
|
Catholic (N = 10) |
1259 |
19.0% (6.6–31.3%) |
|||||||||||||
|
Remoteness†* |
|
|
|||||||||||||
|
Major city |
5954 |
89.7% (82.8–96.5%) |
|||||||||||||
|
Inner or outer regional |
686 |
10.3% (3.5–17.2%) |
|||||||||||||
|
Socio‐economic status‡ |
|
|
|||||||||||||
|
Lower |
909 |
15.1% (12.6–17.6%) |
|||||||||||||
|
Middle |
2209 |
36.7% (34.3–39.1%) |
|||||||||||||
|
Higher |
2897 |
48.2% (44.2–52.1%) |
|||||||||||||
|
No response/missing data |
625 |
— |
|||||||||||||
|
|
|||||||||||||||
|
* A more comprehensive table is included in the online Supporting Information, table 1. † Australian Statistical Geography Standard.7 ‡ Family Affluence Scale (FAS) III.8 Scores were converted to ridit scores that compare socio‐economic status with other people in the study sample, classified as lower (under 0.2), middle (0.2–5.9), or higher socio‐economic status (0.6–1.0). |
|||||||||||||||
Box 2 – Prevalence of lifestyle risk factors among 6640 students aged 11–14 years in the Health4Life study, and prevalence ratios (with 95% confidence intervals), by socio‐demographic characteristics*
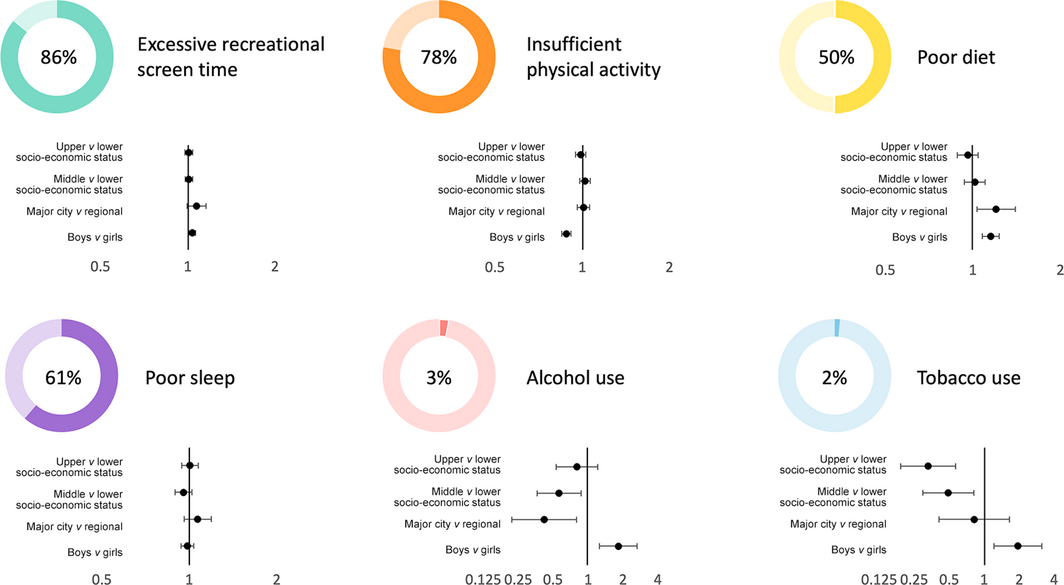
*The data for this Box are included in the online Supporting Information, table 5.
Competing interests
No relevant disclosures.
Acknowledgements
The Health4Life study is funded by the Paul Ramsay Foundation, and by the National Health and Medical Research Council through fellowships (Katrina Champion, APP1120641; Maree Teesson, APP1078407; Nicola Newton, APP1166377) and the Centre of Research Excellence in the Prevention and Early Intervention in Mental Illness and Substance Use (PREMISE; APP11349009). We thank the research assistants who collected data for the Health4Life study: Bridie Osman, Karrah McCann, Rhiannon Ellem, Jesse Whife, and Courtney Stewart. We also acknowledge the students and teachers at the participating schools.
References
- Whitaker V, Oldham M, Boyd J, et al. Clustering of health‐related behaviours within children aged 11–16: a systematic review. BMC Public Health 2021; 21: 137.
- Golley RK, Maher CA, Matricciani L, Olds TS. Sleep duration or bedtime? Exploring the association between sleep timing behaviour, diet and BMI in children and adolescents. Int J Obes (Lond) 2013; 37: 546–551.
- Boers E, Afzali MH, Newton N, Conrod P. Association of screen time and depression in adolescence. JAMA Pediatr 2019; 173: 853–859.
- Ding D, Rogers K, van der Ploeg H, et al. Traditional and emerging lifestyle risk behaviors and all‐cause mortality in middle‐aged and older adults: evidence from a large population‐based Australian cohort. PLoS Medicine 2015; 12: e1001917.
- Teesson M, Champion KE, Newton NC, et al; Health4Life Team. Study protocol of the Health4Life Initiative: a cluster randomised controlled trial of an eHealth school‐based program targeting multiple lifestyle risk behaviours among young Australians. BMJ Open 2020; 10: e035662.
- Santos CAS, Fiaccone RL, Oliveira NF, et al. Estimating adjusted prevalence ratio in clustered cross‐sectional epidemiological data. BMC Med Res Methodol 2008; 8: 80.
- Australian Bureau of Statistics. 1270.0.55.005. Australian Statistical Geography Standard (ASGS): volume 5 . Remoteness structure, July 2016. Updated 16 Mar 2018. https://www.abs.gov.au/ausstats/abs@.nsf/mf/1270.0.55.005 (viewed Oct 2021).
- Torsheim T, Cavallo F, Levin KA, et al. Psychometric validation of the revised family affluence scale: a latent variable approach. Child Indic Res 2016; 9: 771–784.
Linked content
-
InSight+: Screen time off the charts as teens head for chronic disease
Barriers and Facilitators to Timely Detection and Optimal Management of Chronic Wet Cough in Aboriginal Children Across Australia From the Perspectives of Carers of Aboriginal Children: A Qualitative Study
Gloria T. Y. Lau, Pam Laird, Robyn Aitken, Melanie Barwick, Liam Bedford, Emily R. Bowden, Jamie Everingham, Angela Fuery, Reece Griffin, Neha Jain, Mina Kinghorn, Renae Knapp, Gabrielle B. McCallum, Peter Morris, Richard Norman, Peter C. Richmond, Aarti Saiganesh, Slade Sibosado, Cameron Taylor, Maree Toombs, Roz Walker, Joan Wilson, Anne B. Chang, André Schultz
Barriers and Facilitators to Timely Detection and Optimal Management of Chronic Wet Cough in Aboriginal Children Across Australia From the Perspective of Health Care Providers: A Qualitative Study
Gloria T. Y. Lau, Pamela Laird, Robyn Aitken, Melanie Barwick, Liam Bedford, Emily R. Bowden, Corey Dalton, Jamie Everingham, Angela Fuery, Reece Griffin, Neha Jain, Mina Kinghorn, Renae Knapp, Gabrielle B. McCallum, Peter Morris, Richard Norman, Peter C. Richmond, Aarti Saiganesh, Slade Sibosado, Maree Toombs, Roz Walker, Joan Wilson, Anne B. Chang, André Schultz
Short-Term Safety of Concomitant Meningococcal B and National Immunisation Program Vaccines in Infants Aged < 15 Months: A Survey-Based Surveillance Study
Thuy Nguyen, Evelyn C. S. Tay, Michael Dymock, Thomas L. Snelling, Lucy Dawes, Julie Marsh, Yue Wu, Alan Leeb, Nicholas Wood, Lucy Deng
The GenV Biobank: Enabling Biological Research in a Large Longitudinal Population-Representative Cohort of Australian Newborns and Their Parents
Katherine Lange, Kim L. Powell, Yeukai Mangwiro, Tony Frugier, Donna T. Geddes, Melissa Wake, Richard Saffery
Watchful Waiting Compared With Immediate Antibiotics for Urban Aboriginal and Torres Strait Islander Children With Uncomplicated Acute Otitis Media (WATCH): A Non-Inferiority Randomised Controlled Trial
Jennifer S. Reath, Hasantha Gunasekera, Sanja Lujic, Amanda J. Leach, Letitia Campbell, Robyn Walsh, Tim Usherwood, Geoffrey K. Spurling, Claudette A. Tyson, Deborah A. Askew, Kelvin Kong, Chelsea J. Watego, Peter Morris, Wendy Hu, Penelope A. Abbott
A Rare Case of Storage Mite Anaphylaxis in Infancy
Eliza Kluckow, Katie Frith