


The need to treat chronic pain and the increasing number of patients requiring opioid therapy are among the factors that have led to prescription opioid‐related harm. Several professional society guidelines aim to reduce the frequency of opioid‐related problems by modifying prescriber behaviour.1,2
We analysed Monitoring of Drugs of Dependence System (MODDS) data for adult Queensland residents (18 years or older) for whom opioids were dispensed during 1 January 1997 ‒ 31 December 2018. Our aim was to determine the most frequently prescribed doses of opioids, and to examine associations between the mean number of prescribers per patient and the opioid doses dispensed. The database included data for 228 861 opioid prescribers during the study period and 18 798 942 dispensed opioid prescriptions. We undertook multivariate mixed effects Poisson regression, with random intercept by patient identification to account for within‐patient correlations and between‐patient characteristics. We adjusted for socio‐economic status of patient residence (by postcode),3 as an association between lower socio‐economic status and greater opioid prescribing has been reported.4 We also adjusted our analysis for duration of opioid use, dose in oral morphine milligram equivalents per day (MME/day), and opioid formulation, as in our previous studies.5,6 The study was approved by the Royal Brisbane and Women’s Hospital Human Research Ethics Committee (HREC/17/QRBW/669), the University of Queensland Human Research Ethics Committee (2018000623/HREC/QRBW/669), and by the Department of Health under the Public Health Act 2005 (Qld) (RD007970).
The number of patients for whom opioids were dispensed increased from 28 299 in 1997 to 322 307 in 2018; the number of Queensland medical practitioners who prescribed opioids increased from 4537 to 20 226 (online Supporting Information, table). The proportion of opioid prescribers who prescribed opioids at doses of 50 to less than 100 MME/day peaked in 2003 (813 of 5530, 14.7%), as did the proportion prescribing 100 MME/day or more (1077, 19.5%), before declining in 2018 to 1294 (6.4%) and 1064 of 22 941 (5.3%) respectively (Box 1, A; Supporting Information, figure). During 1997‒2018, 1 916 842 people (67.8% of people dispensed opioids) were dispensed doses of less than 20 MME/day, 624 114 were dispensed 20 to less than 50 MME/day (22.1%), 159 448 were dispensed 50 to less than 100 MME/day (5.6%), and 127 323 were dispensed 100 MME/day or more (4.5%) (Box 1, B). For modified release opioids, the largest proportions of prescribers and patients were for the 20 to less than 50 MME/day dose category (Box 1, C, D).
The mean number of prescribers per patient per year increased with the dose of opioids dispensed (v < 20 MME/day: 20 to < 50 MME/day, incidence rate ratio [IRR], 1.04; 95% confidence interval [CI], 1.03‒1.04; 50 to < 100 MME/day, IRR, 1.09; 95% CI, 1.08‒1.09; ≥ 100 MME/day, IRR, 1.22; 95% CI, 1.21‒1.22) (Box 2). However, the mean number of prescribers per patient per year increased as the duration of opioid dispensing decreased (patients dispensed opioids for one month v for 7‒12 months: IRR, 1.36; 95% CI, 1.35‒1.36). This finding is consistent with a report that people using opioids for shorter periods more frequently visit multiple prescribers.4,5
Our findings indicate that most Queensland medical practitioners prescribe lower opioid doses, and that the proportion prescribing lower doses has increased since 2004. The proportion of people dispensed doses of opioids associated with increased risk of accidental overdose (from 50 MME/day) was small and has declined over time.
Box 1 – Proportions of patients prescribed opioid medications and of prescribers, by opioid dose prescribed*
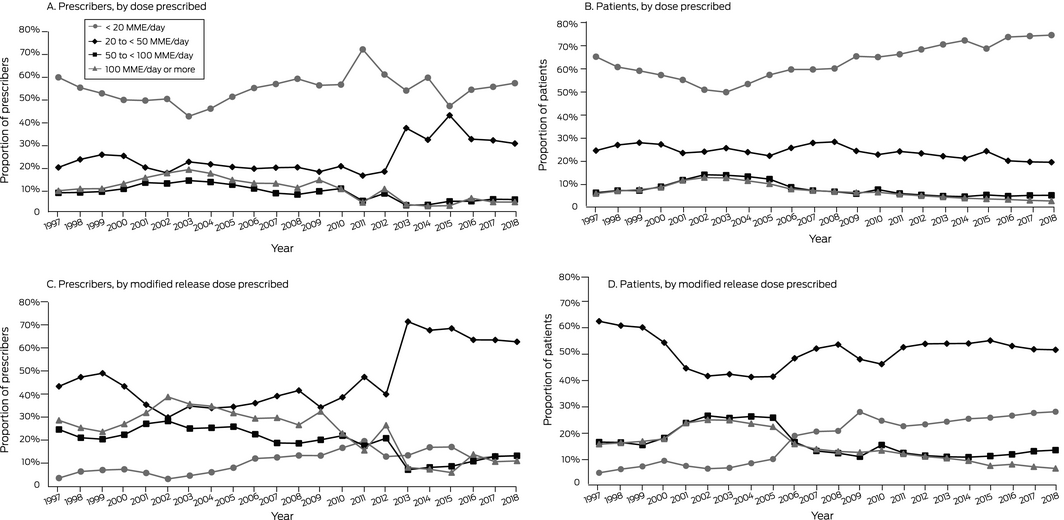
* Opioids included were morphine, oxycodone, hydromorphone, tapentadol, fentanyl, buprenorphine, and codeine; methadone was excluded because we could not distinguish between prescribing for pain management and opioid replacement therapy. All formulations except lozenges, suppositories and parenteral formulations were included, apart from tablet and sublingual buprenorphine formulations (used to treat gastrointestinal problems and opiate dependence) and fentanyl (approved for palliative care). For complete inclusion and exclusion criteria, see Supplementary Material 3 in reference 6.
Box 2 – Mean numbers of prescribers per patient per year, by daily opioid dose, duration of dispensing, and socio‐economic status
|
|
Mean prescribers per patient per year |
Incidence rate ratio (95% CI) |
|||||||||||||
|
Unadjusted |
Adjusted* |
||||||||||||||
|
|
|||||||||||||||
|
Prescribed dose (MME/day) |
|
|
|
||||||||||||
|
< 20 |
1.62 (1.61–1.62) |
1 |
1 |
||||||||||||
|
20 to < 50 |
1.76 (1.75–1.76) |
1.08 (1.08–1.09) |
1.04 (1.03–1.04) |
||||||||||||
|
50 to < 100 |
2.05 (2.04–2.05) |
1.26 (1.26–1.27) |
1.09 (1.08–1.09) |
||||||||||||
|
≥ 100 |
2.90 (2.89–2.92) |
1.79 (1.79–1.80) |
1.22 (1.21–1.22) |
||||||||||||
|
Duration of use (months) |
|
|
|
||||||||||||
|
≤ 1 |
1.81 (1.81–1.82) |
1.41 (1.41–1.42) |
1.36 (1.35–1.36) |
||||||||||||
|
2‒3 |
1.50 (1.49–1.50) |
1.17 (1.17–1.18) |
1.16 (1.16–1.17) |
||||||||||||
|
4‒6 |
1.40 (1.39–1.40) |
1.09 (1.09–1.10) |
1.09 (1.09–1.10) |
||||||||||||
|
7‒12 |
1.28 (1.27–1.28) |
1 |
1 |
||||||||||||
|
Socio‐economic status (quintile)† |
|
|
|
||||||||||||
|
1 (lowest) |
1.92 (1.92–1.93) |
1.11 (1.11–1.12) |
1.07 (1.07–1.08) |
||||||||||||
|
2 |
1.93 (1.92–1.93) |
1.11 (1.11–1.12) |
1.05 (1.05–1.06) |
||||||||||||
|
3 |
1.80 (1.79–1.80) |
1.04 (1.04–1.05) |
1.03 (1.02–1.03) |
||||||||||||
|
4 |
1.78 (1.78–1.79) |
1.03 (1.03–1.04) |
1.01 (1.01–1.02) |
||||||||||||
|
5 (highest) |
1.72 (1.71–1.72) |
1 |
1 |
||||||||||||
|
Formulation |
|
|
|
||||||||||||
|
Immediate release |
1.66 (1.65–1.66) |
1 |
1 |
||||||||||||
|
Modified release |
1.97 (1.97–1.98) |
1.19 (1.18–1.19) |
0.98 (0.99–1.00) |
||||||||||||
|
|
|||||||||||||||
|
MME = morphine milligram equivalent; CI = confidence interval. * Multivariate mixed effects Poisson regression adjusted for socio‐economic status, duration of opioid dispensing, opioid dose, and opioid formulation. † Socio‐Economic Indexes for Areas (SEIFA Index of Relative Socio‐Economic Advantage and Disadvantage (IRSAD).3 |
|||||||||||||||
Received 8 October 2020, accepted 9 April 2021
- 1. Currow DC, Phillips J, Clark K. Using opioids in general practice for chronic non‐cancer pain: an overview of current evidence. Med J Aust 2016; 204: 305–309. https://www.mja.com.au/journal/2016/204/8/using-opioids-general-practice-chronic-non-cancer-pain-overview-current-evidence
- 2. Dowell D, Haegerich TM, Chou R. CDC Guideline for prescribing opioids for chronic pain: United States, 2016. JAMA 2016; 315: 1624–1645.
- 3. Australian Bureau of Statistics. 2033.0.55.001. Census of population and housing: Socio‐Economic Indexes for Areas (SEIFA), Australia, 2016: IRSAD. Mar 2018. https://www.abs.gov.au/ausstats/abs@.nsf/Lookup/by%20Subject/2033.0.55.001~2016~Main%20Features~IRSAD~20 (viewed Apr 2021).
- 4. Holliday S, Morgan S, Tapley A, et al. The pattern of opioid management by Australian general practice trainees. Pain Med 2015; 16: 1720–1731.
- 5. Adewumi AD, Maravilla JC, Alati R, et al. Multiple opioid prescribers: a genuine quest for treatment rather than aberrant behaviour. A two‐decade population‐based study. Addict Behav 2020; 108: 106458.
- 6. Adewumi AD, Maravilla JC, Alati R, et al. Pharmaceutical opioids utilisation by dose, formulation, and socioeconomic status in Queensland, Australia: a population study over 22 years. Int J Clin Pharm 2020; 43: 328–339.
No relevant disclosures.