


The known: Non‐alcoholic fatty liver disease (NAFLD) is the most common liver disease and a leading cause of cirrhosis and liver cancer. Information on the epidemiology of NAFLD in Australia is limited.
The new: The age‐ and sex‐standardised prevalence of NAFLD in regional Victoria was high (36%). People with NAFLD more frequently had metabolic risk factors, such as obesity and diabetes, than other participants in our survey, and their mean levels of liver injury markers were higher.
The implications: Our findings have important public health implications for managing the expected increase in NAFLD burden over the next few years, particularly in regional communities.
Non‐alcoholic fatty liver disease (NAFLD) is the most common liver disease around the world, with an estimated prevalence of about 25% in white populations.1 NAFLD, defined as excessive accumulation of fat in the liver of people without excessive alcohol intake, comprises a spectrum of disease ranging from simple steatosis to non‐alcoholic steatohepatitis and liver fibrosis, both of which may progress to cirrhosis and liver‐related morbidity and death.2 Risk factors for NAFLD include obesity, diabetes, dyslipidaemia, and the metabolic syndrome.1
In Australia, the prevalence of NAFLD is estimated to be 20–30%, affecting about 5.5 million people.3,4 This high prevalence has been attributed to the increasing burden of obesity5 and the metabolic syndrome.5,6 Further, a recent modelling study has found that the burden of NAFLD‐related disease in Australia will increase markedly during the current decade.6 However, the exact prevalence of NAFLD in Australia remains unknown, as most estimates have been derived from overseas studies or expert opinion.3,4,6
The fatty liver index, based on simple clinical and laboratory parameters,7 provides a validated rapid and reliable method for identifying people with fatty liver.8,9,10,11 More recently, controlled attenuation parameter (CAP) measurement using vibration controlled transient elastography (VCTE) has proved to be a reliable non‐invasive tool for assessing hepatic steatosis in people with NAFLD.12,13,14
We undertook this study as part of the CrossRoads II study (Health in Shepparton and Mooroopna 2016‒2018),15 with the aim of obtaining high quality NAFLD prevalence and epidemiological data for regional communities in Victoria.
Methods
We undertook a cross‐sectional epidemiological study in four towns in the Goulburn Valley, a rural region of Victoria 100–300 km north of Melbourne. It was a sub‐study of the CrossRoads II study, the methods for which have been published elsewhere.15 Briefly, in the CrossRoads II study, a face‐to‐face survey was administered to 1895 of 3022 households (response rate, 63%) randomly selected from residential address lists provided by local government organisations in four Goulburn Valley towns (town population range, 6300–49 800 people). Health, health behaviour, and health service information reported in the survey was verified and supplemented by data from a nested sub‐study of randomly selected adult participants in clinics conducted in the four towns during 1 October 2016 – 31 December 2018. One adult participant (18 years old or more) was randomly selected from each participating household to attend the clinic, at which they completed further health questionnaires about diet, exercise, and smoking and alcohol history. Anthropometric measures, blood pressure, and oral glucose tolerance were also assessed, as were biochemical parameters — liver function (alanine aminotransferase [ALT], aspartate aminotransferase [AST],
γ‐glutamyltransferase [GGT]) and serum lipid levels — and viral hepatitis serology. In addition, VCTE with FibroScan (Echosens) was performed when available.
Definition of non‐alcoholic fatty liver disease: the fatty liver index
Fatty liver index score — based on waist circumference, body mass index (BMI), and serum triglyceride and GGT levels — was calculated for each participant.7 NAFLD was primarily defined as a fatty liver index score of 60 or more in people without excessive alcohol intake (women, ≥ 20 g/day; men ≥ 30 g/day) or viral hepatitis.5,6,7,8,9 Alcohol intake was quantified in an eleven‐part questionnaire about the type, frequency, and quantity of alcohol consumed (online Supporting Information, health questionnaire).
Liver stiffness
To determine liver stiffness and CAP, VCTE was performed (FibroScan, models 402 or 530 compact; M or XL probes) by one of three experienced hepatologists (authors WK, AM, SKR). CAP was measured with the FibroScan 530 compact machine when available. CAP assessment by VCTE was not available until 19 May 2018. Reliable readings of median liver stiffness required at least ten valid readings (success rate of 60% or more and a interquartile range/median ratio of 0.3 or less). A FibroScan reading of less than 7.0 kPa was deemed normal; a reading of less than 8 kPa excluded advanced fibrosis.13 A CAP reading of 302 dB/m or more in people without excessive alcohol intake was deemed to indicate fatty liver.14
Definition of metabolic syndrome
Metabolic syndrome was defined according to the National Cholesterol Education Program Adult Treatment Panel III (ATP III) criteria.16 Dyslipidaemia was defined according to standard criteria.17 Obesity was defined as a BMI of 30 kg/m2 or more. Hypertension was defined as systolic blood pressure greater than 130 mmHg, diastolic blood pressure greater than 85 mmHg, or the participant requiring anti‐hypertensive treatment. Diabetes was defined by self‐report.
Statistical analysis
All collected data, including survey questionnaire responses, anthropometric, blood pressure, and pathology assessments, and FibroScan liver stiffness and CAP measurements, were entered into a REDCap database, then transferred to Excel (Microsoft) and Stata 14.1 for analysis.
Continuous variables were assessed for normality and summarised as means with standard deviations (SDs); categorical variables were summarised as frequencies and proportions. Age‐adjusted NAFLD prevalence estimates were computed by direct standardisation with age‐ and sex‐based group proportions based on 2016 census data for Shepparton, the largest participating town.18 The statistical significance of differences between people with or without NAFLD were assessed in t tests (continuous variables) or Fisher exact tests (categorical variables); P < 0.05 (two‐tailed) was deemed statistically significant. Given the high prevalence of NAFLD, the robust Poisson method was used to estimate NAFLD prevalence ratios by key metabolic characteristics, adjusted for age and sex.
Ethics approval
Both the CrossRoads II study and this sub‐study were approved by the Goulburn Valley Health Human Research Ethics Committee (reference, 20/16).
Results
Of the 1895 adults randomly selected and invited to participate in our sub‐study, 1233 agreed to participate (65%); 747 of the 1233 people attended clinic reviews (61% of agreed participants), of whom 705 completed all clinical, laboratory and questionnaire evaluations of alcohol use and were therefore eligible for inclusion in our analysis (overall participation rate, 37%). Most were ethnically white (655, 93%), Australian‐born (597, 85%), and women (392, 56%); their mean age was 59.1 years (SD, 16.1 years). Large proportions of the participants were overweight (276, 39%) or obese (252, 36%), or had other metabolic risk factors, including hypertension (55%), dyslipidaemia (44%), high fasting blood glucose levels (23%), and metabolic syndrome (30%) (Box 1). A larger proportion of the invitees who attended the clinic were men than of those who did not (323 of 722, 45% v 186 of 510, 36%) and their mean age was higher (non‐attenders: 49.8 years; SD, 19.0 years). The demographic and epidemiologic characteristics of people who attended the clinic were similar for those did or did not complete the evaluations required for study inclusion (Supporting Information, table).
Prevalence of non‐alcoholic fatty liver disease
A total of 274 participants fulfilled our fatty liver index definition of NAFLD, a crude prevalence rate of 38.9% (Box 1, Box 2). The age‐standardised rate was 35.2%, the age‐ and sex‐standardised prevalence 35.7%. Crude prevalence rates for the four towns ranged between 35% (Benalla) and 46% (Seymour); the rate for the large regional centre Shepparton/Mooroopna (38%) and the three smaller towns combined (40%) were similar. The prevalence rate exceeded 40% for both men and women aged 60–69 years or 70–79 years, and for men aged 80–89 years (Box 2).
Of the 74 participants who underwent CAP assessment by VCTE, concordance between CAP and fatty liver index assessment was good for the 69 participants with valid CAP measurements (r2 = 0.24), 22 of whom met the CAP‐based criteria for NAFLD (sub‐group prevalence, 32%). Were a CAP cut‐off of 274 dB/m used (optimising sensitivity rather than diagnostic accuracy14), 34 participants met the criterion (sub‐group prevalence, 49%).
Epidemiology of non‐alcoholic fatty liver disease
The mean age of participants with NAFLD (61 years; SD, 15 years) was higher than for those without NAFLD (58 years; SD, 16 years), as was their mean body weight (95 kg; SD, 17 kg v 74 kg; SD, 16 kg); a larger proportion of people with NAFLD were men (50% v 41%). Several metabolic risk factors were more frequent among participants with NAFLD than for those without NAFLD: obesity (69% v 15%), hypertension (66% v 48%), diabetes (19% v 8%), and dyslipidaemia (63% v 33%) (Box 1).
Prevalence of non‐alcoholic fatty liver disease, by demographic and metabolic risk factors
The prevalence of NAFLD among men aged 60 years or more was particularly high (96 of 196 participants, 49%). Prevalence was at least 45% in men and women in both age categories (under 60 years, 60 years or more) with major metabolic risk factors (obesity, diabetes, dyslipidaemia, and the metabolic syndrome; Box 3). The prevalence of NAFLD was higher in overweight (age‐ and sex‐adjusted prevalence ratio [aPR], 12; 95% CI, 4.6–33) and obese people (aPR, 32; 95% CI, 12–86) than in people with BMI values below 25 kg/m2 (Box 4).
Measures of liver disease severity
Mean serum ALT levels were higher for NAFLD participants (29 U/L; SD, 17 U/L) than for those without NAFLD (24 U/L; SD, 14 U/L); the proportion with values greater than 150% of the upper limit of normal was similarly higher (18% v 10%). Liver stiffness was assessed by VCTE in 388 of 705 participants (55%), of whom 375 had valid readings. The mean value was higher in the 143 participants with NAFLD (6.5 kPa; SD, 5.6 kPa) than in the 232 participants without NAFLD (5.3 kPa; SD, 2.0 kPa). The liver stiffness measurement was 8 kPa or more (ie, advanced fibrosis could not be excluded) for 18 participants with NAFLD (13%). In the 69 participants with valid CAP measurements, mean values were higher for the 22 with NAFLD (305 dB/m; SD, 63 dB/m) than for the 47 without NAFLD (256 dB/m; SD, 52 dB/m) (Box 5).
Discussion
NAFLD is emerging as a serious health problem in Australia because of its high prevalence and potential to cause cirrhosis and liver cancer, but local high quality epidemiologic data on NAFLD are limited.3 We therefore undertook a population‐based study, using the fatty liver index as a marker, to evaluate the prevalence and epidemiology of NAFLD in four towns in the Goulburn Valley of Victoria. Our main findings were that the age‐ and sex‐standardised prevalence of NAFLD among adults was high, and that metabolic risk factors and markers of liver injury were more frequent among people with NAFLD.
The fatty liver index is an accepted and validated tool for detecting NAFLD in large epidemiologic studies,10 particularly in predominantly white populations.8,9 Several studies have reported good concordance of fatty liver index scores with hepatic ultrasound for detecting hepatic steatosis in white people.10 In our study, we used the fatty liver index to estimate crude and age‐ and sex‐adjusted prevalence rates of NAFLD in regional Victoria, and found them to be high (crude, 39%; adjusted, 36%), with rates exceeding 45% in people aged 60 years or more, and in people with metabolic risk factors. Our findings are similar to the 32.5% rate for a large multi‐ethnic United States sample similarly assessed with the fatty liver index,11 and higher than the 10–14% reported for the general Australian population in studies that used elevated ALT levels as the marker of NAFLD.6,19
Another important finding was that prevalence of several metabolic risk factors, including obesity, elevated fasting blood glucose levels, hypertension, dyslipidaemia, and metabolic syndrome was high in our rural sample, as we also found in our earlier study.20,21 The prevalence of metabolic risk factors was particularly high in participants with NAFLD, including obesity (75%), diabetes (19%), hypertension (66%), and dyslipidaemia (63%). Our data not only provide strong justification for the proposed change in nomenclature from NAFLD to metabolic‐associated fatty liver disease (MAFLD),22 but also the inclusion of obesity as a diagnostic criterion for MAFLD.23 Further, while the MAFLD definition does not include fatty liver index as a marker of hepatic steatosis,23 333 of 705 clinic attenders in our study (47%) would have met the diagnostic criteria for MAFLD according to their fatty liver index scores, all but seven of whom were overweight or obese.
One unique aspect of our study was that we used VCTE to assess the prevalence and severity of asymptomatic liver disease in a substantial number of participants attending the regional clinics. We found that the mean median liver stiffness was greater for participants with NAFLD than for those without NAFLD, and that readings for about one in eight participants with NAFLD were consistent with advanced liver fibrosis. Similarly, serum ALT levels were higher in participants with NAFLD. Given the relationship between elevated ALT levels and increased all‐cause mortality in the general population24 and in older people,25 as well as the high prevalence of NAFLD and its association with several metabolic risk factors, our findings confirm that NAFLD may become a significant public health problem during the next ten years.6
Strengths and limitations
Our study was the first to evaluate the epidemiology of NAFLD in Australian adults at the population level using an established marker for fatty liver and employing validated methodology, including random participant selection and comprehensive data collection from almost all clinic attenders.15 However, the study was set in a single area of regional Victoria, with a predominantly white population of limited ethnic diversity. As about 30% of the Australian population (about 7 million people) live in rural and remote areas,26 our findings may be relevant to white residents in these regions, even if they are not generalisable to metropolitan populations with more diverse communities. Secondly, although the fatty liver index is accepted for evaluating NAFLD at the population level and has been validated in a population of older white people,8 it underestimates the risk of lean non‐alcoholic steatohepatitis in people with normal body weight.10 However, our CAP data supported our fatty liver index‐based findings; NAFLD prevalence estimated using CAP was 32% or 49%, depending on the cut‐off applied, and the mean CAP reading for participants with NAFLD was higher than for those without NAFLD. Finally, although our reported prevalence rate was age‐ and sex‐standardised and the final participation rate was reasonable (37%), selection bias was possible, as people concerned about their own health, including older people and women, may have been more likely to accept invitations to health check‐ups.
Conclusion
Our population‐based epidemiologic study of adults in regional Victoria was the first to assess the burden of NAFLD in Australia. The high prevalence rate, strong association with metabolic risk factors, and high levels of non‐invasive markers of liver injury in people with NAFLD have significant public health implications for the coming decade.
Box 1 – Demographic, clinical, and laboratory characteristics of the 705 participants, by non‐alcoholic fatty liver disease (NAFLD) status*
|
Characteristic |
All participants |
With NAFLD |
Without NAFLD |
P |
|||||||||||
|
|
|||||||||||||||
|
Number of participants |
705 |
274 |
431 |
|
|||||||||||
|
Sex (men) |
313 (44.4%) |
136 (49.6%) |
177 (41.1%) |
0.029 |
|||||||||||
|
Age (years), mean (SD) |
59.1 (16.1) |
61.2 (15.4) |
57.7 (16.4) |
0.005 |
|||||||||||
|
Born in Australia |
597 (84.8%) |
232 (84.7%) |
365 (84.9%) |
1.0 |
|||||||||||
|
Ethnic background |
|
|
|
0.78 |
|||||||||||
|
White |
655 (92.9%) |
257 (93.8%) |
398 (92.3%) |
|
|||||||||||
|
Asian |
30 (4.3%) |
9 (3%) |
21 (4.9%) |
|
|||||||||||
|
Aboriginal/Torres Strait Islander |
6 (0.9%) |
2 (0.7%) |
4 (0.9%) |
|
|||||||||||
|
Other |
14 (2.0%) |
6 (2%) |
8 (2%) |
|
|||||||||||
|
Regional town |
|
|
|
0.33 |
|||||||||||
|
Shepparton/Mooroopna |
331 (46.9%) |
125 (45.6%) |
206 (47.8%) |
|
|||||||||||
|
Benalla |
150 (21.3%) |
53 (16%) |
97 (22%) |
|
|||||||||||
|
Cobram |
109 (15.5%) |
43 (16%) |
66 (15%) |
|
|||||||||||
|
Seymour |
115 (16.3%) |
53 (19%) |
62 (14%) |
|
|||||||||||
|
Weight (kg), mean (SD) |
82.2 (19.1) |
95.0 (17.3) |
74.0 (15.5) |
< 0.001 |
|||||||||||
|
Body mass index (kg/m2), mean (SD) |
29.7 (19.6) |
33.5 (5.9) |
27.3 (24.4) |
< 0.001 |
|||||||||||
|
Body mass index, category |
|
|
|
< 0.001 |
|||||||||||
|
Underweight/normal (< 25 kg/m2) |
177 (25.1%) |
4 (2%) |
173 (40.1%) |
|
|||||||||||
|
Overweight (25 to < 30 kg/m2) |
276 (39.2%) |
82 (30%) |
194 (45.0%) |
|
|||||||||||
|
Obese (≥ 30 kg/m2) |
252 (35.7%) |
188 (68.6%) |
64 (15%) |
|
|||||||||||
|
Waist circumference (cm), mean (SD) |
99 (15) |
110 (12) |
91 (12) |
< 0.001 |
|||||||||||
|
Large waist circumference† |
412 (58.4%) |
240 (87.6%) |
172 (39.9%) |
< 0.001 |
|||||||||||
|
Hypertension |
385 (54.9%) |
180 (65.9%) |
205 (47.9%) |
< 0.001 |
|||||||||||
|
Dyslipidaemia |
311 (44.1%) |
172 (62.8%) |
139 (33.3%) |
< 0.001 |
|||||||||||
|
Diabetes |
87 (12%) |
53 (19%) |
34 (7.9%) |
< 0.001 |
|||||||||||
|
Excessive alcohol intake‡ |
99 (14%) |
0 |
99 (23%) |
— |
|||||||||||
|
Metabolic syndrome |
204 (29.7%) |
142 (52.6%) |
62 (15%) |
< 0.001 |
|||||||||||
|
Laboratory values |
|
|
|
|
|||||||||||
|
‐Glutamyltransferase (U/L), mean (SD) |
33 (39) |
40 (42) |
28 (36) |
< 0.001 |
|||||||||||
|
Fasting glucose ≥ 5.6 mmol/L |
164 (23.3%) |
100 (37%) |
64 (14%) |
< 0.001 |
|||||||||||
|
Glycated haemoglobin, mean (SD) |
5.5 (0.7) |
5.7 (0.9) |
5.3 (0.6) |
< 0.001 |
|||||||||||
|
Total cholesterol (mmol/L), mean (SD) |
4.9 (1.0) |
4.8 (1.0) |
5.0 (1.0) |
0.12 |
|||||||||||
|
LDL cholesterol (mmol/L), mean (SD) |
2.8 (0.9) |
2.8 (0.9) |
2.9 (0.9) |
0.13 |
|||||||||||
|
HDL cholesterol (mmol/L), mean (SD) |
1.4 (0.4) |
1.2 (0.3) |
1.6 (0.4) |
< 0.001 |
|||||||||||
|
Low HDL cholesterol§ |
184 (26.1%) |
121 (44.2%) |
63 (15%) |
< 0.001 |
|||||||||||
|
Triglycerides ≥ 1.7 mmol/L |
192 (27.2%) |
121 (44.1%) |
71 (16%) |
< 0.001 |
|||||||||||
|
|
|||||||||||||||
|
HDL = high density lipoprotein; LDL = low density lipoprotein; SD = standard deviation. * Fatty liver index score of 60 or more in people without excessive alcohol intake or viral hepatitis. † Women, > 88 cm; men, > 102 cm. ‡ Women, ≥ 20 g/day; men, ≥ 30 g/day. § Women, < 1.3 mmol/L; men, < 1.04 mmol/L. |
|||||||||||||||
Box 2 – Prevalence of non‐alcoholic fatty liver disease in the 705 participants, by age and sex
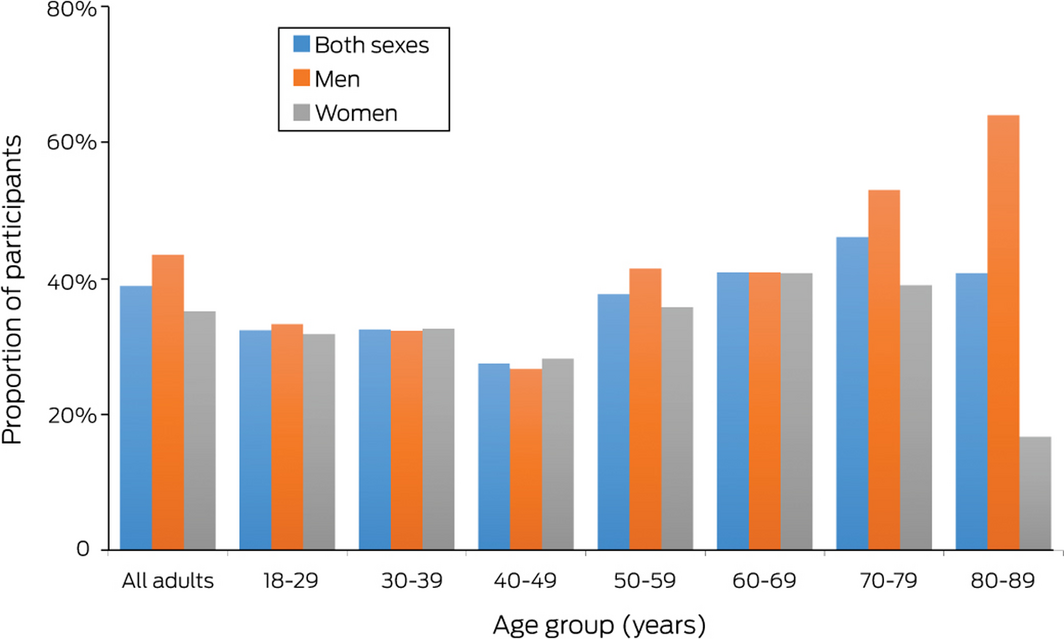
Numbers of people, by age and sex: 18–29 years (15 men, 22 women), 30–39 years (31 men, 46 women), 40–49 years (30 men, 39 women), 50–59 years (41 men, 81 women), 60–69 years (88 men, 98 women), 70–79 years (83 men, 82 women), and 80–89 years (25 men, 24 women); all ages: 313 men, 392 women.
Box 3 – Prevalence of non‐alcoholic fatty liver disease (NAFLD) by age, sex, and metabolic risk factors
|
|
Men |
Women |
All participants |
||||||||||||
|
Characteristic |
< 60 years |
≥ 60 years |
< 60 years |
≥ 60 years |
< 60 years |
Proportion (95% CI) |
≥ 60 years |
Proportion (95% CI) |
|||||||
|
|
|||||||||||||||
|
Participants |
117 |
196 |
188 |
204 |
305 |
|
400 |
|
|||||||
|
Participants with NAFLD |
40 |
96 |
62 |
76 |
102 |
33% |
172 |
43% |
|||||||
|
Body mass index |
|
|
|
|
|
|
|
|
|||||||
|
< 25 kg/m2 |
0/28 |
3/33 |
1/59 |
0/57 |
1/87 |
1% |
3/90 |
3% |
|||||||
|
25–29 kg/m2 |
16/55 |
47/102 |
6/54 |
13/65 |
22/109 |
20% |
60/167 |
36% |
|||||||
|
≥ 30 kg/m2 |
24/34 |
46/61(75%) |
55/75 |
63/82 |
79/109 |
73% |
109/143 |
76% |
|||||||
|
Diabetes |
|
|
|
|
|
|
|
|
|||||||
|
Yes |
10/12 |
20/34 |
6/11 |
17/30 |
16/23 |
70% |
37/64 |
58% |
|||||||
|
No |
30/105 |
76/162 |
56/177 |
59/174 |
86/282 |
30% |
135/336 |
40% |
|||||||
|
Hypertension |
|
|
|
|
|
|
|
|
|||||||
|
Yes |
28/62 |
73/137 |
31/66 |
48/120 |
59/128 |
46% |
121/257 |
47% |
|||||||
|
No |
12/55 |
23/58 |
30/119 |
28/84 |
42/174 |
24% |
51/142( |
36% |
|||||||
|
Dyslipidaemia |
|
|
|
|
|
|
|
|
|||||||
|
Yes |
31/54 |
51/88 |
42/83 |
48/86 |
73/137 |
53% |
99/174 |
57% |
|||||||
|
No |
9/63 |
45/108 |
20/105 |
28/118 |
29/168 |
17% |
73/226 |
32% |
|||||||
|
Metabolic syndrome |
|
|
|
|
|
|
|
|
|||||||
|
Yes |
22/28 |
47/70 |
28/40 |
45/66 |
50/68 |
74% |
92/136 |
68% |
|||||||
|
No |
17/86 |
46/118 |
34/144 |
31/136 |
51/230 |
21% |
77/254 |
30% |
|||||||
|
|
|||||||||||||||
|
CI = confidence interval. |
|||||||||||||||
Box 4 – Age‐ and sex‐adjusted non‐alcoholic fatty liver disease prevalence ratios, by metabolic risk factor
|
Characteristic |
Adjusted prevalence ratio (95% CI) |
||||||||||||||
|
|
|||||||||||||||
|
Body mass index |
|
||||||||||||||
|
< 25 kg/m2 |
1 |
||||||||||||||
|
25–29 kg/m2 |
12 (4.6–33) |
||||||||||||||
|
≥ 30 kg/m2 |
32 (12–86) |
||||||||||||||
|
Diabetes |
|
||||||||||||||
|
Yes |
1 |
||||||||||||||
|
No |
1.6 (1.3–2.0) |
||||||||||||||
|
Hypertension |
|
||||||||||||||
|
Yes |
1 |
||||||||||||||
|
No |
1.5 (1.2–1.8) |
||||||||||||||
|
Dyslipidaemia |
|
||||||||||||||
|
Yes |
1 |
||||||||||||||
|
No |
2.1 (1.8–2.6) |
||||||||||||||
|
Metabolic syndrome |
|
||||||||||||||
|
Yes |
1 |
||||||||||||||
|
No |
2.6 (2.2–3.1) |
||||||||||||||
|
|
|||||||||||||||
|
CI = confidence interval. |
|||||||||||||||
Box 5 – Non‐invasive markers of liver disease severity in patients with and without non‐alcoholic fatty liver disease (NAFLD)
|
|
Participants with NAFLD |
Participants without NAFLD |
|
||||||||||||
|
Characteristic |
All |
Men |
Women |
All |
Men |
Women |
P |
||||||||
|
|
|||||||||||||||
|
All participants |
274 |
136 |
138 |
431 |
177 |
254 |
|
||||||||
|
Alanine aminotransferase (U/L), mean (SD) |
29 (17) |
32 (14) |
27 (20) |
24 (14) |
28 (13) |
21 (14) |
< 0.001 |
||||||||
|
> 1.5 × upper limit of normal* |
48 (18%) |
19 (14%) |
29 (21%) |
44 (10%) |
16 (9%) |
28 (11%) |
0.006 |
||||||||
|
Aspartate aminotransferase (U/L), mean (SD) |
26 (9) |
28 (7) |
25 (10) |
26 (9) |
28 (9) |
24 (9) |
0.68 |
||||||||
|
Median liver stiffness measurement (kPa), mean (SD) |
6.5 (5.6) |
6.1 (4.8) |
6.9 (6.3) |
5.3 (2.0) |
5.7 (2.3) |
4.9 (1.7) |
0.005 |
||||||||
|
< 7 kPa |
114/143 |
60/74 |
54/69 |
197/232 |
85/104 |
112/1228 |
0.21 |
||||||||
|
≥ 8 kPa |
18/143 |
9/74 |
9/69 |
21/232 |
12/104 |
9/128 |
0.30 |
||||||||
|
Controlled attenuation parameter (dB/m), mean (SD) |
305 (63) |
323 (52) |
282 (69) |
256 (52) |
263 (65) |
250 (42) |
0.001 |
||||||||
|
Participants with valid measurements |
22 |
13 |
9 |
47 |
25 |
22 |
|
||||||||
|
|
|||||||||||||||
|
* Women, 20 U/L; men, 30 U/L. |
|||||||||||||||
Received 25 September 2020, accepted 15 February 2021
- Stuart K Roberts1,2
- Ammar Majeed1,2
- Kristen Glenister3
- Dianna Magliano4
- John S Lubel1,2
- Lisa Bourke3
- David Simmons5
- William W Kemp1,2
- 1 Alfred Health, Melbourne, VIC
- 2 Monash University, Melbourne, VIC
- 3 University of Melbourne, Shepparton, VIC
- 4 Baker IDI Heart and Diabetes Institute, Melbourne, VIC
- 5 Macarthur Clinical School, Western Sydney University, Sydney, NSW
The investigation was supported by a National Health and Medical Research Council partnership grant (APP 1113850). We thank Dunya (Dee) Tomic, medical student at Monash University, for helping collate the initial dataset.
No relevant disclosures.
- 1. Younossi ZM, Anstee QM, Marietti M, et al. Global burden of NAFLD and NASH: trends, predictions, risk factors and prevention. Nat Rev Gastroenterol Hepatol 2018; 15: 11–20.
- 2. Singh S, Allen AM, Wang Z, et al. Fibrosis progression in nonalcoholic fatty liver vs nonalcoholic steatohepatitis: a systematic review and meta-analysis of paired-biopsy studies. Clin Gastroenterol Hepatol 2015; 13: 643–654.
- 3. Mahady SE, Adams LA. Burden of non-alcoholic fatty liver disease in Australia. J Gastroenterol Hepatol 2018; 33 (Suppl 1): 1–11.
- 4. Deloitte Access Economics. The economic cost and health burden of liver disease in Australia. The Gastroenterological Society of Australia/Australian Liver Association. Jan 2013. https://www.gesa.org.au/public/13/files/Education%20&%20Resources/Clinical%20Practice%20Resources/Cost%20of%20Liver%20Disease/Cost_of_liver_Disease.pdf (viewed July 2020).
- 5. Australian Institute of Health and Welfare. A picture of overweight and obesity in Australia (Cat. no. PHE 216). Nov 2017. https://www.aihw.gov.au/reports/overweight-obesity/a-picture-of-overweight-and-obesity-in-australia/summary (viewed May 2021).
- 6. Adams LA, Roberts SK, Strasser SI, et al. Nonalcoholic fatty liver disease burden: Australia, 2019–30. J Gastroenterol Hepatol 2020; 35(9): 1628–1635.
- 7. Bedogni G, Bellentani S, Miglioli L, et al. The Fatty Liver Index: a simple and accurate predictor of hepatic steatosis in the general population. BMC Gastroenterology 2006; 6: 33.
- 8. Koehler EM, Schouten JNL, Hansen BE, et al. External validation of the fatty liver index for identifying nonalcoholic fatty liver disease in a population-based study. Clin Gastroenterol Hepatol 2013; 11: 1201–1212.
- 9. Meffert PJ, Baumeister SE, Lerch MM, et al. Development, external validation, and comparative assessment of a new diagnostic score for hepatic steatosis. Am J Gastroenterol 2014; 109: 1404–1414.
- 10. Vanni E, Bugianesi E. Utility and pitfalls of fatty liver index in epidemiologic studies for the diagnosis of NAFLD. Aliment Pharmacol Ther 2015; 41: 406–407.
- 11. Le MH, Yeo YH, Cheung R, et al. Ethnic influence on nonalcoholic fatty liver disease prevalence and lack of disease awareness in the United States, 2011–2016. J Intern Med 2020; 287: 711–722.
- 12. Carvalhana S, Leitão J, Alves AC, et al. How good is controlled attenuation parameter and fatty liver index for assessing liver steatosis in general population: correlation with ultrasound. Liver Int 2014; 34: e111–e117.
- 13. Castera L, Friedrich-Rust M, Loomba R. Noninvasive assessment of liver disease in patients with nonalcoholic fatty liver disease. Gastroenterology 2019; 156: 1264–1281.
- 14. Eddowes PJ, Sasso M, Allison M, et al. Accuracy of FibroScan controlled attenuation parameter and liver stiffness measurement in assessing steatosis and fibrosis in patients with nonalcoholic fatty liver disease. Gastroenterology 2019; 156: 1717–1730.
- 15. Glenister KM, Bourke L, Bolitho L, et al. Longitudinal study of health, disease and access to care in rural Victoria: the Crossroads-II study: methods. BMC Public Health 2018; 18: 670.
- 16. Grundy SM, Cleeman JI, Daniels SR, et al. Diagnosis and management of the metabolic syndrome: an American Heart Association/National Heart, Lung, and Blood Institute scientific statement. Circulation 2005; 112: 2735–2752.
- 17. Fodor G. Primary prevention of CVD: treating dyslipidaemia. BMJ Clin Evid 2010; 2010:0215.
- 18. Australian Bureau of Statistics. 2016 Census QuickStats: Shepparton. Updated 30 Oct 2020. https://quickstats.censusdata.abs.gov.au/census_services/getproduct/census/2016/quickstat/216 (viewed Oct 2020).
- 19. Mahady SE, Gale J, Macaskill P, et al. Prevalence of elevated alanine transaminase in Australia and its relationship to metabolic risk factors: a cross-sectional study of 9447 people. J Gastroenterol Hepatol 2017; 32: 169–176.
- 20. Devers MC, Campbell S, Shaw J, et al. Should liver function tests be included in definitions of the metabolic syndrome? Evidence from association between liver function tests, components of the metabolic syndrome, and prevalent cardiovascular disease. Diab Med 2008; 25: 523–529.
- 21. Devers MC, Campbell S, Simmons D. Influence of age on the prevalence and components of the metabolic syndrome and the association with cardiovascular disease. BMJ Open Diab Res Care 2016; 4: e000195.
- 22. Eslam M, Sanyal A, George J; International Consensus Panel. MAFLD: a consensus-driven proposed nomenclature for metabolic associated fatty liver disease. Gastroenterology 2020; 158: 1999–2014.
- 23. Eslam M, Newsome PN, Sarin SK, et al. A new definition for metabolic dysfunction-associated fatty liver disease: an international expert consensus statement. J Hepatol 2020; 73: 202–209.
- 24. Kunutsor SK, Apekey TA, Seddoh D, Walley J. Liver enzymes and risk of all-cause mortality in general populations: a systematic review and meta-analysis. Int J Epidemiol 2014; 43: 187–201.
- 25. Mahady SE, Wong G, Turner RM, et al. Elevated liver enzymes and mortality in older individuals a prospective cohort study. J Clin Gastroenterol 2017; 51: 439–445.
- 26. Australian Institute of Health and Welfare. Australia’s health 2018 (AIHW cat no. AUS 221; Australia’s health series no. 16). June 2018. https://www.aihw.gov.au/getmedia/8de32746-bc94-49e7-b803-0a7fac42b874/aihw-aus-221-chapter-1-2.pdf.aspx (viewed Feb 2021).
Abstract
Objectives: To investigate the prevalence of non‐alcoholic fatty liver disease (NAFLD) and its risk factors in regional Victoria.
Design: Prospective cross‐sectional observational study (sub‐study to CrossRoads II health study in Shepparton and Mooroopna).
Setting: Four towns (populations, 6300‒49 800) in the Goulburn Valley of Victoria.
Participants: Randomly selected from households selected from residential address lists provided by local government organisations for participation in the CrossRoads II study.
Main outcome measures: Age‐ and sex‐adjusted estimates of NAFLD prevalence, defined by a fatty liver index score of 60 or more in people without excessive alcohol intake or viral hepatitis.
Results: A total of 705 invited adults completed all required clinical, laboratory and questionnaire evaluations of alcohol use (participation rate, 37%); 392 were women (56%), and their mean age was 59.1 years (SD, 16.1 years). Of the 705 participants, 274 met the fatty liver index criterion for NAFLD (crude prevalence, 38.9%; age‐ and sex‐standardised prevalence, 35.7%). The mean age of participants with NAFLD (61 years; SD, 15 years) was higher than for those without NAFLD (58 years; SD, 16 years); a larger proportion of people with NAFLD were men (50% v 41%). Metabolic risk factors more frequent among participants with NAFLD included obesity (69% v 15%), hypertension (66% v 48%), diabetes (19% v 8%), and dyslipidaemia (63% v 33%). Mean serum alanine aminotransferase levels were higher (29 U/L; SD, 17 U/L v 24 U/L; SD, 14 U/L) and mean median liver stiffness greater (6.5 kPa; SD, 5.6 kPa v 5.3kPa; SD, 2.0 kPa) in participants with NAFLD.
Conclusion: The prevalence of NAFLD among adults in regional Victoria is high. Metabolic risk factors are more common among people with NAFLD, as are elevated markers of liver injury.