


The known: Assessing frailty in people who require community or institutional aged care is important, as it assists care planning and allows tailoring of services to individual needs.
The new: We developed a frailty index based on Australian Aged Care Assessment Program data. It provides a valid measure of frailty that predicts death and admission to permanent residential aged care.
The implications: Our frailty index can be used to adjust statistical analyses for frailty in studies of older people using aged care services in Australia. Further research will determine whether it can also support clinical and policy decision making.
Frailty is the consequence of cumulative declines in multiple physiological systems during life, resulting in impaired homeostasis and vulnerability to acute stressors.1 It is associated with adverse health outcomes, including falls, dependency, hospitalisation, and death.1,2 With timely interventions, the consequences of frailty can be ameliorated, and screening may identify risk and facilitate assistance that meets individual needs.3,4
A frailty index can be used to predict the risk of adverse health outcomes. Frailty index scores can be generated when comprehensive geriatric health assessments have been undertaken, especially if supported by electronic systems, as is the case in England for general practice.5
Since 2003, the care needs of frail older Australians have been comprehensively assessed in the multi‐disciplinary Aged Care Assessment Program (ACAP), assisting them gain access to appropriate care for improving their health and wellbeing.6 The assessment, completed by trained and certified assessors,7 does not specifically measure frailty, but the electronic record of the assessment could facilitate automated generation of a frailty index score. In our study, we accordingly developed and validated a frailty index based on ACAP data.
Methods
We constructed a frailty index based on de‐identified data for the historical cohort of the Registry of Senior Australians (ROSA)8,9 and conducted a retrospective cohort study. We analysed linked ACAP and community and residential aged care services data and National Death Index data included in the ROSA (obtained from the Australian Institute of Health and Welfare10). The ACAP dataset includes the demographic characteristics, service approvals, health conditions, and activity limitations of assessed older people collected in eligibility assessments by multidisciplinary Aged Care Assessment Teams (ACAT; in Victoria: Aged Care Assessment Services).
Study population
We analysed data for non‐Indigenous Australians aged 65 years or more and living in the community who had ACAT assessments during 1 July 2003 – 30 June 2013. We excluded data for people for whom data on Indigenous status, sex, or activity limitations were not available (Supporting Information, figure 1).
The frailty index
A total of 204 candidate variables (11 activity limitations, 162 health conditions, and 31 signs and symptoms) were initially selected for developing the frailty index, applying the approach described by Searle and colleagues.11 Briefly, variables were selected if they were associated with health deficits, the deficits increased in frequency with age but were not present in all older people, their overall prevalence in people aged 65 or more was 1–80%, and data on the variable were missing for fewer than 5% of the base population. Further, the variable set should encompass a broad range of physiological functions.11,12
To ensure that our final variable set was comprehensive and clinically relevant, the authors — who had expertise in geriatric medicine and gerontology, epidemiology, psychometrics, and aged care — conducted an initial screening, combined variables, and reviewed the final set. Of 11 activity limitations, community participation, transportation, and domestic assistance were omitted as they did not meet the inclusion criteria. The 162 health conditions were combined into 24 variables (for example, 12 cancer variables were combined into a single item), and 31 signs and symptoms into 12 variables. The final index included 44 variables: eight activity limitations, 24 health conditions, and 12 signs and symptoms (Supporting Information, table 1).
For each variable, the presence of a deficit was coded as 1, its absence as 0. The frailty index score was defined as the proportion of deficits for the 44 variables, expressed to two decimal places; for example, if nine deficits were identified, the frailty index score was 9/44 or 0.20. Participants were stratified into eight groups by frailty index score (0–0.35 by 0.05 point increments, and > 0.35).
Assessment of validity
Known‐group validity was assessed by comparing the distribution of frailty index scores with that of service approvals by accredited assessors. We anticipated that people with no or low level care approvals would have lower frailty scores than those approved for higher level care. Predictive validity was assessed by examining deaths and entry into permanent residential aged care as outcomes at one, three and five years after assessment. Deaths and permanent residential aged care data were obtained for the period 1 July 2003 – 30 June 2014 to ensure that follow‐up data for at least one year were available for each participant.
Statistical analysis
Group characteristics and frailty index score distribution are summarised as descriptive statistics. Mean and median frailty index scores are reported for the period 2003–2013 and by two‐year intervals (exceptions: the first [1 July 2003 – 31 December 2005] and final intervals [1 January 2012 – 30 June 2013]).
To assess known‐group validity, variation in frailty index score by level of permanent residential and community aged care package recommendations was examined in one‐way analyses of variance (ANOVAs). After ACAT assessments, people can be approved for community or permanent residential aged care packages, or for both. For residential aged care, participants were classified according to recommendation level (no approval, low level care, high level care). They were similarly classified for community aged care, whereby low level referred to Community Aged Care Packages and high level to Extended Aged Care at Home and Extended Aged Care at Home – Dementia packages.13 The distribution of frailty index scores by care level approvals was investigated overall and for three time intervals (2003–2006, 2007–2010, 2011–2013).
To assess predictive validity, cumulative survival probabilities for each frailty group are depicted in Kaplan–Meier curves. Univariate and age‐ and sex‐adjusted Cox proportional hazard models were fitted to assess associations between frailty index scores and mortality and entry into residential aged care, with the lowest frailty group (scores, 0–0.05) as reference. Hazard ratios (HRs) with 95% confidence intervals (CIs) are reported. Areas under the receiver operating characteristic curve (AUCs) were computed by randomly splitting the dataset into 80% testing and 20% validation samples; we fitted a Cox proportional hazard model including log‐age, sex, and frailty index score to the testing sample and computing the AUC for the validation sample. We assessed the stability of the predictive horizon of the index by estimating its prediction of death and admission to permanent residential aged care by year of assessment. Analyses were conducted in Stata MP 15.0 and R 3.5.2. P < 0.05 (two‐sided) was deemed statistically significant.
Ethics approval
This study was approved by the University of South Australia Human Research Ethics Committee (reference, 200489).
Results
The mean age of the 903 996 older people assessed was 82.0 years (standard deviation [SD], 7.0 years) and the median follow‐up time was 6.7 years (interquartile range, 3.5–8.4 years); 554 770 (61.4%) were women (Box 1). The mean age of the assessed women (82.6 years; SD, 6.9 years) was higher than for the men (81.2 years; SD, 7.0 years).
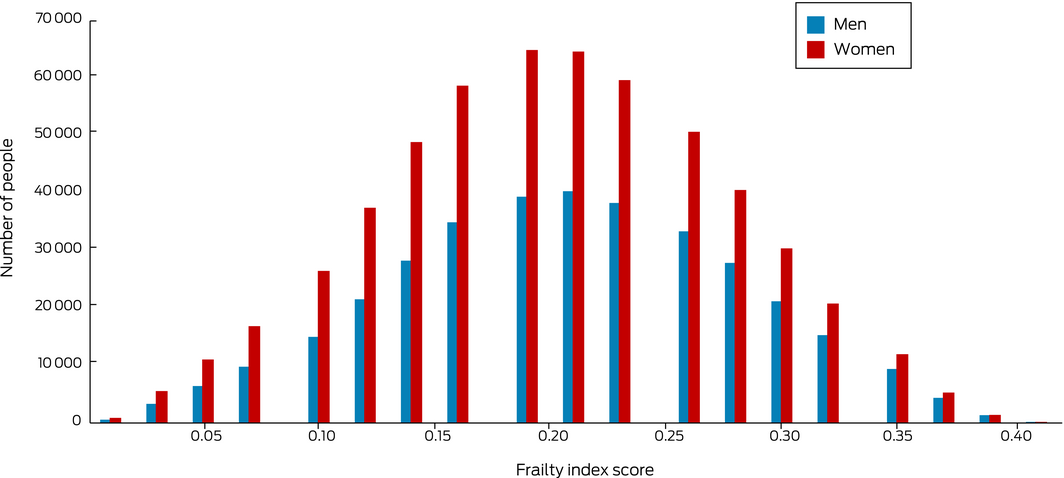
The overall mean frailty index score was 0.20 (SD, 0.07; range, 0–0.41), and the distribution of scores was (on visual inspection) close to normal (Box 2). The mean frailty index score increased from 0.16 (SD, 0.07) in 2003–2005 to 0.24 (SD, 0.07) in 2012–2013; the number of people with scores of 0.10 or less declined from 43 520 (19.6%) to 3810 (2.8%), while the number with scores exceeding 0.20 increased from 71 404 (32.1%) to 102 757 (75.0%) (Box 1).
Deficit prevalence was lowest for speech and voice disturbances (14 102 people; 1.6%) and highest for activity limitations related to meals (696 054 people; 77.0%) (Supporting Information, table 1).
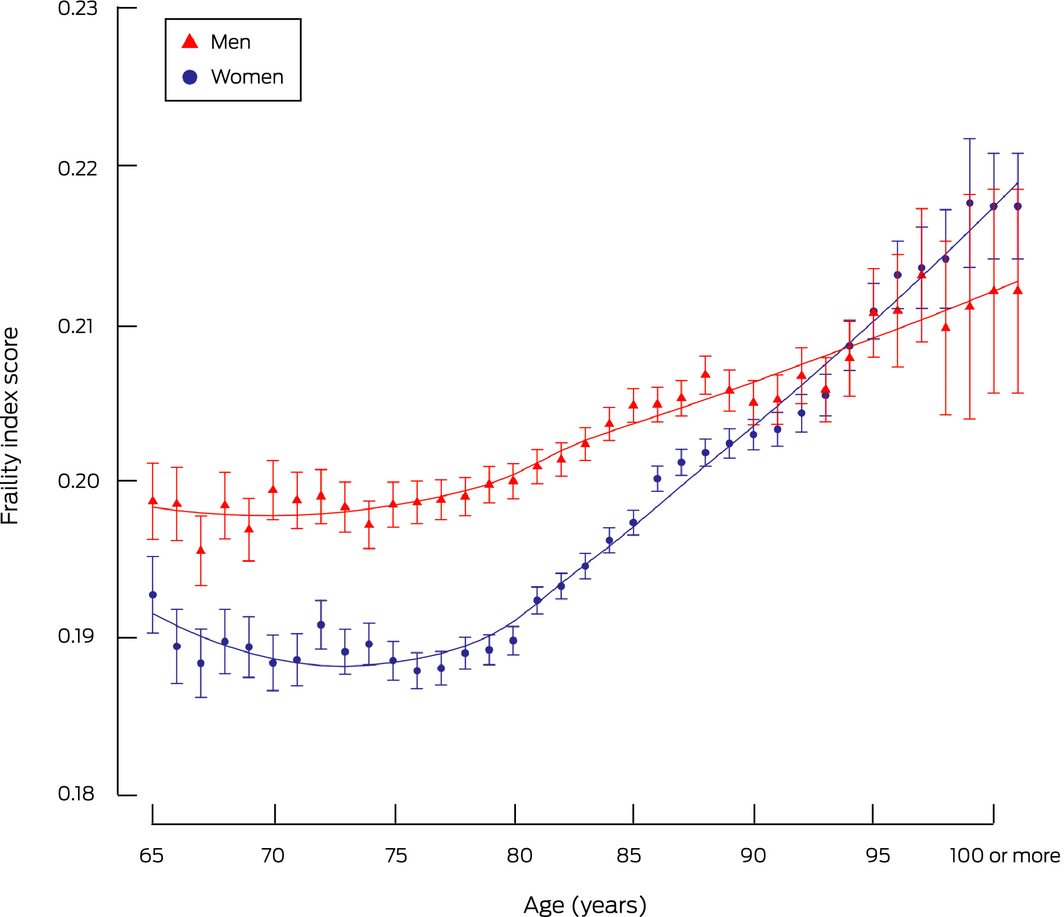
Mean frailty index score increased with age for both sexes beyond age 80 years, with a steeper increase for women. Until the age of 92 years, the mean frailty index score was higher for men than for women; from the age of 93 years, the difference between sexes in mean frailty index score was not statistically significant (Box 3). A larger proportion of men than women had carers at the time of their ACAT assessments during 2003–2004 to 2009–2010, but the proportions were similar thereafter (Supporting Information, figure 2).
Frailty index score and subsidised care approvals
Of 664 455 older people assessed for permanent residential aged care packages, 190 538 (29%) had no approvals (mean frailty index score, 0.18; SD, 0.08), 272 641 (41%) had approvals for low level care (mean score, 0.19; SD, 0.07), and 201 276 (30%) had approvals for high level care (mean score, 0.24; SD, 0.07). The mean frailty index score differed between groups (both: P < 0.001) (Supporting Information, figure 3 and table 2). Of 309 347 older people assessed for community care packages, 190 538 (62%) had no approvals (mean frailty index score, 0.18; SD, 0.08), 109 959 (35%) had low level care approvals (mean score, 0.20; SD, 0.06) and 8850 (3%) had high level care approvals (mean score, 0.26; SD, 0.06). The mean frailty index score differed between groups (both: P < 0.001) (Supporting Information, figure 4 and table 2). For both permanent residential and community aged care, the distribution of frailty index scores conformed with the assessors’ determination of service needs levels (Supporting Information, figures 3 and 4).
Frailty index score and deaths and entry into permanent residential care
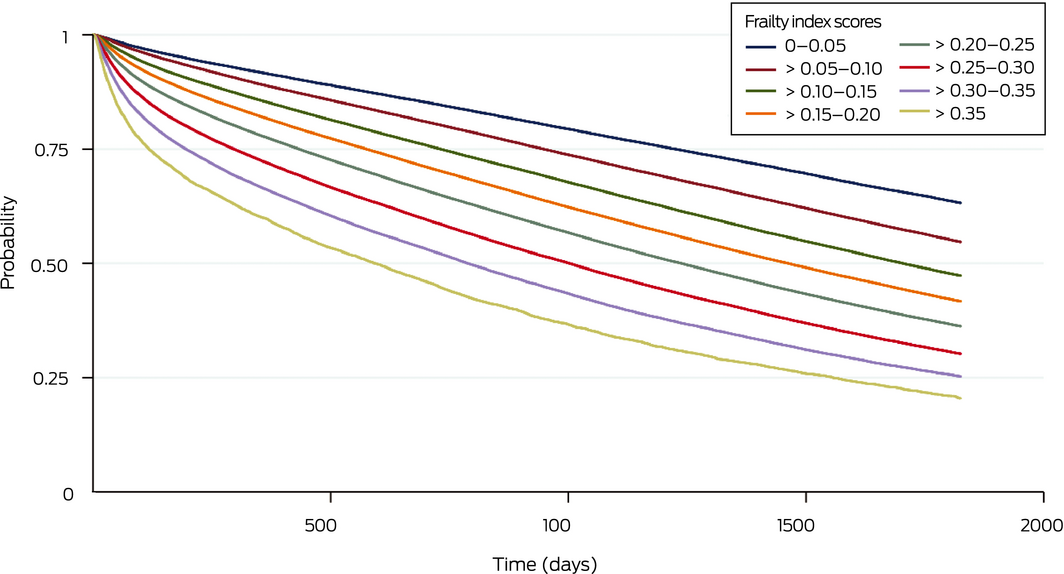
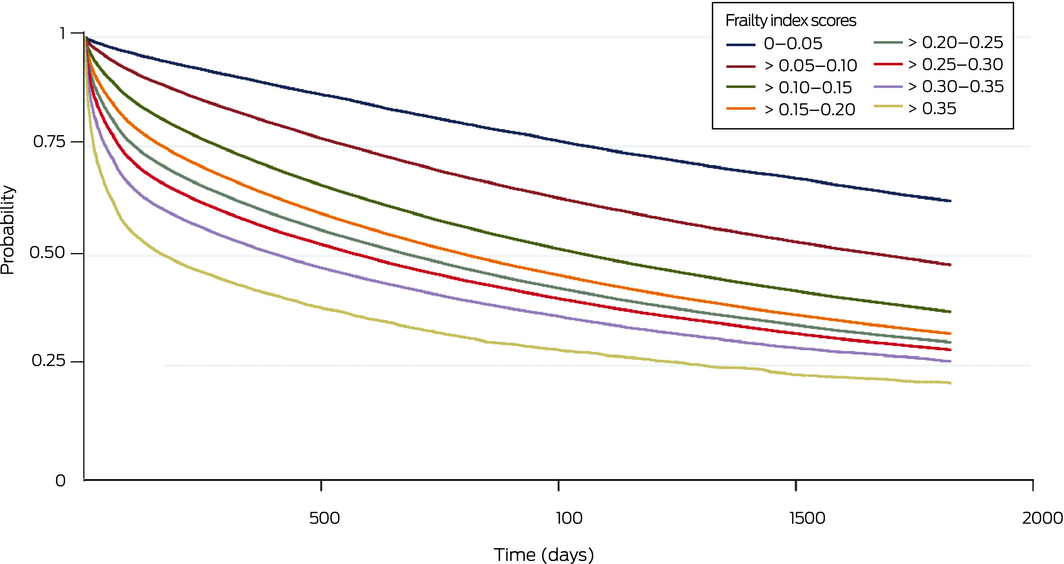
Within five years of their eligibility assessments, 555 519 older people (61.5%) had died and 480 081 (53.1%) had entered permanent residential aged care. Higher frailty index scores were associated with lower survival (Box 4) and reduced probability of not entering permanent residential aged care (Box 5) at one, three and five years after assessment (Box 6). The predictive ability of the frailty index with respect to death was greater in a model that included frailty index score, age and sex than in one including only age and sex (one year: AUC, 0.64 [95% CI, 0.63–0.64] v 0.59 [95% CI, 0.59–0.60]; three years: AUC, 0.66 [95% CI, 0.66–0.66] v 0.63 [95% CI, 0.62–0.63]; five years: AUC, 0.67 [95% CI, 0.67–0.68] v 0.64 [95% CI, 0.64–0.65]) (Supporting Information, figure 5). The predictive horizon was similar across the study period (Supporting Information, table 3).
The predictive ability of the frailty index with respect to entry into residential aged care was also higher for a model that included frailty index scores than for one including only age and sex (one year: AUC, 0.63 [95% CI, 0.62–0.63] v 0.57 [95% CI, 0.57–0.58]; three years: AUC, 0.63 [95% CI, 0.63–0.63] v 0.60 [95% CI, 0.59–0.60]; five years: AUC, 0.63 [95% CI, 0.63–0.64] v 0.61 [95% CI, 0.61–0.62]) (Supporting Information, figure 6). The predictive horizon was similar across the study period (Supporting Information, table 4).
Discussion
We generated a frailty index from data routinely collected during aged care eligibility assessments in Australia. Identifying frailty when assessing eligibility for aged care could identify risk and help guide goal setting and care planning processes, complementing clinical judgment, individual choice, and shared decision making.2 Further research is needed to determine the clinical value of the index, but it will be useful for research studies based on national aged care data. For the ROSA, the measure will be used to adjust analyses for confounding by frailty.
We found that mean frailty index scores for people for whom aged care services were approved increased during 2003–2013. Older people are choosing to remain in their own homes longer; consequently, the proportion with high level care needs entering aged care increased fourfold between 2009 (13%) and 2018 (53%).14,15 While the number of home care packages provided by the Australian government to support older people living at home has increased, demand continues to exceed supply. During 2005–2006, 7% of aged care recipients had waited longer than nine months for home care packages.16 In December 2019, more than one hundred thousand people were in the national prioritisation queue, on which waiting times can exceed 12 months, including 56.4% who had or were assigned lower level home care packages.17
The maximum frailty index score in our study was lower than reported by other studies applying measures based on the same cumulative deficit approach.5,18,19 This might be attributed to the fact that a maximum of ten health conditions and eleven activity limitations (eight of which were included in our index) can be recorded during ACAT data collection. This limitation would have little impact on our frailty index scores, as we estimated that only 2.9% of assessments could result in more than ten health conditions being recorded (data not shown). Additionally, the items included in our index may be more serious health conditions than those in other population‐based studies.5,18,19 Importantly, while the range of frailty scores was narrower than in other studies, our measure predicted survival probability well.
In contrast to other studies,11,20 we found that frailty scores were higher for men than women under 93 years of age. Men may be more likely than older women to be cared for by spouses or other relatives, deferring the need for formal aged care and therefore increasing their relative frailty when they are assessed; this difference also highlights the social importance of informal caregivers.21,22 Changes in score by sex beyond this age were subject to greater random variation than for younger participants because the sample sizes were small; only 14 837 men [1.6%] and 36 207 women [4%] were aged 93 years or more.
Including frailty index scores improved the predictive ability of statistical models for predicting mortality and entry into permanent residential aged care based on age and sex, as also reported for other indices.5,18,23,24 However, overall predictive ability was only moderate, as with that of other prediction models, such as the cardiac risk index.19 While age and sex influence the risks of adverse events, they are not modifiable factors, whereas identifying frailty could lead to appropriate interventions. The association of index scores with all‐cause mortality and admission to residential aged care, independent of chronological age, supports the value of the frailty index as a measure of health in older people.
Given the increasing frailty of people receiving aged care, our index could be used to identify people at high risk, who could receive targeted interventions to delay admitting them to residential care. Clinical trials have found that specific interventions for frail older people can be beneficial.25 The Australian aged care eligibility guidelines have recently been revised and now include the same mandatory data elements we used for our frailty index.26 Our index could therefore be directly employed in aged care in Australia.
Frailty index scores in our study broadly matched assessors’ determination of service needs levels, supporting the reliability of the index. Further, the predictive power of the index with respect to death and admission to residential aged care was similar across the study period, suggesting that it is sensitive to changes in care service use by our ageing population. Further research is needed to determine its predictive validity for other health outcomes, such as hospitalisation. Cut‐offs for classifying frailty levels specific to this population also need to be established.
Strengths and limitations
One strength of our frailty index is that it was based on a rich data resource, collected by trained, nationally accredited staff during eligibility assessments of older people seeking subsidised aged care support in Australia. While findings from this study are generalisable to the population of older Australians seeking aged care, they may not be generalisable to the wider population. Further, frailty scores derived with the accumulation deficit methodology we employed does not allow weighting of variables according to their clinical and personal significance. We found in a separate study with the same cohort that the weighted frailty measure predicted death better than in this investigation, and predicted entry into permanent residential aged care with similar precision.27
Conclusion
We derived our frailty index from aged care eligibility data routinely collected as part of the national Aged Care Assessment Program. Frailty scores could be electronically calculated, and therefore support assessment of the risk of vulnerability, during the 180 000 eligibility assessments performed each year. The frailty index can be employed by researchers to adjust analyses of national aged care data for frailty. The identification of frailer groups at higher risk in this population supports the need for further investigations of novel models of care and interventions for preventing the poor outcomes associated with frailty.
Box 1 – Characteristics of 903 996 participating older people and frailty index scores, 2003–2013
|
|
All |
2003–2005 |
2006–2007 |
2008–2009 |
2010–2011 |
2012–2013 |
|||||||||
|
|
|||||||||||||||
|
Number of people |
903 996 |
222 355 |
194 873 |
176 082 |
173 663 |
137 023 |
|||||||||
|
Age (years), mean (SD) |
82.0 (7.0) |
82.2 (7.0) |
82.1 (7.0) |
81.9 (7.0) |
81.9 (7.0) |
81.9 (7.2) |
|||||||||
|
Sex (women) |
554 770 (61.4%) |
143 134 (64.4%) |
121 189 (62.2%) |
107 151 (60.8%) |
103 084 (59.4%) |
80 212 (58.5%) |
|||||||||
|
Frailty index score |
|
|
|
|
|
|
|||||||||
|
Mean (SD) |
0.20 (0.07) |
0.16 (0.07) |
0.18 (0.07) |
0.20 (0.07) |
0.23 (0.07) |
0.24 (0.07) |
|||||||||
|
Median (IQR) |
0.20 (0.14–0.25) |
0.16 (0.11–0.20) |
0.18 (0.14–0.23) |
0.20 (0.16–0.25) |
0.23 (0.18–0.27) |
0.25 (0.18–0.30) |
|||||||||
|
Maximum |
0.41 |
0.41 |
0.41 |
0.41 |
0.41 |
0.41 |
|||||||||
|
99th percentile |
0.36 |
0.32 |
0.34 |
0.36 |
0.36 |
0.36 |
|||||||||
|
Frailty score group |
|
|
|
|
|
|
|||||||||
|
0.00–0.05 |
27 398 (3.0%) |
13 858 (6.2%) |
7307 (3.8%) |
3871 (2.2%) |
1587 (0.91%) |
775 (0.57%) |
|||||||||
|
> 0.05–0.10 |
67 734 (7.5%) |
29 662 (13.3%) |
18 747 (9.6%) |
10 626 (6.0%) |
5664 (3.3%) |
3035 (2.2%) |
|||||||||
|
> 0.10–0.15 |
135 785 (15.0%) |
50 011 (22.5%) |
36 313 (18.6%) |
24 273 (13.8%) |
15 742 (9.1%) |
9446 (6.9%) |
|||||||||
|
> 0.15–0.20 |
197 578 (21.9%) |
57 420 (25.8%) |
48 923 (25.1%) |
38 997 (22.1%) |
31 228 (17.9%) |
21 010 (15.3%) |
|||||||||
|
> 0.20–0.25 |
202 586 (22.4%) |
41 889 (18.8%) |
43 313 (22.2%) |
42 452 (24.1%) |
42 561 (24.5%) |
32 371 (23.6%) |
|||||||||
|
> 0.25–0.30 |
203 468 (22.5%) |
25 135 (11.3%) |
32 768 (16.8%) |
42 315 (24.0%) |
54 748 (31.5%) |
48 502 (35.4%) |
|||||||||
|
> 0.30–0.35 |
57 090 (6.3%) |
3730 (1.7%) |
6393 (3.3%) |
11115 (6.3%) |
18 057 (10.4%) |
17 795 (12.9%) |
|||||||||
|
> 0.35 |
12 357 (1.4%) |
650 (0.29%) |
1109 (0.57%) |
2433 (1.4%) |
4076 (2.4%) |
4089 (3.0%) |
|||||||||
|
|
|||||||||||||||
|
IQR = interquartile range; SD = standard deviation. |
|||||||||||||||
Box 3 – Frailty index scores for 903 996 older people, 2003–2013: mean scores (with 95% confidence intervals), by age and sex
Box 4 – Cumulative survival probability for 903 996 study participants, by frailty index score group
Box 5 – Cumulative probability of not having entered permanent residential aged care for 903 996 study participants, by frailty index score group
Box 6 – Age‐ and sex‐adjusted risk of death and entry into permanent residential aged care for 903 996 study participants, by frailty index score group
|
Frailty group |
Hazard ratio (95% confidence interval) |
||||||||||||||
|
Death |
Entry into permanent residential aged care |
||||||||||||||
|
1 year |
3 years |
5 years |
1 year |
3 years |
5 years |
||||||||||
|
|
|||||||||||||||
|
0–0.05 |
1 |
1 |
1 |
1 |
1 |
1 |
|||||||||
|
> 0.05–0.10 |
1.34 (1.27–1.40) |
1.31 (1.27–1.35) |
1.29 (1.26–1.32) |
1.86 (1.78–1.93) |
1.59 (1.55–1.64) |
1.51 (1.47–1.55) |
|||||||||
|
> 0.10–0.15 |
1.99 (1.91–2.08) |
1.81 (1.76–1.86) |
1.72 (1.68–1.76) |
2.99 (2.87–3.11) |
2.28 (2.22–2.34) |
2.06 (2.01–2.10) |
|||||||||
|
> 0.15–0.20 |
2.68 (2.56–2.80) |
2.30 (2.24–2.36) |
2.13 (2.08–2.17) |
3.87 (3.72–4.02) |
2.76 (2.69–2.83) |
2.45 (2.40–2.50) |
|||||||||
|
> 0.20–0.25 |
3.22 (3.08–3.37) |
2.67 (2.60–2.74) |
2.44 (2.28–2.49) |
4.52 (4.34–4.69) |
3.08 (3.01–3.16) |
2.72 (2.66–2.78) |
|||||||||
|
> 0.25–0.30 |
3.83 (3.66–4.00) |
3.07 (3.05–3.08) |
2.78 (2.72–2.84) |
5.17 (4.97–5.38) |
3.42 (3.33–3.51) |
3.00 (2.94–3.07) |
|||||||||
|
>0.30–0.35 |
4.74 (4.53–4.96) |
3.70 (3.60–3.81) |
3.32 (3.24–3.39) |
6.30 (6.05–6.56) |
4.05 (3.95–4.17) |
3.54 (3.46–3.63) |
|||||||||
|
> 0.35 |
5.99 (5.69–6.31) |
4.54 (4.38–4.70) |
4.03 (3.91–4.15) |
8.70 (8.32–9.11) |
5.47 (5.29–5.65) |
4.76 (4.61–4.90) |
|||||||||
|
|
|||||||||||||||
|
|
|||||||||||||||
Received 30 August 2019, accepted 16 April 2020
- Jyoti Khadka1,2,3
- Renuka Visvanathan4,5,6
- Olga Theou6,7
- Max Moldovan1
- Azmeraw T Amare1
- Catherine Lang1
- Julie Ratcliffe1,3
- Steven L Wesselingh1
- Maria C Inacio1,8
- 1 Registry of Senior Australians, South Australian Health and Medical Research Institute, Adelaide, SA
- 2 UniSA Business School, University of South Australia, Adelaide, SA
- 3 Caring Future Institute, Flinders University, Adelaide, SA
- 4 Adelaide Geriatrics Training and Research with Aged Care (G‐TRAC) Centre, University of Adelaide, Adelaide, SA
- 5 NHMRC Centre of Research Excellence in Frailty and Healthy Ageing, Adelaide, SA
- 6 Basil Hetzel Institute, Central Adelaide Local Health Network, Adelaide, SA
- 7 Dalhousie University, Halifax, Nova Scotia, Canada
- 8 Sansom Institute for Health Research, University of South Australia, Adelaide, SA
The South Australian Department for Innovation and Skills supported this investigation (2017–2021). We acknowledge the Healthy Ageing Research Consortium investigator team and the Registry of Senior Australians (ROSA) South Australian Health and Medical Research Institute research team for ensuring the success of the ROSA and for supporting this study, and the Australian Institute of Health and Welfare for providing data to the ROSA.
No relevant disclosures.
- 1. Clegg A, Young J, Iliffe S, et al. Frailty in elderly people. Lancet 2013; 381: 752–762.
- 2. Hippisley‐Cox J, Coupland C. Development and validation of QMortality risk prediction algorithm to estimate short term risk of death and assess frailty: cohort study. BMJ 2017; 358: j4208.
- 3. Thompson MQ, Theou O, Adams RJ, et al. Frailty state transitions and associated factors in South Australian older adults. Geriatr Gerontol Int 2018; 18: 1549–1555.
- 4. Ambagtsheer RC, Beilby JJ, Visvanathan R, et al. Should we screen for frailty in primary care settings? A fresh perspective on the frailty evidence base: a narrative review. Prev Med 2019; 119: 63–69.
- 5. Clegg A, Bates C, Young J, et al. Development and validation of an electronic frailty index using routine primary care electronic health record data. Age Ageing 2016; 45: 353–360.
- 6. Australian Department of Social Services. Aged care assessment programme guidelines. May 2015. Archived: https://web.archive.org/web/20190304201426/https://agedcare.health.gov.au/sites/g/files/net1426/f/documents/05_2015/acap_guidelines_-_accessible_version_-_may_2015_0.pdf (viewed May 2019).
- 7. Australian Department of Health. Aged care assessment workforce (RAS and ACAT): My Aged Care system and process overview. Feb 2018. https://www.health.gov.au/resources/publications/my-aged-care-process-overview-aged-care-assessment-workforce-ras-and-acat (viewed June 2019).
- 8. Inacio MC, Bray SCE, Whitehead C, et al. The Registry of Older South Australians (ROSA): framework and plan. BMJ Open 2019; 9: e026319.
- 9. Harrison SL, Lang C, Whitehead C, et al. Trends in prevalence of dementia for people accessing aged care services in Australia. J Gerontol A Biol Sci Med Sci 2020; 75: 318–325.
- 10. Australian Institute of Health and Welfare. Aged care assessment program data dictionary, version 1.0 (Cat. no. AGE 26). Canberra: AIHW, 2002.
- 11. Searle SD, Mitnitski A, Gahbauer EA, et al. A standard procedure for creating a frailty index. BMC Geriatr 2008; 8: 24.
- 12. Amblàs‐Novellas J, Martori JC, Espaulella J, et al. Frail‐VIG index: a concise frailty evaluation tool for rapid geriatric assessment. BMC Geriatr 2018; 18: 29.
- 13. Australian Department of Health and Ageing. Home care packages program guidelines. Aug 2013. https://www.dss.gov.au/sites/default/files/documents/03_2014/home_care_packages_program_guidelines_-_10_july_2013.docx (viewed Dec 2019).
- 14. Australian Institute of Health and Welfare. People's care needs in aged care (GEN fact sheet 2017–18). 2019. https://www.gen-agedcaredata.gov.au/www_aihwgen/media/2018-factsheets/People-s_care_needs_in_aged_care_factsheet_2017-18.pdf (viewed Dec 2019).
- 15. Khadka J, Lang C, Ratcliffe J, et al. Trends in the utilisation of aged care services in Australia, 2008–2016. BMC Geriatr 2019; 19: 213.
- 16. Low LF, Brodaty H. Access and limitations of community services for older persons: a guide for the GP. Aust Fam Physician 2008; 37: 431–436.
- 17. Australian Department of Health. Home care packages program: data report 2nd quarter 2019–20, 1 October – 31 December 2019. Apr 2020. https://gen-agedcaredata.gov.au/www_aihwgen/media/Home_care_report/HCP-Data-Report-2019%e2%80%9320-2nd-Qtr.pdf (viewed July 2020).
- 18. Orkaby AR, Nussbaum L, Ho YL, et al. The burden of frailty among US veterans and its association with mortality, 2002–2012. J Gerontol A Biol Sci Med Sci 2019; 74: 1257–1264.
- 19. Hubbard RE, Peel NM, Samanta M, et al. Derivation of a frailty index from the interRAI acute care instrument. BMC Geriatr 2015; 15: 27.
- 20. Gordon EH, Peel NM, Samanta M, et al. Sex differences in frailty: a systematic review and meta‐analysis. Exp Gerontol 2017; 89: 30–40.
- 21. Stacey AF, Gill TK, Price K, et al. Unpaid informal caregivers in South Australia: population characteristics, prevalence and age‐period‐cohort effects 1994–2014. PLoS One 2016; 11: e0161994.
- 22. Smith JA, Braunack‐Mayer A, Wittert G. What do we know about men's help‐seeking and health service use? Med J Aust 2006; 184: 81–83. https://www.mja.com.au/journal/2006/184/2/what-do-we-know-about-mens-help-seeking-and-health-service-use.
- 23. Rockwood K, Mitnitski A. Frailty in relation to the accumulation of deficits. J Gerontol A Biol Sci Med Sci 2007; 62: 722–727.
- 24. Andersson C, Wissenberg M, Jørgensen ME, et al. Age‐specific performance of the revised cardiac risk index for predicting cardiovascular risk in elective noncardiac surgery. Circ Cardiovasc Qual Outcomes 2015; 8: 103–108.
- 25. Cameron ID, Fairhall N, Langron C, et al. A multifactorial interdisciplinary intervention reduces frailty in older people: randomized trial. BMC Med 2013; 11: 65.
- 26. Australian Department of Health. My Aged Care: national screening and assessment form user guide. Oct 2018. https://www.health.gov.au/resources/publications/my-aged-care-national-screening-and-assessment-form-user-guide (viewed Oct 2019).
- 27. Moldovan M, Khadka J, Visvanathan R, et al. Using elastic nets to estimate frailty burden from routinely collected national aged care data. J Am Med Inform Assoc 2020; 27: 419–428.
Abstract
Objectives: To develop and validate a frailty index, derived from aged care eligibility assessment data.
Design: Retrospective cohort study; analysis of the historical national cohort of the Registry of Senior Australians (ROSA).
Participants: 903 996 non‐Indigenous Australians aged 65 years or more, living in the community and assessed for subsidised aged care eligibility during 2003–2013.
Main outcome measures: 44‐item frailty index; summary statistics for frailty index score distribution; predictive validity with respect to mortality and entry into permanent residential aged care during the five years after assessment.
Results: The mean frailty index score during 2003–2013 was 0.20 (SD, 0.07; range, 0–0.41); the proportion of assessed older people with scores exceeding 0.20 increased from 32.1% in 2003–2005 to 75.0% in 2012–2013. The risks of death and entry into permanent residential aged care at one, three and five years increased with frailty index score level (at one year, high [over 0.35] v low scores [under 0.05]: hazard ratio for death, 5.99; 95% CI, 5.69–6.31; for entry into permanent residential aged care, 8.70; 95% CI, 8.32–9.11). The predictive validity (area under the receiver operating characteristic curve) of Cox proportional hazard models including age, sex, and frailty index score was 0.64 (95% CI, 0.63–0.64) for death and 0.63 (95% CI, 0.62–0.63) for entry into permanent residential aged care within one year of assessment.
Conclusions: We used Australian aged care eligibility assessment program data to construct and validate a frailty index. It can be employed in aged care research in Australia, but its application to aged care planning requires further investigation.