


The known: Exposure to chronic air pollution during early life is associated with increased likelihood of later respiratory dysfunction. Information about longer term health outcomes following time‐limited episodes of air pollution, however, is scarce.
The new: In utero exposure to a severe smoke event was associated with increased parental reports of respiratory infections and wheeze 2–4 years later. In utero exposure had a greater impact on long term respiratory health than early childhood exposure.
The implications: Episodic severe smoke events are common in Australia and elsewhere. Protecting pregnant women and young children should be central to public health responses to poor air quality.
In February 2014, the Hazelwood coalmine fire exposed a large number of people in the Latrobe Valley of Victoria to high levels of air pollution for six weeks.1 In the southern part of Morwell, less than 1 km from the fire, the 24‐hour average concentration of fine particulate matter with an aerodynamic diameter of less than 2.5 μm (PM2.5) was higher than the national air quality standard (25 μg/m3) on 23 days; it occasionally exceeded 800 μg/m3.2 The event caused considerable local concern about the short and long term consequences of such exposure.
Exposure to air pollution in utero and during early childhood is associated with respiratory‐related infant death, childhood asthma and wheezing,3,4 respiratory infections,5 and poorer lung function in later childhood.6,7,8 A role for early childhood exposure to air pollution in the development of atopic dermatitis has also been proposed.9,10,11 However, distinguishing between the effects of pre‐ and postnatal exposure is difficult.
Compared with the body of evidence for the health effects of long term exposure to ambient air pollution, information about the impact of short duration pollution events, such as wildfires, is limited. Nevertheless, associations with all‐cause mortality, exacerbation of asthma and chronic obstructive pulmonary disease, and medication use for obstructive lung disease have been reported.12 The evidence for effects on respiratory infections is less conclusive, but associations with bronchitis and pneumonia have been suggested.12 Even less is known about the effects of short duration events on children and their longer term health.
We analysed data collected by the Latrobe Early Life Follow‐up (ELF) Study, a component of the Hazelwood Health Study,13 to evaluate associations between the magnitude of coal fire smoke exposure during early life and parent‐reported indicators of respiratory and atopic illness. Understanding the effects of the Hazelwood coalmine fire will further our general understanding of the longer term impact of severe episodic smoke events. The toxic components of outdoor air pollution from forest and peat fires are similar to those of coalmine fire smoke, and their effects on health may be similar.14
Methods
Study design and population
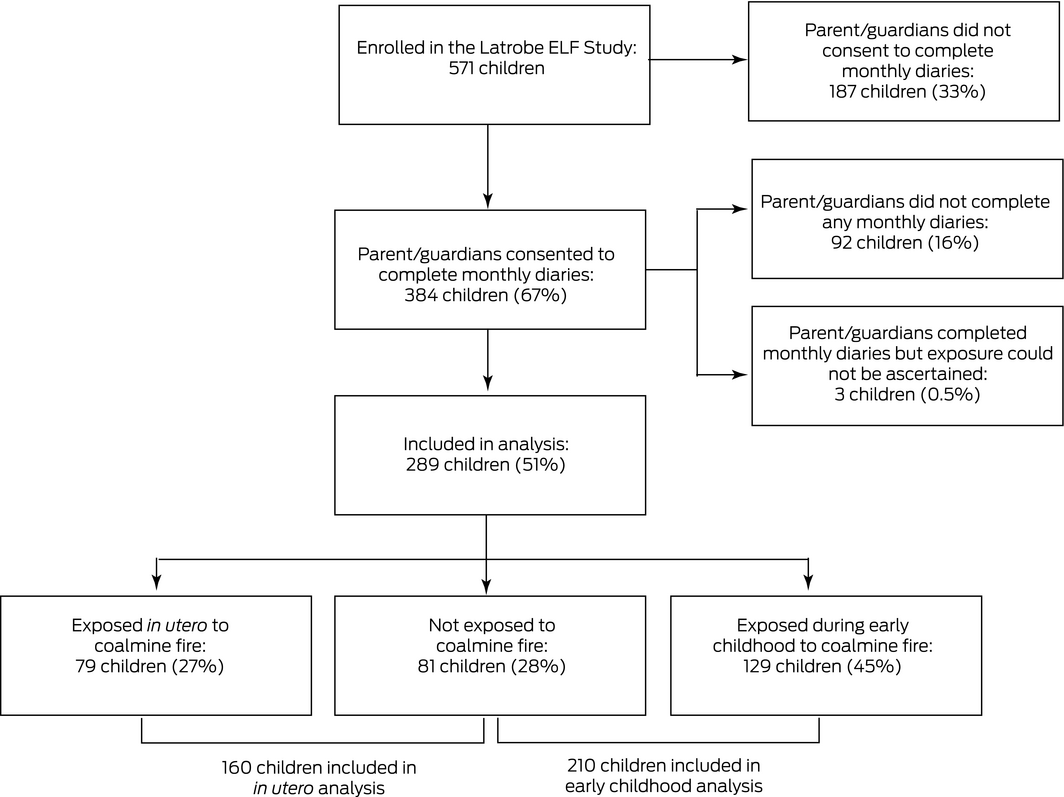
The Latrobe ELF cohort was established during 2015 to prospectively follow the health of Latrobe Valley children exposed to smoke from the Hazelwood coalmine fire during their first 1000 days of life.13 Potential participants were identified by stratified random sampling of a nominal roll generated by Latrobe City Council, based on their Maternal Child Health Service records of age‐eligible children.13 After reviewing comparable studies of environmental exposures and health outcomes and taking into consideration the expected loss to follow‐up during our study, an overall sample size of 500 children was deemed appropriate for identifying important health effects. The parents of 571 of 3371 eligible children consented to participation (110% of target). We defined three groups of children:
- early childhood exposure: children less than two years old at the end of the fire period (date of birth: 1 March 2012 – 31 March 2014);
- in utero exposure: children born to mothers pregnant during the fire (date of birth: 1 April 2014 – 31 December 2014); and
- unexposed: children conceived after the fire (date of birth: 1 January 2015 – 31 December 2015).
Data collection: health outcomes
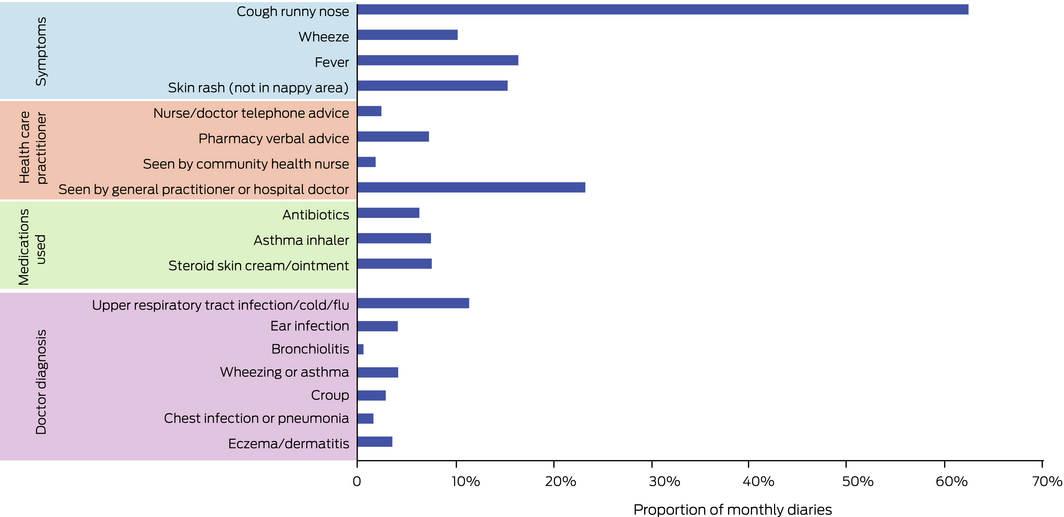
Between June 2016 and October 2018 (that is, 2–4 years after the fire), we sent participating parents monthly text messages with a link to an online survey (health outcomes diary) that collected information about symptoms during the preceding calendar month (runny nose, cough, wheeze, fever, or rash not in the nappy area), contacts with health care providers (by telephone with doctors or nurses; in person with pharmacists, child health nurses, general practitioners or local doctors, or hospital‐based doctors), the use of oral antibiotics, asthma inhalers (relievers or preventers), and topical steroid‐containing creams or ointments, and diagnoses by doctors of upper respiratory tract infections, colds or flu, ear infections, eczema or dermatitis, chest infections, bronchiolitis, wheezing, and asthma.
Data collection: exposure
The exposure period was 9 February – 31 March 2014 (51 days). Although the fire was declared safe on 26 March 2014, low level smoke emissions continued into the following week. During June – December 2016, participating parents completed questionnaires about their daily location (day and night) during the fire period. We estimated individual exposure to smoke by mapping the 12‐hourly reported geographic locations of each child or pregnant mother during the fire period to a high resolution exposure model of mine fire‐attributable PM2.5 concentration (resolution: one hour and one square kilometre).2 We then derived two exposure variables for each child:
- mean daily fire‐attributable PM2.5 exposure during the 51‐day period; and
- peak 24‐hour fire‐attributable PM2.5 exposure during the fire period, taking into account the exposure time for each child.
The full exposure model included background PM2.5 from natural sources, vehicular and power station emissions, landscape fires, and the mine fire. The difference in exposure between running the model with and without the mine fire emissions was defined as fire‐attributable PM2.5 exposure. Modelled PM2.5 estimates were analysed because the number of monitoring stations in the affected area was insufficient for direct estimation.
Children conceived after the fire were assigned mean daily and peak 24‐hour PM2.5 values of zero. Children born during the fire period (that is, exposed both in utero and during early childhood) were assigned to the early childhood exposure group, with exposure estimates based solely on their postnatal exposure.
Data collection: covariates
We collected data on socio‐demographic, medical, household, and environmental tobacco smoke exposure in a survey during June – December 2016.13 Tobacco smoke exposure was defined as the presence of a current smoker in the child's household or exposure to tobacco in utero. Background annual NO2 exposure was derived by mapping participants’ residential addresses during the first year of life15 to a satellite‐based land use regression model by Australian 2011 census mesh block.16 The Australian Index of Relative Socioeconomic Disadvantage (IRSD) deciles for participants’ residential addresses during the first year of life, by Statistical Areas level 1 (2011), were obtained from the Australian Bureau of Statistics.17
Data analysis
Exposure estimates are reported as medians with interquartile ranges (IQRs). We separately examined the association between the magnitude of PM2.5 exposure and parent‐reported monthly diary outcomes (binary outcomes: yes v no) for the in utero and early childhood exposure groups in modified mixed effects Poisson regression models, with participant as a random effect. We used a robust estimator of variance to avoid overestimating parameter estimate standard errors. To minimise the likelihood of sparse data causing spurious results, only outcomes that were reported in at least 5% of diaries were included in our models.
We selected potential confounding factors for inclusion according to reported evidence18,19,20,21,22,23,24 and a directed acyclic graph prepared with DAGitty 2.3.25 Covariates included in the model were age, sex, tobacco smoke exposure, mother's level of education, unflued gas heating or a gas stovetop in the house, background annual NO2 level, socio‐economic status (IRSD decile), and season of diary report.
We report the relative risk (RR) per 10 μg/m3 increase in mean daily fire‐attributable PM2.5 exposure, and per 100 μg/m3 increase in peak 24‐hour fire‐attributable PM2.5 exposure, with 95% confidence intervals (CIs). In sensitivity analyses, we tested the influence of restricting analysis to children exposed in utero or during early childhood (ie, excluding the unexposed group), and of excluding children who were exposed both in utero and during early childhood from the early childhood analysis.
We assessed potential selection bias by comparing the socio‐demographic characteristics of participants and non‐participants in the Latrobe ELF cohort in χ2 and independent sample t tests.
We performed all statistical analyses in Stata/SE 15.0.
Ethics approval
Our study was approved by the Tasmanian Health and Medical Research Ethics Committee (reference, H14875). Written informed consent was obtained from the parents or guardians of all participating children.
Results
Of the 571 children enrolled in the ELF cohort, 289 (51%) participated in the study reported in this article (Box 1). PM2.5 exposure estimates were lower for participants than non‐participants in the cohort (mean daily exposure: median, 2.8 μg/m3; IQR, 1.6–9.0 μg/m3 v 4.8 μg/m3; IQR, 2.0–12.8 μg/m3; peak 24‐hour exposure: 76.4 μg/m3; IQR, 41.6–150 μg/m3 v 104 μg/m3; IQR, 59.4–181 μg/m3). The mean age of participating mothers was higher than for non‐participating mothers (29.6 years; standard deviation [SD], 5.0 years v 27.5 years; SD, 5.7 years) and a larger proportion had had post‐secondary education (70% v 40%); larger proportions of the participating children had been breastfed (92% v 80%) and had not been exposed to smoking in utero (12% v 24%) or during early childhood (20% v 33%) (Supporting Information, table 1).
Socio‐demographic, medical and smoke exposure characteristics
Most participants (58%) resided in areas in the two lowest IRSD quintiles. Larger proportions of children in the early childhood exposure group had siblings, attended childcare, and had asthma diagnoses than in the other two groups, probably reflecting their higher mean age (Box 2).
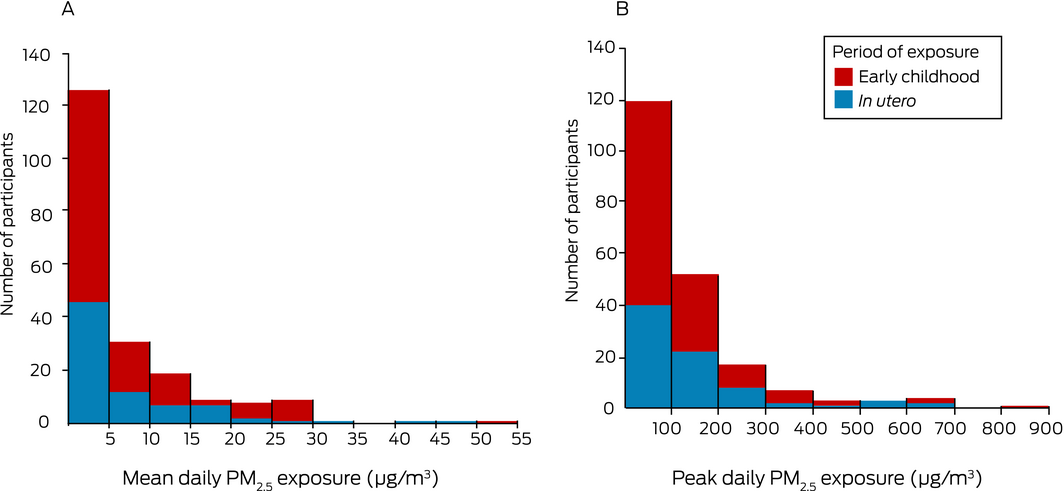
Median coalmine fire‐attributable PM2.5 exposure was slightly higher in the in utero than in the early childhood exposure group with respect to both mean daily PM2.5 (3.3 μg/m3; IQR, 2.1–10 μg/m3 v 2.4 μg/m3; IQR, 1.2–8.3 μg/m3) and peak 24‐hour PM2.5 exposure (93.1 μg/m3; IQR, 55.6–174 μg/m3 v 62.9 μg/m3; IQR, 29.6–134 μg/m3) (Box 3). Mean daily and peak 24‐hour PM2.5 exposure levels were highly correlated (Spearman rank correlation coefficient, 0.92).
Reported health outcomes
We analysed 4672 monthly diaries (mean number per participant, 16.2; SD, 9.0). Cough or runny nose were the most frequently reported symptoms (2909 diaries, 62.3%); upper respiratory tract infections (534, 11.4%), wheezing or asthma (195, 4.2%), and ear infections (193, 4.1%) were the most frequently reported doctor diagnoses. Visiting a general practitioner or local doctor during the preceding month was reported in 1090 diaries (23.3%) and antibiotic use in 296 (6.3%) (Box 4; Supporting Information, table 2).
Associations between PM2.5 exposure and reported health outcomes
The in utero exposure analysis included 2678 monthly diaries for 160 children (exposed in utero or unexposed); the early childhood analysis included 3290 diaries for 210 children (exposed aged 0–2 years or unexposed).
Each 10 μg/m3 increase in mean daily PM2.5 exposure in utero was associated with increased diary reports of runny nose/cough (RR, 1.09; 95% CI, 1.02–1.17), wheeze (RR, 1.56; 95% CI, 1.18–2.07), seeking health professional advice (RR, 1.17; 95% CI, 1.06–1.29; particularly from other than a general practitioner or hospital doctor: RR, 1.28; 95% CI, 1.09–1.49), and doctor diagnoses of upper respiratory tract infection, cold or flu (RR, 1.35; 95% CI, 1.14–1.60). Associations with peak 24‐hour PM2.5 exposure were similar (Box 5).
Increasing mean daily PM2.5 exposure during early childhood was not associated with any statistically significant differences in outcome. Each 100 μg/m3 increase in peak 24‐hour PM2.5 exposure was associated with increased use of asthma inhalers (RR, 1.26; 95% CI, 1.01–1.58), but not with changes in other outcomes (Box 5).
Mean daily and peak 24‐hour PM2.5 exposure did not influence numbers of reports of fever, skin rashes, or use of antibiotics, asthma inhalers (exception: peak PM2.5 exposure in early childhood exposure group, as above), and topical steroid cream or ointments. Of the covariates included in our model, only the season of the diary report and the child's age were consistently associated with outcomes (data not shown).
The results of sensitivity analyses restricted to exposed children were similar to those of the main analyses, but the associations between mean daily PM2.5 exposure and wheeze for children exposed in utero and between peak 24‐hour PM2.5 exposure during early childhood and asthma inhaler use were no longer significant (Supporting Information, table 3).
In the sensitivity analysis excluding the 21 children with mixed in utero and early childhood exposure from the early childhood analysis, none of the associations were statistically significant (Supporting Information, table 4).
Discussion
Exposure in utero to PM2.5 in smoke from the Hazelwood coalmine fire was associated with higher reported frequency of cough or runny nose, wheeze, seeking health care provider advice, and doctor diagnoses of upper respiratory tract infections, colds or flu 2–4 years after the fire. Associations between early childhood exposure to elevated PM2.5 levels and reported outcomes were not statistically significant, except for a small increase in asthma inhaler use. Our findings suggest an increased susceptibility to acute respiratory infections during childhood after exposure in utero to a severe air pollution episode.
Exposure to air pollution during pregnancy has been linked with reduced lung function during infancy and childhood,3,6,7 and with recurrent broncho‐pulmonary infections in childhood.5 Similarly, chronic post‐natal exposure to traffic‐related air pollution and indoor coal combustion has been linked with respiratory infections in young children.26,27 Our finding that outcomes were more markedly influenced by PM2.5 exposure in utero than during early childhood was unexpected, as inhalation is presumed to be the primary route of exposure to air pollutants.28 It can be difficult to disentangle the effects of prenatal and postnatal exposure to ambient air pollution.3 Unlike previous studies, we could directly compare in utero and postnatal exposure because of the time‐limited nature of the pollution episode and because there was a single exposure route for most participating children.
Prenatal environmental exposures are thought to be particularly important for long term health because germ and fetal cells are more susceptible to disruption than mature cells.3,29 The causal mechanisms are unclear, but it has been suggested that finer particles cross the placenta and act directly on the fetus, or elicit systemic inflammatory and immune responses in the mother that affect lung development.3,5 Accordingly, the effects of postnatal PM2.5 exposure may have waned by 2–4 years after the Hazelwood fire, whereas prenatal exposure had a more pervasive impact. Other studies have reported associations between wildfire smoke during pregnancy and birthweight and between coalmine fire smoke and gestational diabetes.14,30
We also found that in utero exposure to smoke was associated with more frequent reports of wheeze, adding to the evidence for a link between prenatal air pollution and wheeze or asthma.4,31 Ambient air pollution and forest fires have each been strongly associated with asthma exacerbation in both children and adults,14,26 but in children of the age group in our study wheeze may have been secondary to infections rather than atopic in nature.
It is increasingly recognised that air pollution may play a role in the prevalence and aggravation of atopic dermatitis,10 although this link was not apparent in our study. The impact of short term exposure to increased air pollution has not previously been investigated, and a measurable impact may require longer exposure.
Strengths and limitations
Strengths of our study included the large number of monthly diary reports over more than two years and the detailed information on many potentially confounding variables. Further, collecting detailed time and activity data during the fire allowed us to estimate individual PM2.5 exposure. Parent‐reported outcomes included data on less serious illnesses, which may be more sensitive outcome measures than administrative health outcome data.
However, a larger proportion of the participants had mothers with post‐secondary school education, and their PM2.5 exposure was lower than for the Latrobe ELF study cohort in general. Further, participants had a higher level of education than the general population of the Latrobe Valley,13 and the possibly greater health literacy of their parents may affect the generalisability of our findings. Nonetheless, as the effects of air pollution are generally greater for people in lower socio‐demographic areas,18 we may have underestimated the impact of the pollution episode in our study.
Community concern about the health effects of the Hazelwood fire, particularly for young children and people with respiratory conditions,1 was widespread, potentially causing reporting or recall bias. Finally, our analyses may not have been adequately adjusted for the differing ages of the children in the exposure groups, leading to unrecognised confounding.
Conclusion
Severe episodic smoke events from bushfires and planned burns are common in Australia (and elsewhere), and their number will increase with climate change.32 Our findings highlight the particular vulnerability of the very young, including unborn babies, to insults during critical developmental periods and the importance of protecting them during landscape fire smoke events and other causes of air pollution.
We have reported the first investigation of the longer term effects of time‐limited exposure to elevated environmental smoke levels during early life. Our findings suggest that in utero exposure to smoke may have a greater impact on long term respiratory health than exposure during the first two years of life. Protecting pregnant women and young children from episodic severe smoke events should be central to public health responses to poor air quality.
Box 2 – Socio‐demographic characteristics of study participants, by exposure group
|
|
Exposure group |
All participants |
|||||||||||||
|
Unexposed |
In utero |
Early childhood |
|||||||||||||
|
|
|||||||||||||||
|
Number of participants |
81 |
79 |
129 |
289 |
|||||||||||
|
Age at first diary report (years) |
|
|
|
|
|||||||||||
|
Mean (SD) |
2.30 (0.65) |
3.05 (0.69) |
4.42 (0.89) |
3.45 (1.20) |
|||||||||||
|
Range |
0.81–3.48 |
1.80–4.23 |
2.61–6.33 |
0.81–6.33 |
|||||||||||
|
Sex |
|
|
|
|
|||||||||||
|
Boys |
44 (54%) |
38 (48%) |
69 (53%) |
151 (52%) |
|||||||||||
|
Girls |
37 (46%) |
41 (52%) |
60 (47%) |
138 (48%) |
|||||||||||
|
Aboriginal or Torres Strait Islanders |
4 (5%) |
4 (5%) |
7 (5%) |
15 (5%) |
|||||||||||
|
Born in Australia |
81 (100%) |
79 (100%) |
127 (98%) |
287 (99%) |
|||||||||||
|
Languages spoken at home |
|
|
|
|
|||||||||||
|
English |
81 (100%) |
78 (99%) |
129 (100%) |
288 (100%) |
|||||||||||
|
Other |
8 (10%) |
5 (6%) |
5 (4%) |
18 (6%) |
|||||||||||
|
Biological siblings |
50 (62%) |
51 (65%) |
102 (79%) |
203 (70%) |
|||||||||||
|
Attends childcare |
15 (19%) |
37 (47%) |
74 (57%) |
126 (44%) |
|||||||||||
|
Mother's education: beyond year 12 |
57 (70%) |
56 (71%) |
90 (71%) |
203 (71%) |
|||||||||||
|
Mother's age (years) |
|
|
|
|
|||||||||||
|
Mean (SD) |
30.4 (5.1) |
29.5 (4.5) |
29.1 (5.1) |
29.6 (5.0) |
|||||||||||
|
Range |
22–45 |
17–43 |
16–45 |
16–45 |
|||||||||||
|
Index of Relative Socioeconomic Disadvantage |
|
|
|
|
|||||||||||
|
Quintile 1 (most disadvantage) |
37 (46%) |
31 (39%) |
58 (45%) |
126 (44%) |
|||||||||||
|
Quintile 2 |
11 (14%) |
18 (23%) |
13 (10%) |
42 (14%) |
|||||||||||
|
Quintile 3 |
10 (12%) |
12 (15%) |
23 (18%) |
45 (16%) |
|||||||||||
|
Quintile 4 |
9 (11%) |
8 (10%) |
16 (12%) |
33 (11%) |
|||||||||||
|
Quintile 5 |
14 (17%) |
10 (13%) |
19 (15%) |
43 (15%) |
|||||||||||
|
Breastfed for at least 6 months |
46 (57%) |
42 (53%) |
62 (48%) |
150 (52%) |
|||||||||||
|
Mother smoked during pregnancy |
11 (14%) |
7 (9%) |
17 (13%) |
35 (12%) |
|||||||||||
|
Lives with a smoker |
17 (21%) |
12 (15%) |
30 (23%) |
59 (20%) |
|||||||||||
|
Asthma diagnosis |
0 |
10 (13%) |
31 (24%) |
41 (14%) |
|||||||||||
|
Eczema/dermatitis diagnosis |
22 (27%) |
29 (37%) |
42 (33%) |
93 (32%) |
|||||||||||
|
|
|||||||||||||||
|
SD = standard deviation. |
|||||||||||||||
Box 3 – Coalmine fire‐attributable PM2.5 exposure, by exposure group. A. Mean daily exposure; B. Peak daily exposure
Box 5 – Associations between mean and peak daily PM2.5 exposure and parent‐reported outcomes, by exposure group: multivariate analyses*
|
|
In utero exposure analysis |
Early childhood exposure analysis |
|||||||||||||
|
Relative risk (95% CI): per 10 μg/m3 mean PM2.5 |
Relative risk (95% CI): per 100 μg/m3 peak PM2.5 |
Relative risk (95% CI): per 10 μg/m3 mean PM2.5 |
Relative risk (95% CI): per 100 μg/m3 peak PM2.5 |
||||||||||||
|
|
|||||||||||||||
|
Monthly diaries |
2678 |
|
3290 |
|
|||||||||||
|
Symptoms |
|
|
|
|
|||||||||||
|
Runny nose or cough |
1.09 (1.02–1.17) |
1.05 (1.01–1.09) |
1.05 (0.98–1.13) |
1.04 (1.00–1.09) |
|||||||||||
|
Wheeze |
1.56 (1.18–2.07) |
1.29 (1.07–1.55) |
1.07 (0.80–1.44) |
1.09 (0.93–1.28) |
|||||||||||
|
Fever |
1.00 (0.84–1.20) |
1.01 (0.92–1.12) |
1.03 (0.86–1.25) |
1.06 (0.94–1.19) |
|||||||||||
|
Skin rash (not in nappy area) |
0.89 (0.66–1.20) |
1.01 (0.83–1.22) |
0.91 (0.66–1.26) |
0.93 (0.74–1.15) |
|||||||||||
|
Health care provider contact |
|
|
|
|
|||||||||||
|
Any health care provider advice |
1.17 (1.06–1.29) |
1.10 (1.04–1.16) |
1.02 (0.86–1.21) |
1.03 (0.92–1.16) |
|||||||||||
|
Seen by GP or hospital doctor |
1.13 (0.99–1.28) |
1.08 (1.00–1.15) |
0.95 (0.77–1.17) |
1.00 (0.88–1.15) |
|||||||||||
|
Other health care provider advice† |
1.28 (1.09–1.49) |
1.14 (1.02–1.27) |
1.11 (0.87–1.41) |
1.06 (0.91–1.25) |
|||||||||||
|
Medication use |
|
|
|
|
|||||||||||
|
Antibiotics |
1.06 (0.81–1.39) |
1.06 (0.91–1.23) |
0.98 (0.71–1.35) |
0.99 (0.81–1.21) |
|||||||||||
|
Asthma inhalers |
1.21 (0.86–1.72) |
1.18 (0.94–1.50) |
1.39 (0.97–1.99) |
1.26 (1.01–1.58) |
|||||||||||
|
Steroid skin cream/ointment |
0.73 (0.40–1.32) |
0.94 (0.66–1.32) |
0.79 (0.42–1.47) |
0.84 (0.54–1.31) |
|||||||||||
|
Medical diagnosis of upper respiratory tract infection/cold/flu |
1.35 (1.14–1.60) |
1.18 (1.07–1.32) |
0.93 (0.71–1.22) |
0.98 (0.83–1.17) |
|||||||||||
|
|
|||||||||||||||
|
* Covariates: age, sex, tobacco smoke exposure, maternal level of education, unflued gas heating or gas stovetop exposure, background NO2, Index of Relative Socioeconomic Disadvantage decile, season of diary report. † Seen by child health nurse/pharmacist advice/telephone medical advice. |
|||||||||||||||
Received 17 January 2020, accepted 11 May 2020
- Gabriela A Willis1,2
- Kate Chappell1
- Stephanie Williams2
- Shannon M Melody1
- Amanda Wheeler1,3
- Marita Dalton1
- Shyamali C Dharmage4
- Graeme R Zosky1
- Fay H Johnston1
- 1 Menzies Institute for Medical Research, University of Tasmania, Hobart, TAS
- 2 National Centre for Epidemiology and Population Health, Australian National University, Canberra, ACT
- 3 Mary MacKillop Institute for Health Research, Australian Catholic University, Melbourne, VIC
- 4 Melbourne School of Population and Global Health, University of Melbourne, Melbourne, VIC
This investigation was funded by the Victorian Department of Health and Human Services. The article presents our views, not those of the department. Our work was also supported by the Commonwealth Specialist Training Program and the Australian National University Master of Applied Epidemiology program.We acknowledge the multidisciplinary group of researchers and administrative staff of the Latrobe ELF Study at the University of Tasmania, Monash University, the University of Melbourne, the University of Sydney, and the Commonwealth Scientific and Industrial Research Organisation. We also thank Jingyi Shao, University of Tasmania, for her assistance with geographical mapping elements of the study. Most importantly we thank the families of the Latrobe ELF study for their participation.
No relevant disclosures.
- 1. Teague B, Catford J, Petering S. Hazelwood mine fire inquiry report (Victorian Government: PP no 342, session 2010–2014). Aug 2014. http://report.hazelwoodinquiry.vic.gov.au (viewed Dec 2019).
- 2. Luhar AK, Emmerson KM, Reisen F, et al. Modelling smoke distribution in the vicinity of a large and prolonged fire from an open‐cut coal mine. Atmos Environ 2020; 229: 117471.
- 3. Korten I, Ramsey K, Latzin P. Air pollution during pregnancy and lung development in the child. Paediatr Respir Rev 2017; 21: 38–46.
- 4. Hehua Z, Qing C, Shanyan G, et al. The impact of prenatal exposure to air pollution on childhood wheezing and asthma: a systematic review. Environ Res 2017; 159: 519–530.
- 5. Jedrychowski WA, Perera FP, Spengler JD, et al. Intrauterine exposure to fine particulate matter as a risk factor for increased susceptibility to acute broncho‐pulmonary infections in early childhood. Int J Hyg Environ Health 2013; 216: 395–401.
- 6. Jedrychowski WA, Perera FP, Maugeri U, et al. Effect of prenatal exposure to fine particulate matter on ventilatory lung function of preschool children of non‐smoking mothers. Paediatr Perinat Epidemiol 2010; 24: 492–501.
- 7. Latzin P, Röösli M, Huss A, et al. Air pollution during pregnancy and lung function in newborns: a birth cohort study. Eur Respir J 2009; 33: 594–603.
- 8. Gouveia N, Junger WL; ESCALA investigators. Effects of air pollution on infant and children respiratory mortality in four large Latin‐American cities. Environ Pollut 2018; 232: 385–391.
- 9. Morgenstern V, Zutavern A, Cyrys J, et al; GINI Study Group; LISA Study Group. Atopic diseases, allergic sensitization, and exposure to traffic‐related air pollution in children. Am J Respir Crit Care Med 2008; 177: 1331–1337.
- 10. Ahn K. The role of air pollutants in atopic dermatitis. J Allergy Clin Immunol 2014; 134: 993–999.
- 11. Kim J, Kim EH, Oh I, et al. Symptoms of atopic dermatitis are influenced by outdoor air pollution. J Allergy Clin Immunol 2013; 132: 495–498.e1.
- 12. Reid CE, Brauer M, Johnston FH, et al. Critical review of health impacts of wildfire smoke exposure. Environ Health Perspect 2016; 124: 1334–1343.
- 13. Melody S, Dalton M, Dennekamp M, et al. Hazelwood health study: the Latrobe Early Life Follow‐up (ELF) cohort study. Volume 1, version 1.2. Nov 2017. https://hazelwoodhealthstudy.org.au/__data/assets/pdf_file/0009/1636452/elf-vol-1_-cohortdesciption_parentreportedoutcomes-v1.2.pdf (viewed Dec 2019).
- 14. Melody SM, Ford JB, Wills K, et al. Maternal exposure to fine particulate matter from a large coal mine fire is associated with gestational diabetes mellitus: a prospective cohort study. Environ Res 2019; 183: 108956.
- 15. Australian Bureau of Statistics. 1270.0.55.001. Australian Statistical Geography Standard (ASGS): volume 1 – main structure and greater capital city statistical areas, July 2016. July 2016. http://www.abs.gov.au/ausstats/abs@.nsf/Lookup/by%20Subject/1270.0.55.001~July%202016~Main%20Features~Mesh%20Blocks%20(MB)~10012 (viewed Dec 2019).
- 16. Knibbs LD, Hewson MG, Bechle MJ, et al. A national satellite‐based land‐use regression model for air pollution exposure assessment in Australia. Environ Res 2014; 135: 204–211.
- 17. Australian Bureau of Statistics. Census of population and housing: Socio‐Economic Indexes for Areas (SEIFA), Australia, 2011. Mar 2013. http://www.abs.gov.au/AUSSTATS/abs@.nsf/DetailsPage/2033.0.55.0012011?OpenDocument (viewed Dec 2019).
- 18. Cakmak S, Hebbern C, Cakmak JD, Vanos J. The modifying effect of socioeconomic status on the relationship between traffic, air pollution and respiratory health in elementary schoolchildren. J Environ Manage 2016; 177: 1–8.
- 19. Uphoff E, Cabieses B, Pinart M, et al. A systematic review of socioeconomic position in relation to asthma and allergic diseases. Eur Respir J 2015; 46: 364e374.
- 20. Golenko XA, Shibl R, Scuffham PA, Cameron CM. Relationship between socioeconomic status and general practitioner visits for children in the first 12 months of life: an Australian study. Aust Health Rev 2015; 39: 136e145.
- 21. Vanker A, Gie RP, Zar HJ. The association between environmental tobacco smoke exposure and childhood respiratory disease: a review. Expert Rev Respir Med 2017; 11: 661e673.
- 22. Lee A, Leon Hsu HH, Mathilda Chiu YH, et al. Prenatal fine particulate exposure and early childhood asthma: effect of maternal stress and fetal sex. J Allergy Clin Immunol 2018; 141: 1880e1886.
- 23. Pereira G, Cook A, De Vos AJ, Holman CD. A case‐crossover analysis of traffic‐related air pollution and emergency department presentations for asthma in Perth, Western Australia. Med J Aust 2010; 193: 511–514. https://www.mja.com.au/journal/2010/193/9/case-crossover-analysis-traffic-related-air-pollution-and-emergency-department.
- 24. Knibbs LD, Woldeyohannes S, Marks GB, Cowie CT. Damp housing, gas stoves, and the burden of childhood asthma in Australia. Med J Aust 2018; 208: 299–302. https://www.mja.com.au/journal/2018/208/7/damp-housing-gas-stoves-and-burden-childhood-asthma-australia.
- 25. Textor J, van der Zander B, Gilthorpe MS, et al. Robust causal inference using directed acyclic graphs: the R package “dagitty”. Int J Epidemiol 2016; 45: 1887–1894.
- 26. Brauer M, Hoek G, Smit HA, et al. Air pollution and development of asthma, allergy and infections in a birth cohort. Eur Respir J 2007; 29: 879–888.
- 27. Dherani M, Pope D, Mascarenhas M, et al. Indoor air pollution from unprocessed solid fuel use and pneumonia risk in children aged under five years: a systematic review and meta‐analysis. Bull World Health Organ 2008; 86: 390–398C.
- 28. Trasande L, Thurston GD. The role of air pollution in asthma and other pediatric morbidities. J Allergy Clin Immunol 2005; 115: 689–699.
- 29. Leibel S, Post M. Endogenous and exogenous stem/progenitor cells in the lung and their role in the pathogenesis and treatment of pediatric lung disease. Front Pediatr 2016; 4: 36.
- 30. Holstius DM, Reid CE, Jesdale BM, et al. Birth weight following pregnancy during the 2003 Southern California wildfires. Environ Health Perspect 2012; 120: 1340–1345.
- 31. Clark NA, Demers PA, Karr CJ, et al. Effect of early life exposure to air pollution on development of childhood asthma. Environ Health Perspect 2010; 118: 284–290.
- 32. Ford B, Val Martin M, Zelasky SE, et al. Future fire impacts on smoke concentrations, visibility, and health in the contiguous United States. GeoHealth 2018; 2: 229–247.
Abstract
Objective: To evaluate associations between exposure during early life to mine fire smoke and parent‐reported indicators of respiratory and atopic illness 2–4 years later.
Design, setting: The Hazelwood coalmine fire exposed a regional Australian community to markedly increased air pollution during February – March 2014. During June 2016 – October 2018 we conducted a prospective cohort study of children from the Latrobe Valley.
Participants: Seventy‐nine children exposed to smoke in utero, 81 exposed during early childhood (0–2 years of age), and 129 children conceived after the fire (ie, unexposed).
Exposure: Individualised mean daily and peak 24‐hour fire‐attributable fine particulate matter (PM2.5) exposure during the fire period, based on modelled air quality and time‐activity data.
Main outcome measures: Parent‐reported symptoms, medications use, and contacts with medical professionals, collected in monthly online diaries for 29 months, 2–4 years after the fire.
Results: In the in utero exposure analysis (2678 monthly diaries for 160 children exposed in utero or unexposed), each 10 μg/m3 increase in mean daily PM2.5 exposure was associated with increased reports of runny nose/cough (relative risk [RR], 1.09; 95% CI, 1.02–1.17), wheeze (RR, 1.56; 95% CI, 1.18–2.07), seeking health professional advice (RR, 1.17; 95% CI 1.06–1.29), and doctor diagnoses of upper respiratory tract infections, cold or flu (RR, 1.35; 95% CI, 1.14–1.60). Associations with peak 24‐hour PM2.5 exposure were similar. In the early childhood exposure analysis (3290 diaries for 210 children exposed during early childhood, or unexposed), each 100 μg/m3 increase in peak 24‐hour PM2.5 exposure was associated with increased use of asthma inhalers (RR, 1.26; 95% CI, 1.01–1.58).
Conclusions: Exposure to mine fire smoke in utero was associated with increased reports by parents of respiratory infections and wheeze in their children 2–4 years later.