


Ambient air quality in Australia is regulated by the National Environment Protection Measure (NEPM), which sets a maximum 24‐hour mean concentration of 50 μg/m3 for particulate matter less than 10 μm in diameter (PM10) and 25 μg/m3 for PM2.5. Each state and territory is required by the NEPM to annually report all breaches of this standard, including the sources of pollution.1
We analysed NEPM reports for Western Australia to identify days during 1 January 2002 – 31 December 2017 on which atmospheric particulate matter levels exceeded air quality standard levels, and classified them according to the most frequently reported sources of pollution: prescribed burns, wildfires, and other (crustal particles such as dust, wood smoke, and indeterminate). During 2008–2013, exceedances caused by smoke from prescribed burns, wildfires, and wood smoke were all recorded by the WA Department of Environment Regulation as “smoke haze”. For this period, we therefore applied a random forest algorithm, a machine learning method that uses a random sample of observations for known classifications to predict the classifications for new data.2 We included the variables month, day of the week, temperature, and pollution level as model predictors.
To estimate background PM2.5 level, we obtained historical hourly values for PM10 and PM2.5 from the WA Department of Water and Environmental Regulation3 and calculated historical monthly means, excluding days on which particle levels exceeded the air quality standard. We estimated daily PM2.5 concentrations attributable to smoke events by subtracting the background PM2.5 level from measured daily values.
Applying standard methods for assessing the health impact of air pollution,4 we estimated the numbers of premature deaths, hospitalisations for cardiovascular and respiratory problems, and emergency department presentations with asthma attributable to elevated PM2.5 levels. We used the value of statistical life (VSL)5 to estimate costs associated with premature mortality. The VSL is based on the willingness to pay for reduced risk of premature mortality, and does not take into account underlying health status, age, or life expectancy of individuals. Deaths associated with acute exposure to increased air pollution are more likely among people at greater risk because of advanced age or chronic illness.6 We estimated hospital service costs according to the mean cost of each episode of care as reported in the Independent Hospital Pricing Authority national cost data collection report7 and the Health Policy Analysis emergency care costing report.8
We also undertook a sensitivity analysis in which we excluded data for 2008–2013, when exceedances caused by smoke from prescribed burns, wildfires, and wood smoke were all recorded in NEPM reports as “smoke haze”. Further details on our methods, including underlying assumptions and limitations, are included in the online Supporting Information.
During 2002–2017, particulate air pollution exceeded the national standard on 271 of 5844 days (4.6%), including 197 days (73%) attributable to prescribed burns or wildfires. We estimated that 41 (95% confidence interval [CI], 15–68) premature deaths, 99 (95% CI, 19–182) hospitalisations for cardiovascular problems and 174 (95% CI, 0–373) for respiratory conditions, and 123 (95% CI, 70–179) emergency department visits with asthma were attributable to elevated PM2.5 concentration (Box 1).
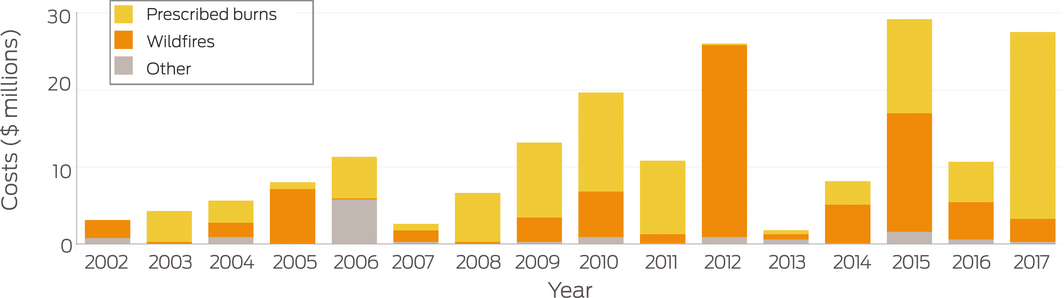
Total estimated health costs were $188.8 million (95% CI, $68.1–311.1 million); $97.1 million (51%) was attributable to prescribed burns and $77.7 million (41%) to wildfires. Mean estimated health costs were lower on days affected by smoke from prescribed burns ($703 984; 95% CI, $254 064–$1.2 million) than those affected by wildfire smoke ($1.3 million; 95% CI, $475 000–$2.2 million), although more days were affected by prescribed burns (138) than by wildfires (59). The estimated smoke‐related costs of wildfires were highest in 2012 ($24.8 million); in many years, prescribed fires often accounted for most health‐related costs, peaking in 2017 ($24.1 million) (Box 2). In our sensitivity analysis excluding the period 2008–2013, the relative costs by source were similar (prescribed burns, 53% [$58.4 million]; wildfires, 38% [$41.6 million]; Supporting Information).
Particulate matter in fire smoke is associated with adverse health outcomes,9 even at relatively low concentrations.10 Landscape fire smoke was the greatest contributor to excessive atmospheric particulate matter levels in WA during 2002–2017 and was associated with substantial health costs. Our estimates of the health impacts may be conservative, as we included only days when PM2.5 concentrations exceeded the national standard, excluding smoky days on which the air quality standard was not breached. Further, our selection of health outcomes did not encompass the total health burden attributable to smoke exposure. Our study highlights the different smoke‐related health effects and costs of infrequent severe wildfire and regular prescribed burning. While prescribed burning reduces the risk of wildfire, better understanding and incorporation into control strategies of the full health impacts of each type of fire are needed for sustainable fire management.11
Box 1 – Estimated health burden attributable to elevated PM2.5 concentrations, Western Australia, 2002–2017, by particulate matter source
|
Outcome |
Estimated number of cases (95% confidence interval) |
||||||||||||||
|
Prescribed burns |
Wildfires |
Other |
Total |
||||||||||||
|
|
|||||||||||||||
|
Excess deaths (any cause) |
21 (8–35) |
17 (6–28) |
3 (1–5) |
41 (15–68) |
|||||||||||
|
Hospital admissions, cardiovascular |
51 (10–94) |
41 (8–75) |
7 (1–13) |
99 (19–182) |
|||||||||||
|
Hospital admissions, respiratory |
89 (0–192) |
72 (0–154) |
13 (0–27) |
174 (0–373) |
|||||||||||
|
Emergency department attendances, asthma |
63 (36–91) |
51 (29–75) |
9 (5–13) |
123 (70–179) |
|||||||||||
|
|
|||||||||||||||
|
|
|||||||||||||||
Received 16 September 2019, accepted 6 January 2020
- 1. Department of the Environment. National Environment Protection (Ambient Air Quality) Measure. Canberra: Government of Australia, 2016. https://www.legislation.gov.au/Details/F2016C00215 (viewed Jan 2020).
- 2. Breiman L. Random forests. Mach Learn 2001; 45: 5–32.
- 3. Western Australia Department of Water and Environmental Regulations. Air quality data. https://www.der.wa.gov.au/your-environment/air/air-quality-data (viewed Sept 2019).
- 4. World Health Organization. Health risks of air pollution in Europe: HRAPIE project. Recommendations for concentration response functions for cost‐benefit analysis of particular matter, ozone and nitrogen oxide. Copenhagen: World Health Organization Regional Office for Europe, 2013. http://www.euro.who.int/__data/assets/pdf_file/0006/238956/Health_risks_air_pollution_HRAPIE_project.pdf?Ua=1 (viewed Sept 2019).
- 5. Australian Department of Prime Minister and Cabinet, Office of Best Practice Regulation. Value of statistical life (Best practice regulation guidance note). Dec 2014. https://www.pmc.gov.au/sites/default/files/publications/Value_of_Statistical_Life_guidance_note.pdf (viewed Sept 2019).
- 6. National Research Council. Estimating mortality risk reduction and economic benefits from controlling ozone air pollution. Washington (DC): National Academies Press, 2008. https://www.nap.edu/catalog/12198/estimating-mortality-risk-reduction-and-economic-benefits-from-controlling-ozone-air-pollution (viewed Jan 2020).
- 7. Independent Hospital Pricing Authority. National hospital cost data collection, public hospitals cost report, round 20 (financial year 2015–16). Mar 2018. https://www.ihpa.gov.au/publications/national-hospital-cost-data-collection-public-hospitals-cost-report-round-20-0 (viewed Sep 2019).
- 8. Independent Hospital Pricing Authority. Emergency care costing and classification project: cost report. Oct 2017. https://www.ihpa.gov.au/sites/g/files/net636/f/emergency_care_costing_study_final_report.docx (viewed Sep 2019).
- 9. Cascio WE. Wildland fire smoke and human health. Sci Total Environ 2018; 624: 586–595.
- 10. Shi L, Zanobetti A, Kloog I, et al. Low‐concentration PM 2.5 and mortality: estimating acute and chronic effects in a population‐based study. Environ Health Perspect 2016; 124: 46–52.
- 11. Williamson GJ, Bowman DMJS, Price OF, et al. A transdisciplinary approach to understanding the health effects of wildfire and prescribed fire smoke regimes [letter]. Environ Res Lett 2016; 11: 125009.
We thank Arthur Grieco and the Department of Water and Environmental Regulation (Western Australia) for providing air quality monitoring network data. Nicolas Borchers Arriagada is supported by a Tasmania Graduate Research Scholarship from the University of Tasmania, a top‐up scholarship from Asthma Australia, and a top‐up scholarship from the New South Wales Department of Planning, Industry and Environment through the New South Wales Bushfire Risk Management Research Hub.
No relevant disclosures.