


The known: Sexual misconduct by health practitioners is a profound breach of trust. Notifications to regulatory authorities about such misconduct are more frequent for psychiatrists, psychologists, and general practitioners than for other health care professionals.
The new: Notifications regarding sexual misconduct by health professionals were more frequent for men than women, for middle‐aged than younger practitioners, for rural/regional than metropolitan practitioners, and in clinical specialities characterised by longer term one‐to‐one treatment relationships.
The implications: Notifications of sexual misconduct by health professionals are rare, but patients, health practitioners, and the public deserve focused efforts to prevent sexual misconduct and ensure thorough investigation of allegations.
Health care is founded on trust. Patients are asked to disclose personal information and to undergo intimate examinations that would be unacceptable outside the patient–practitioner relationship. Sexual misconduct by health practitioners is a profound breach of this trust.1,2
Despite the clear prohibition of sexual interactions between health practitioners and their patients,1 such misconduct does occur.3 In one American study from the 1990s, almost one in ten male medical practitioners reported having had sexual contact with patients,4 and sexual misconduct is frequently an issue in medical disciplinary proceedings.5 However, the prevalence of sexual misconduct is unclear; studies based on surveys and interviews are limited by poor response rates and response bias. Medico‐legal datasets capture only reported events, and sexual misconduct in general is often not reported because of the attached stigma, mistrust of official processes, and fear of repercussions.6
Overseas research on sexual misconduct in health care settings has focused on medical practitioners7,8,9,10 and psychologists,11,12,13,14 with few studies of other health care professions.15,16,17,18,19 Our study is the first to examine sexual misconduct notifications for a national cohort of all registered health practitioners.
Methods
The Australian Health Practitioner Regulation Agency (Ahpra) works in partnership with profession‐specific national boards to register health practitioners and manage notifications about their health, conduct, and performance. The Health Professional Councils Authority (HPCA) in New South Wales and the Office of the Health Ombudsman in Queensland are also involved in these processes.
Since 2010, health practitioners and employers who form a reasonable belief that a health practitioner has engaged in sexual misconduct are obliged (under the Health Practitioner Regulation National Law Act 2009) to report their concern to Ahpra.20,21 Further, any person may lodge a notification of sexual misconduct. Substantiated allegations can trigger sanctions ranging from a caution to cancellation of registration.5
Data extraction
We extracted information for all health practitioners registered to practise in Australia during 1 January 2011 – 31 December 2016 from administrative data routinely collected by Ahpra and held in the Register of Practitioners and the national notifications dataset. De‐identified data was provided by Ahpra as part of a National Health and Medical Research Council‐funded research partnership between Ahpra and the University of Melbourne. We extracted information about the period for which each practitioner was registered, and the practitioner's age, sex, profession, and practice location. We then identified all notifications lodged with Ahpra and the HPCA regarding these practitioners during the study period; Ahpra and the HPCA provided the date of notification, the primary reason for the notification, and the outcome.
We classified health practitioners in eight groups according to their registered profession: medical practitioners, nurses and midwives, psychologists, chiropractors and osteopaths, physiotherapists, dentists, pharmacists, and other allied health professionals. Medical practitioners were further classified in eight specialty groups. To control for differences in potential exposure to notifications because of differences in numbers of clinical hours, we estimated the mean number of clinical hours worked per week by profession, specialty, sex, and age group, based on information from the National Health Workforce Data Set provided by the Australian Institute of Health and Welfare.
Misconduct notifications are classified by Ahpra and HPCA staff when lodged and coded according to the reason for the report, ranging from alcohol misuse to misdiagnosis and fraud. We grouped notifications related to sexual misconduct into two categories: engaging in a sexual relationship with a patient, and sexual harassment or sexual assault (Box 1). Sexual relationships ranged from single events to longer relationships, while sexual harassment or sexual assault included behaviours prohibited by Australian law, including making suggestive sexual remarks, touching patients in a sexual manner, conducting intimate examinations without clinical indication or consent, and rape.
We classified case outcomes according to the regulatory action taken: no further action, referral to another body; a caution, reprimand, fine, or voluntary undertaking to comply with certain actions or restrictions; and registration conditions, suspension, or cancellation. A decision to take no further action may be made when a board or tribunal has determined that the allegations are unfounded, there are evidentiary problems, or there is no further risk to the public (for instance, the practitioner has ceased practice).
Statistical analysis
All analyses were conducted in Stata 14.2. We summarised practitioner characteristics and the sources and outcomes of notifications as counts and proportions. We calculated notification rates per 10 000 practitioner‐years by health practitioner characteristic (sex, age, profession, medical specialty, practice location).
We compared notification rates by using negative binomial regression to estimate rate ratios (with 95% confidence intervals [CIs]) adjusted for age, sex, practice location, jurisdiction, and clinical hours worked. We estimated these rate ratios separately for notifications regarding sexual relationships and sexual harassment/assault. Given the heterogeneity of the second misconduct type, we also conducted separate multivariate analyses of sexual harassment and sexual assault.
As outcome bias may have influenced our estimates because more serious allegations can take longer to investigate, we undertook a sensitivity analysis restricted to notifications lodged during the first three years of the study period. This allowed longer follow‐up and greater opportunity for case closure.
Ethics approval
The University of Melbourne Human Ethics Sub‐committee for Medicine and Dentistry approved the study (reference, 1543670.2). Ahpra and the HPCA provided de‐identified data under a deed of confidentiality.
Results
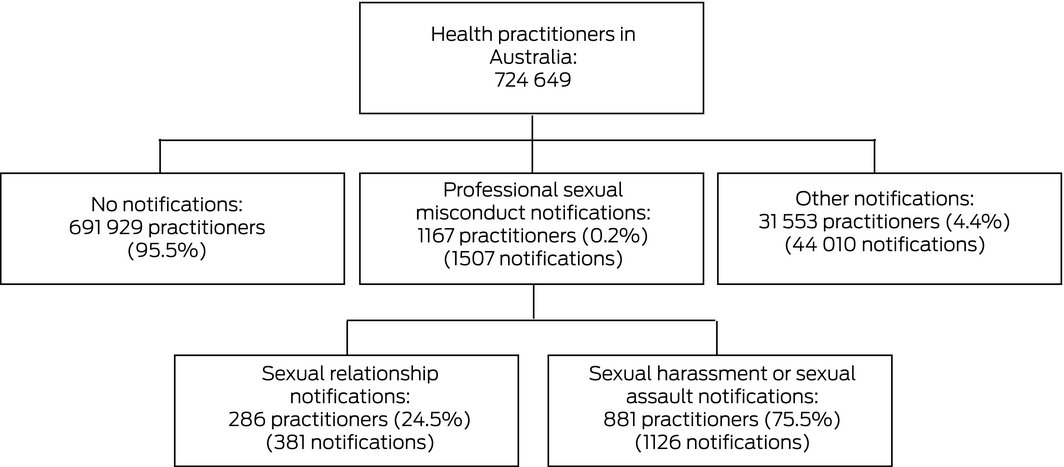
During 2011–2016, Australian regulators received 1507 notifications of sexual misconduct by 1167 of 724 649 registered health practitioners (0.2%) (Box 2); 208 of these practitioners (18%) were named in more than one allegation of sexual misconduct (Box 3).
The large majority of subjects of sexual misconduct notifications were men (1024 of 1167, 88%); a larger proportion of male practitioners (1024 of 171 693; 0.60%) than of female practitioners (143 of 552 956; 0.03%) were the subjects of notifications. Notifications about 88 of the 143 female practitioners (62%) reported sexual relationships with patients rather than harassment or assaults. More than one‐third of all health practitioners were under 36 years of age (247 719 of 724 649, 34%), but only 114 of 1167 subjects of notifications (9.8%) were in this age group (Box 4).
Medical practitioners, psychologists, and chiropractors and osteopaths comprised 22.0% of registered practitioners (159 099 of 724 649), yet 72.2% of practitioners who were subjects of sexual misconduct notifications practised in these professions (842 of 1167). The 429 291 nurses and midwives comprised 59.2% of practitioners, but only 19.2% of subjects of sexual misconduct notifications were nurses or midwives (224 of 1167) (Box 4).
Of the 1167 subjects of sexual misconduct notifications, 881 (75.5%) were alleged to have engaged in sexual harassment (201 practitioners) or assault (680 practitioners); 286 (24.5%) were alleged to have had sexual relationships with patients.
Sources and outcomes of notifications of sexual misconduct
The proportion of sexual misconduct notifications lodged by fellow practitioners or employers (505 of 1507, 33.5%) was higher than for other misconduct notification types (9132 of 44 010, 20.8%). Affected patients lodged 506 sexual misconduct notifications (33.6%) and 16 005 notifications of other misconduct (36.4%) (Box 5).
A total of 709 cases of alleged sexual misconduct (47%) were closed by the end of 2016. A larger proportion of these closed cases (34.1%) led to regulatory sanctions than for other types of notifications (24.0%). Formal conditions, suspension or cancellation of registration were imposed in 139 of 709 closed sexual misconduct cases (20%) and lesser sanctions in 103 (15%) (Box 5). Among notifications lodged during 2011–2013 (ie, with at least three years’ follow‐up), 102 of 412 notifications (25%) led to registration sanctions.
Notifications regarding sexual relationships
Notifications regarding sexual relationships with patients were rare, and rates varied by sex, age, profession, medical specialty, and practice location. After adjusting for covariates, rates were higher for men than women (adjusted rate ratio [aRR], 6.48; 95% CI, 4.30–9.77) and for practitioners aged 46–55 years than for those under 36 years of age (aRR, 2.74; 95% CI, 1.77–4.25). Compared with internal medicine physicians, rates were higher for psychiatrists (aRR, 23.1; 95% CI, 7.69–69.0), psychologists (aRR, 13.4; 95% CI, 4.61–39.1), general practitioners (aRR, 7.19; 95% CI, 2.70–19.1), and chiropractors and osteopaths (aRR, 5.04; 95% CI, 1.56–16.3). The rate for practitioners in regional or rural localities was higher than for those in metropolitan areas (aRR, 1.73; 95% CI, 1.31–2.30) (Box 6).
Notifications regarding sexual harassment or assault
Rates of notification regarding sexual harassment or assault varied by sex, age, profession, and medical specialty. After adjusting for covariates, rates were higher for men than women (aRR, 37.1; 95% CI, 26.7–51.5) and for practitioners aged 36 years or more than for those under 36. Compared with internal medicine physicians, rates were higher for psychiatrists (aRR, 2.60; 95% CI, 1.55–4.36), chiropractors and osteopaths (aRR, 2.08; 95% CI, 1.26–3.42), and general practitioners (aRR, 1.94; 95% CI, 1.36–2.77). Rates were substantially lower for pharmacists (aRR, 0.11; 95% CI, 0.06–0.23), other allied health practitioners (aRR, 0.33; 95% CI, 0.20–0.55), and nurses and midwives (aRR, 0.46; 95% CI, 0.32–0.65). The rates for practitioners in regional or rural localities and metropolitan areas were similar (aRR, 1.05; 95% CI, 0.87–1.27) (Box 6).
Associations with age and sex were similar for notifications of sexual harassment and sexual assault when these notification subtypes were separately analysed. By health professional group, rates of notifications alleging sexual harassment were higher for obstetricians and gynaecologists, psychiatrists, and psychologists than for internal medicine physicians; rates of notifications alleging sexual assault were higher for chiropractors and osteopaths, psychiatrists, and general practitioners than for internal medicine physicians (Supporting Information, table).
Discussion
We analysed 1507 notifications alleging sexual misconduct by registered health practitioners in Australia during 2011–2016. In all, 1167 health practitioners, or 0.2% of registered health professionals, were subjects of such notifications; 208 practitioners were the subjects of more than one sexual misconduct notification during the six‐year period.
One‐third of sexual misconduct notifications were lodged by fellow practitioners or employers. Rates of notifications alleging sexual relationships with patients were higher for psychiatrists, psychologists, general practitioners, and chiropractors and osteopaths than for internal medicine physicians, and for practitioners working in regional and rural areas than for practitioners in metropolitan areas.
A large majority of notification subjects (88%) were men, consistent with the findings of other studies of sexual misconduct by health practitioners.12,22,23,24 Complaints about sexual misconduct by female practitioners were less frequent and, consistent with a study of boundary violations by female nurses,15 two‐thirds were about sexual relationships rather than sexual assault or harassment.
The adjusted rate ratio for sexual relationship notifications was highest for practitioners aged 46–55 years. The effects of ageing, career disappointments, and marital conflicts have been identified as common stress factors among psychotherapists who have violated professional boundaries.25
Our findings regarding the types of health professionals most frequently named in sexual relationship notifications are consistent with those of older North American studies which found that rates were higher for psychiatrists,22 psychologists,26 and general practitioners24 than for other physicians. These three specialties involve the disclosure of intimate information in the context of one‐to‐one, longitudinal treatment relationships, a situation in which the risks of inappropriate emotional involvement by the practitioner and of patient vulnerability may be especially high. Our finding that rates of notifications alleging sexual harassment or sexual assault were particularly high for chiropractors and osteopaths was consistent with an American report that the proportion of disciplinary cases involving sexual misconduct was twice as great for chiropractors as for all medical practitioners.17
Rates of notification about sexual harassment were higher for obstetricians and gynaecologists, psychologists, and psychiatrists than for internal medicine physicians. These specialties often involve asking questions about sexual function that may seem innocuous to practitioners but can cause offence to patients if not explained with sensitivity and respect. Nurses and midwifes provide close physical care, but their rates of sexual misconduct notifications were relatively low. This may reflect the team‐based nature of many nursing and midwifery roles or cultural differences in professional training.
Our study is the first to quantify the higher rate of notifications of sexual relationships for regional and rural practitioners than for those in metropolitan areas. Ethical tensions that can arise from the mixing of private and professional roles in small communities have been described by other authors.27
Under Australian law, employers and fellow practitioners are required to report sexual misconduct by health practitioners,21 perhaps explaining why employers and fellow practitioners were frequently the sources of such notifications. In closed cases, one‐third of sexual misconduct notifications led to regulatory sanctions. Sustaining such allegations is challenging, and regulators need to ensure that complainants have access to fair process and that the public is protected from harm.
Our study sheds new light on factors associated with notifications of sexual misconduct by health professionals, but further investigation is required. First, we need strategies for reducing barriers to notifying regulators of sexual misconduct. The Medical Board of Australia has recently established a national committee for responding to sexual misconduct notifications and has trained investigators with specialist expertise.3 Second, the connection between sexual misconduct and sexual harassment of colleagues should be investigated, with the twin goals of training practitioners to practise ethically and professionally and providing trustworthy processes for reporting and investigating unacceptable behaviour in the health professions. Finally, we need robust information about the effectiveness of regulatory interventions for preventing recurrent sexual misconduct.
Strengths and weaknesses
Our study expands the evidence base regarding notifications of sexual misconduct in health care in three important ways. First, we examined all allegations of sexual misconduct by registered health professionals reported to health regulators over six years. Second, including registration and clinical work time data facilitated a more sophisticated analysis than previous studies of sexual misconduct by health professionals. Third, we analysed notifications by misconduct type, and found important differences in the factors associated with each form of sexual misconduct.
However, our dataset only captured events reported to regulators, and therefore does not include all instances of sexual misconduct. Reported cases may differ systematically from unreported cases; patients who are vulnerable because of their age, ethnic background, or socio‐economic status are less likely to use formal complaint processes.28 Conversely, some notifications may not describe actual sexual misconduct, but rather misunderstandings, the results of poor communication, or false beliefs. Second, notification types were coded according to information recorded at lodgement; subsequent investigation may have identified further material not included in the initial notification. Third, we could not measure certain practitioner‐level variables associated with reports to regulators, including country of training.29 Fourth, we could not measure severity of harm, which ranges from mild (eg, discomfort caused by sexual remarks) to severe (eg, suicide). Finally, our study excluded professions not registered with Ahpra, such as social workers.
Conclusion
Patients, health care practitioners, and the public deserve focused efforts to prevent sexual misconduct in health care, fair and thorough investigation of allegations of sexual misconduct, and prompt and consistent action by regulators when misconduct is confirmed.
Box 1 – Categorisation of notifications to Australian regulators about sexual misconduct by health practitioners
|
Category |
Definition |
Example |
|||||||||||||
|
|
|||||||||||||||
|
Sexual relationships |
Engaging or seeking to engage in a sexual relationship with a patient, regardless of whether the practitioner believes the patient consented to the relationship |
A female psychologist counselled a patient at a drug and alcohol rehabilitation centre and kept in contact after he left. Later they met at a bar and they subsequently had sexual intercourse. The relationship lasted a few months, and they exchanged thousands of text messages. |
|||||||||||||
|
Sexual harassment |
Making sexual remarks including sexual humour or innuendo, asking irrelevant sexual questions, using words that are intended to arouse or gratify sexual desire |
A gynaecologist telephoned a patient at home and asked, “How is the pretty girl doing?” before inviting her to his home for dinner. |
|||||||||||||
|
Sexual assault |
Touching patients in a sexual way, engaging in sexual behaviour in front of a patient, conducting a physical examination that is not clinically indicated or after the patient has refused or withdrawn consent |
A male chiropractor touched a female patient's breast with no clinical justification and for his own gratification, and inappropriately exposed the buttocks of three other female patients during treatment. |
|||||||||||||
|
|
|||||||||||||||
|
|
|||||||||||||||
Box 3 – Registered health practitioners who were subjects of 1507 sexual misconduct notifications, Australia, 2011–2016, by numbers of notifications*
|
Number of notifications |
Subjects of notifications |
||||||||||||||
|
|
|||||||||||||||
|
1 |
959 (82.2%) |
||||||||||||||
|
2 |
142 (12.2%) |
||||||||||||||
|
3 |
40 (3.4%) |
||||||||||||||
|
4 |
18 (1.5%) |
||||||||||||||
|
5 or more |
8 (0.7%) |
||||||||||||||
|
Total |
1167 |
||||||||||||||
|
|
|||||||||||||||
|
* Number of practitioners for whom there were no notifications: 723 482 of 724 649. |
|||||||||||||||
Box 4 – Characteristics of registered health practitioners who were subjects of sexual misconduct notifications, Australia, 2011–2016
|
Characteristic |
All practitioners |
Subjects of sexual misconduct notifications |
|||||||||||||
|
Number |
Proportion of practitioners receiving notifications |
Proportion of all practitioners |
|||||||||||||
|
|
|||||||||||||||
|
Health practitioners |
724 649 |
1167 |
— |
0.16% |
|||||||||||
|
Sex |
|
|
|
|
|||||||||||
|
Women |
552 956 (76.3%) |
143 |
12.3% |
0.03% |
|||||||||||
|
Men |
171 693 (23.7%) |
1024 |
87.7% |
0.60% |
|||||||||||
|
Age (years) |
|
|
|
|
|||||||||||
|
Under 36 |
247 719 (34.2%) |
114 |
9.8% |
0.05% |
|||||||||||
|
36–45 |
154 453 (21.3%) |
217 |
18.6% |
0.14% |
|||||||||||
|
46–55 |
145 595 (20.1%) |
353 |
30.2% |
0.24% |
|||||||||||
|
56–65 |
125 317 (17.3%) |
277 |
23.7% |
0.22% |
|||||||||||
|
66 or more |
51 565 (7.1%) |
206 |
17.7% |
0.40% |
|||||||||||
|
Professional group |
|
|
|
|
|||||||||||
|
Medical practitioner |
114 556 (15.8%) |
655 |
56.1% |
0.57% |
|||||||||||
|
Internal medicine physician |
9334 (8.1%) |
55 |
8.4% |
0.59% |
|||||||||||
|
General practitioner |
26 653 (23.3%) |
297 |
45.3% |
1.11% |
|||||||||||
|
Obstetrician/gynaecologist |
2106 (1.8%) |
22 |
3.4% |
1.04% |
|||||||||||
|
Paediatrician |
2194 (1.9%) |
9 |
1.4% |
0.41% |
|||||||||||
|
Psychiatrist |
3708 (3.2%) |
57 |
8.7% |
1.54% |
|||||||||||
|
Radiologist/anaesthetist |
7495 (6.5%) |
12 |
1.8% |
0.16% |
|||||||||||
|
Surgeon/emergency/intensive care |
9348 (8.2%) |
50 |
7.6% |
0.53% |
|||||||||||
|
Other/non‐specialist |
53 718 (46.9%) |
153 |
23.4% |
0.28% |
|||||||||||
|
Nurse/midwife |
429 291 (59.2%) |
224 |
19.2% |
0.05% |
|||||||||||
|
Psychologist |
36 985 (5.1%) |
131 |
11.2% |
0.35% |
|||||||||||
|
Chiropractor/osteopath |
7558 (1.0%) |
56 |
4.8% |
0.74% |
|||||||||||
|
Physiotherapist |
31 169 (4.3%) |
32 |
2.7% |
0.10% |
|||||||||||
|
Dentist |
18 014 (2.5%) |
30 |
2.6% |
0.17% |
|||||||||||
|
Pharmacist |
33 226 (4.6%) |
10 |
0.9% |
0.03% |
|||||||||||
|
Other allied health practitioner |
53 850 (7.4%) |
29 |
2.5% |
0.05% |
|||||||||||
|
Practice location |
|
|
|
|
|||||||||||
|
Metropolitan |
544 804 (75.2%) |
883 |
75.7% |
0.16% |
|||||||||||
|
Regional/rural |
179 845 (24.8%) |
284 |
24.3% |
0.16% |
|||||||||||
|
|
|||||||||||||||
|
|
|||||||||||||||
Box 5 – Sources and outcomes of notifications of misconduct by health practitioners, Australia, 2011–2016
|
|
Notification type |
||||||||||||||
|
Sexual misconduct |
Other |
||||||||||||||
|
|
|||||||||||||||
|
Number of notifications* |
1507 |
44 010 |
|||||||||||||
|
Sexual relationship |
381 (25.3%) |
|
|||||||||||||
|
Sexual harassment or assault |
1126 (74.7%) |
|
|||||||||||||
|
Source of notification |
|
|
|||||||||||||
|
Patient |
506 (33.6%) |
16 005 (36.4%) |
|||||||||||||
|
Another health practitioner |
310 (20.6%) |
4906 (11.1%) |
|||||||||||||
|
Employer |
195 (12.9%) |
4226 (9.6%) |
|||||||||||||
|
Relative/friend/member of the public |
192 (12.7%) |
12 359 (28.1%) |
|||||||||||||
|
Other† |
252 (16.7%) |
5488 (12.5%) |
|||||||||||||
|
Missing source data |
52 (3.5%) |
1026 (2.3%) |
|||||||||||||
|
Closed cases |
709 |
23 855 |
|||||||||||||
|
Outcome of closed cases‡ |
|
|
|||||||||||||
|
No further action |
444 (62.6%) |
15 984 (67.0%) |
|||||||||||||
|
Referral to another body |
22 (3.1%) |
2088 (8.8%) |
|||||||||||||
|
Caution, reprimand, fine, undertaking |
103 (14.5%) |
3097 (13.0%) |
|||||||||||||
|
Registration conditions, suspension, cancellation |
139 (19.6%) |
2630 (11.0%) |
|||||||||||||
|
Missing outcome data |
1 (0.2%) |
56 (0.2%) |
|||||||||||||
|
Time to resolution (days), median (IQR)§ |
263 (90–572) |
104 (58–257) |
|||||||||||||
|
|
|||||||||||||||
|
IQR = interquartile range. * Some practitioners were subjects of more than one misconduct notification. † Police, government department, health regulator (eg, complaints commissioner; 2481 notifications: 135 sexual misconduct, 2346 other); self‐reported or regulator‐initiated (2400 notifications: 77 sexual misconduct, 2323 other); and anonymous reports (859 notifications: 40 sexual misconduct, 819 other). ‡ Excluded cases included those from one jurisdiction for which we did not have data on outcomes (14 638 cases: 484 sexual misconduct, 14 154 other), and those which were still open at the end of the study period (6315 cases: 314 sexual misconduct 6001 other). § 24 558 closed cases (excluded: six closed other notification type cases with missing time to complaint resolution date). |
|||||||||||||||
Box 6 – Multivariable analysis: 1507 notifications of sexual misconduct involving 1167 health practitioners, 2011–2016*
|
Characteristics |
Sexual relationship notifications |
Sexual harassment or assault notifications |
|||||||||||||
|
Rate per 10 000 practitioner‐years (95% CI) |
Adjusted rate ratio (95% CI) |
Rate per 10 000 practitioner‐years (95% CI) |
Adjusted rate ratio (95% CI) |
||||||||||||
|
|
|||||||||||||||
|
Sex |
|
|
|
|
|||||||||||
|
Women |
0.41 (0.34–0.49) |
1 |
0.22 (0.17–0.29) |
1 |
|||||||||||
|
Men |
3.43 (3.05–3.86) |
6.48 (4.30–9.77) |
13.2 (12.5–14.1) |
37.1 (26.7–51.5) |
|||||||||||
|
Age (years) |
|
|
|
|
|||||||||||
|
Under 36 |
0.47 (0.35–0.63) |
1 |
1.03 (0.84–1.26) |
1 |
|||||||||||
|
36–45 |
1.00 (0.81–1.25) |
1.79 (1.13–2.83) |
2.67 (2.33–3.06) |
2.07 (1.54–2.78) |
|||||||||||
|
46–55 |
1.63 (1.37–1.94) |
2.74 (1.77–4.25) |
4.17 (3.74–4.65) |
3.38 (2.53–4.53) |
|||||||||||
|
56–65 |
1.27 (1.02–1.57) |
1.74 (1.06–2.88) |
4.36 (3.86–4.87) |
3.23 (2.34–4.44) |
|||||||||||
|
66 or more |
2.28 (1.72–3.02) |
1.73 (0.72–4.11) |
9.91 (8.66–11.4) |
3.98 (2.34–6.77) |
|||||||||||
|
Professional group |
|
|
|
|
|||||||||||
|
Medical practitioner |
|
|
|
|
|||||||||||
|
Internal medicine physician |
0.93 (0.39–2.24) |
1 |
12.9 (10.2–16.3) |
1 |
|||||||||||
|
General practitioner |
6.41 (5.25–7.84) |
7.19 (2.70–19.1) |
21.9 (19.6–24.4) |
1.94 (1.36–2.77) |
|||||||||||
|
Obstetrician/gynaecologist |
1.72 (0.43–6.86) |
1.98 (0.33–11.8) |
19.7 (13.1–29.7) |
1.64 (0.85–3.15) |
|||||||||||
|
Paediatrician |
0.80 (0.11–5.68) |
1.09 (0.11–10.5) |
9.60 (5.45–16.9) |
1.02 (0.47–2.21) |
|||||||||||
|
Psychiatrist |
15.2 (10.7–21.6) |
23.1 (7.69–69.0) |
25.6 (19.6–33.5) |
2.60 (1.55–4.36) |
|||||||||||
|
Radiologist/anaesthetist |
— |
— |
2.84 (1.61–5.00) |
0.22 (0.11–0.43) |
|||||||||||
|
Surgeon/emergency/intensive care |
1.13 (0.51–2.52) |
1.01 (0.28–3.63) |
9.61 (7.31–12.6) |
0.60 (0.38–0.96) |
|||||||||||
|
Other/non‐specialist |
2.24 (1.67–3.01) |
3.80 (1.36–10.6) |
8.91 (7.68–10.3) |
1.38 (0.93–2.03) |
|||||||||||
|
Nurse/midwife |
0.38 (0.31–0.48) |
1.23 (0.46–3.25) |
0.86 (0.74–1.00) |
0.46 (0.32–0.65) |
|||||||||||
|
Psychologist |
5.02 (4.08–6.18) |
13.4 (4.61–39.1) |
4.17 (3.32–5.24) |
1.13 (0.70–1.84) |
|||||||||||
|
Chiropractor/osteopath |
3.58 (2.08–6.17) |
5.04 (1.56–16.3) |
16.0 (12.4–20.7) |
2.08 (1.26–3.42) |
|||||||||||
|
Physiotherapist |
0.56 (0.28–1.12) |
1.24 (0.38–4.11) |
2.16 (1.52–3.08) |
0.60 (0.36–1.00) |
|||||||||||
|
Dentist |
0.58 (0.24–1.40) |
0.71 (0.19–2.63) |
3.73 (2.64–5.27) |
0.37 (0.23–0.61) |
|||||||||||
|
Pharmacist |
0.07 (0.01–0.46) |
0.12 (0.01–1.05) |
0.65 (0.35–1.20) |
0.11 (0.06–0.23) |
|||||||||||
|
Other allied health practitioner |
0.14 (0.05–0.44) |
0.33 (0.07–1.45) |
1.26 (0.87–1.8) |
0.33 (0.20–0.55) |
|||||||||||
|
Practice location |
|
|
|
|
|||||||||||
|
Metropolitan |
1.03 (0.92–1.17) |
1 |
3.50 (3.28–3.74) |
1 |
|||||||||||
|
Regional/rural |
1.43 (1.19–1.70) |
1.73 (1.31–2.30) |
2.89 (2.55–3.27) |
1.05 (0.87–1.27) |
|||||||||||
|
|
|||||||||||||||
|
CI = confidence interval. * For 381 sexual relationship notifications and 1126 sexual harassment and assault notifications; adjusted for sex, age, profession, medical specialty, practice location, clinical hours per week, and state/territory. |
|||||||||||||||
Received 5 November 2019, accepted 7 April 2020
- Marie M Bismark1
- David M Studdert2
- Katinka Morton3
- Ron Paterson4
- Matthew J Spittal1
- Yamna Taouk1
- 1 Melbourne School of Population and Global Health, University of Melbourne, Melbourne, VIC
- 2 Center for Health Policy, Freeman Spogli Institute for International Studies, Stanford University, Stanford, CA, United States of America
- 3 Perth Children's Hospital, Perth, WA
- 4 The University of Auckland, Auckland, New Zealand
Our investigation was funded by a National Health and Medical Research Council Partnership Grant (1092933), a National Health and Medical Research Council Early Career Fellowship, and an Avant Patient Safety Foundation Grant to Marie Bismark. The Australian Health Practitioner Regulation Agency (Ahpra) and the Health Professional Councils Authority provided data for the study.
Ron Paterson was funded by Ahpra to conduct an independent review of the use of chaperones to protect patients in Australia (2017) and to evaluate the implementation of the recommendations of the review.
- 1. Medical Board of Australia. Sexual boundaries in the doctor–patient relationship. Dec 2018. https://www.medicalboard.gov.au/Codes-Guidelines-Policies/Sexual-boundaries-guidelines.aspx (viewed Feb 2020).
- 2. Morton K. Professional sexual misconduct as a breach of trustworthiness: a moral typology of doctors who have engaged in professional sexual misconduct. PhD thesis: University of Melbourne, 2012. https://minerva-access.unimelb.edu.au/handle/11343/37765 (viewed Feb 2020).
- 3. Paterson R. Independent review of the use of chaperones to protect patients in Australia. Melbourne: Australian Health Practitioner Regulation Agency, 2017. https://nhpopc.gov.au/wp-content/uploads/Chaperone-review-report-WEB.pdf (viewed Feb 2020).
- 4. Gartrell NK, Milliken N, Goodson WH, et al. Physician–patient sexual contact. Prevalence and problems. West J Med 1992; 157: 139–143.
- 5. Spittal MJ, Studdert DM, Paterson R, Bismark MM. Outcomes of notifications to health practitioner boards: a retrospective cohort study. BMC Med 2016; 14: 198.
- 6. Taylor SC, Gassner L. Stemming the flow: challenges for policing adult sexual assault with regard to attrition rates and under‐reporting of sexual offences. Police Practice and Research 2010; 11: 240–255.
- 7. Wilbers D, Veenstra G, Van de Wiel HB, Schultz WC. Sexual contact in the doctor–patient relationship in the Netherlands. BMJ 1992; 304: 1531–1534.
- 8. Galletly CA. Crossing professional boundaries in medicine: the slippery slope to patient sexual exploitation. Med J Aust 2004; 181: 380–383. https://www.mja.com.au/journal/2004/181/7/crossing-professional-boundaries-medicine-slippery-slope-patient-sexual
- 9. Leggett A. A survey of Australian psychiatrist's attitudes and practices regarding physical contact with patients. Aust N Z J Psychiatry 1994; 28: 488–497.
- 10. Dehlendorf CE, Wolfe SM. Physicians disciplined for sex‐related offenses. JAMA 1998; 279: 1883–1888.
- 11. Lamb DH, Catanzaro SJ, Moorman AS. Psychologists reflect on their sexual relationships with clients, supervisees, and students. Prof Psychol Res Pr 2003; 34: 102–107.
- 12. Schoener GR, Milgrom JH, Gonsiorek JC, et al. Psychotherapists’ sexual involvement with clients: intervention and prevention. Minneapolis: Walk‐in Counseling Centre, 1990.
- 13. Stake JE, Oliver J. Sexual contact and touching between therapist and client: a survey of psychologists’ attitudes and behavior. Prof Psychol Res Pr 1991; 22: 297.
- 14. Wincze JP, Richards J, Parsons J, Bailey S. A comparative survey of therapist sexual misconduct between an American state and an Australian state. Prof Psychol Res Pr 1996; 27: 289.
- 15. Chiarella M, Adrian A. Boundary violations, gender and the nature of nursing work. Nurs Ethics 2014; 21: 267–277.
- 16. Campbell RJ, Yonge O, Austin W. Intimacy boundaries: between mental health nurses & psychiatric patients. J Psychosocial Nurs Ment Health Serv 2005; 43: 32–39.
- 17. Foreman SM, Stahl MJ. Chiropractors disciplined by a state chiropractic board and a comparison with disciplined medical physicians. J Manipulative Physiol Ther 2004; 27: 472–477.
- 18. Soundy A, Stubbs B, Jenkins S, Cooper I. Sexual professional boundaries perceived by undergraduate and graduate physiotherapists: a cross sectional survey. Physiotherapy 2013; 99: 298–304.
- 19. Searle RH, Rice C, McConnell A, Dawson JF. Bad apples? Bad barrels? Or bad cellars? Antecedents and processes of professional misconduct in UK health and social care: insights into sexual misconduct and dishonesty. Coventry: Professional Standards Agency, 2017. https://www.professionalstandards.org.uk/docs/default-source/publications/research-paper/antecedents-and-processes-of-professional-misconduct-in-uk-health-and-social-care.pdf (viewed Feb 2020).
- 20. Australian Health Practitioner Regulation Agency. Guidelines: Mandatory notifications about registered health practitioners. Updated Mar 2020. https://www.ahpra.gov.au/Notifications/Raise-a-concern/Mandatory-notifications.aspx (viewed June 2020).
- 21. Bismark MM, Spittal MJ, Plueckhahn TM, Studdert DM. Mandatory reports of concerns about the health, performance and conduct of health practitioners. Med J Aust 2014; 201: 399–403. https://www.mja.com.au/journal/2014/201/7/mandatory-reports-concerns-about-health-performance-and-conduct-health
- 22. Morrison J, Morrison T. Psychiatrists disciplined by a state medical board. Am J Psychiatry 2001; 158: 474–478.
- 23. AbuDagga A, Wolfe SM, Carome M, Oshel RE. Cross‐sectional analysis of the 1039 US physicians reported to the national practitioner data bank for sexual misconduct, 2003–2013. PLoS One 2016; 11: e0147800.
- 24. Enbom JA, Thomas CD. Evaluation of sexual misconduct complaints: the Oregon Board of Medical Examiners, 1991 to 1995. Am J Obstet Gynecol 1997; 176: 1340–1348.
- 25. Norris DM, Gutheil TG, Strasburger LH. This couldn't happen to me: boundary problems and sexual misconduct in the psychotherapy relationship. Psychiatr Serv 2003; 54: 517–522.
- 26. Lamb DH, Catanzaro SJ, Moorman AS. Psychologists reflect on their sexual relationships with clients, supervisees, and students: occurrence, impact, rationales and collegial intervention. Prof Psychol Res Pr 2003; 34: 102–107.
- 27. Purtilo R, Sorrell J. The ethical dilemmas of a rural physician. Hastings Cent Rep 1986; 16(4): 24–28.
- 28. Bismark MM, Brennan TA, Paterson RJ, et al. Relationship between complaints and quality of care in New Zealand: a descriptive analysis of complainants and non‐complainants following adverse events. Qual Saf Health Care 2006; 15: 17–22.
- 29. Elkin K, Spittal MJ, Studdert DM. Risks of complaints and adverse disciplinary findings against international medical graduates in Victoria and Western Australia. Med J Aust 2012; 197: 448–452. https://www.mja.com.au/journal/2012/197/8/risks-complaints-and-adverse-disciplinary-findings-against-international-medical
Abstract
Objectives: To assess the numbers of notifications to health regulators alleging sexual misconduct by registered health practitioners in Australia, by health care profession.
Design, setting: Retrospective cohort study; analysis of Australian Health Practitioner Regulation Agency and NSW Health Professional Councils Authority data on notifications of sexual misconduct during 2011–2016.
Participants: All registered practitioners in 15 health professions.
Main outcome measures: Notification rates (per 10 000 practitioner‐years) and adjusted rate ratios (aRRs) by age, sex, profession, medical specialty, and practice location.
Results: Regulators received 1507 sexual misconduct notifications for 1167 of 724 649 registered health practitioners (0.2%), including 208 practitioners (18%) who were the subjects of more than one report during 2011–2016; 381 notifications (25%) alleged sexual relationships, 1126 (75%) sexual harassment or assault. Notifications regarding sexual relationships were more frequent for psychiatrists (15.2 notifications per 10 000 practitioner‐years), psychologists (5.0 per 10 000 practitioner‐years), and general practitioners (6.4 per 10 000 practitioner‐years); the rate was higher for regional/rural than metropolitan practitioners (aRR, 1.73; 95% CI, 1.31–2.30). Notifications of sexual harassment or assault more frequently named male than female practitioners (aRR, 37.1; 95% CI, 26.7–51.5). A larger proportion of notifications of sexual misconduct than of other forms of misconduct led to regulatory sanctions (242 of 709 closed cases [34%] v 5727 of 23 855 [24%]).
Conclusions: While notifications alleging sexual misconduct by health practitioners are rare, such misconduct has serious consequences for patients, practitioners, and the community. Further efforts are needed to prevent sexual misconduct in health care and to ensure thorough investigation of alleged misconduct.