


The known: Hospital in the home (HIH) is a safe, effective, and acceptable alternative to in‐hospital care. Data on its broad impact on the Australian health system are limited.
The new: During 2011–2017, 80 167 HIH admissions comprised 3.7% of hospital admissions. Median length of stay was longer for HIH admissions, but they were less likely to involve re‐admission or death. HIH admission numbers grew more rapidly than overall admission numbers (3.1% v 1.6% per quarter).
The implications: Australian hospital care delivered as HIH is growing, and its use could be extended to clinical areas in which it is not currently employed.
The core aim of the hospital in the home (HIH) concept is to provide the skills, technologies, and support needed for treating patients at home who would otherwise require admission to hospital.1 This principle has underlain the establishment and growth of HIH in Australia since 1994 and its funding at levels closer to those of hospital than community care; in Victoria, HIH comprises about 5% of inpatient activity.2,3 Adoption of the HIH model has been facilitated by favourable funding arrangements; in most Australian states it is categorised as inpatient care, and hospitals are correspondingly reimbursed for providing it.
Many studies and some systematic reviews have reported the safety, clinical benefits, acceptance, and cost‐effectiveness of HIH for patients with certain conditions.4,5,6,7,8,9,10,11,12,13 However, hospital or health system level data regarding the influence of HIH on overall hospital activity are limited. An opportunistic study in Jerusalem found that hospitalisations of health fund members over 65 years of age increased in number after a large acute home‐based program was closed.14
The studies included in meta‐analyses of HIH care have often been small, and many were initiation studies; that is, studies in newly established units, or involving new systems within units. Further, the variety of models and providers of HIH complicate systematic review. Comprehensive, multi‐site, long term HIH database analyses have been few.
As investment in HIH care in Australia has been considerable, it would be valuable to examine where HIH activity has been undertaken. Its implementation depends on skills and technologies that enable the acute treatment of certain clinical conditions at home, as well as its acceptance by hospital clinicians.
Our study aimed to describe the uptake of HIH by major Australian hospitals and the characteristics of patients and their HIH admissions. Our secondary aim was to assess the change in the number of HIH admissions over 7 years relative to total hospital activity. We sought to provide a broad overview of the impact of HIH in a national health system in which it is particularly prominent.
Methods
We undertook a descriptive, retrospective study of HIH activity, analysing previously collected hospital activity census data.
Data source
The Health Roundtable (https://home.healthroundtable.org) is a Sydney‐based non‐profit organisation of 90 health services and 177 hospitals in Australia and New Zealand. It receives, analyses, and publishes information about member services, and assists identify how operational practices can be improved by collaboration, benchmarking, and networking of health organisations and their clinicians and executives.
We analysed hospital inpatient activity data submitted to the Health Roundtable by member hospitals in Australia. These data are identical with those forwarded to state health authorities for funding and management purposes, and to the Independent Health Pricing Agency for determining cost weights.
In order to reduce variability related to hospital size, we restricted our analysis to data from principal referrer hospitals, defined by the Australian Institute of Health and Welfare as providing a very broad range of services and having very large patient volumes; most have intensive care, cardiac surgery, neurosurgery, and infectious diseases units, as well as 24‐hour emergency departments.15,16 Hospitals were de‐identified in the dataset by the Health Roundtable before it was provided to the authors.
Data analysed
We analysed hospital, HIH status, and diagnosis‐related group (DRG) data for multi‐day admissions during the period 1 January 2011 – 31 December 2017; same day admissions were excluded. Patient sex and age, lengths of stay for HIH and non‐HIH admissions, mortality during admission, re‐admission within 28 days, and complexity of medical condition were included in the dataset. Hospitals were included if they provided at least two years’ data; DRGs were included if data for at least 100 events and two years’ data were available.
As HIH is not uniformly applied across all areas of hospital activity, we restricted our main analysis to HIH activity in the 50 DRGs in which the proportions of admissions including an HIH component (ie, admissions in which patients spent at least part of the episode as HIH patients) were greatest.
Pure hospital in the home admissions
Pure HIH admissions were defined as admissions with no more than 0.25 days of non‐HIH care; that is, all or almost all inpatient care was provided as HIH care.
Changes in hospital in the home activity
To examine relative changes in HIH activity over the study period, data on admissions for the 50 DRGs with greatest HIH activity were aggregated by 3‐month periods and compared separately with total hospital activity data for the same 50 DRGs and with total hospital activity data for all DRGs. Only data from hospitals providing 7 complete years of data were included in this analysis.
Statistical analysis
Time variables are summarised as medians with interquartile ranges (IQRs), as the data were skewed; categorical variables are summarised as numbers and proportions with 95% confidence intervals (CIs) calculated using the normal approximation to the binomial distribution. The statistical significance of differences between HIH and non‐HIH admissions was assessed in a fixed effects regression model adjusted for correlation of repeated observations within hospital.
Mean quarterly changes in the number of patients classified as HIH patients in each DRG at each hospital were estimated by linear regression;17 the outcome was the number of patients classified as HIH patients and the only predictor was year quarter. The models were fitted within a generalised estimating equation (GEE) framework and adjusted for clustering within hospital, with an autoregressive correlation structure and robust variance estimator.18 Absolute change in the number of HIH patients was estimated in linear models; the mean quarterly change in the number of all admissions was estimated in a similar model.
The mean proportional change per quarter in the number of admissions in each DRG at each hospital was estimated in Poisson regression models similar to the linear models, but including a log‐link function and assuming a Poisson distribution of number of events by quarter.
Statistical analyses were performed in R 3.4.2; GEEs were fitted with the geeglm function in the geepack library.
Ethics approval
Ethics approval was sought from the Epworth Health Care Human Research and Ethics Committee. Approval was also granted by the Board of the Health Roundtable (Approval for Research Activities by Member Organisations).
Results
Sample population
Data on 2 221 091 hospital admissions from 20 principal referrer hospitals with HIH activity were provided by the Health Roundtable. One hospital provided data only for 2017 and was excluded (15 223 admissions). After excluding DRGs with fewer than 100 episodes and incomplete episodes, data for 2 185 421 hospital admissions to 19 hospitals across 96 DRGs were available.
There were 80 167 HIH admissions (3.7% of all admissions; 95% CI, 3.6–3.7%). The median length of stay for admissions including an HIH component (7.3 days; IQR, 3.1–14 days) was longer than for those that did not (2.7 days; IQR, 1.6–5.1 days). The median length of stay as an HIH inpatient was 5.0 days (IQR, 2.0–9.0 days). The age distribution of patients with HIH admissions differed from that of non‐HIH patients, with a smaller proportion aged 0–34 years and a larger proportion aged 50–79 years. The proportion of men was higher for HIH care than non‐HIH care (54.4% v 45.9%). The proportion of patients who died in hospital was lower for HIH than non‐HIH care (0.3% v 1.4%), and re‐admission within 28 days was less frequent (2.3% v 3.6%). The proportion of conditions coded as complex (category A) was higher for HIH than non‐HIH admissions (36.1% v 35.4%) (Box 1).
Diagnosis‐related groups with greatest hospital in the home activity
DRGs were ranked according to the proportion of patients who spent some time in HIH care (Supporting Information). Fifty DRGs encompassed 65 811 HIH admissions (82.1% of all HIH admissions; 95% CI, 81.9–82.4%) (Box 2), or 8.4% (95% CI, 8.4–8.5%) of all 780 549 admissions for these DRGs.
Pure hospital in the home admissions
A total of 30 901 HIH admissions (38.5% of all HIH admissions) had non‐HIH components of 0.25 days or less (Supporting Information).
Change in hospital in the home activity
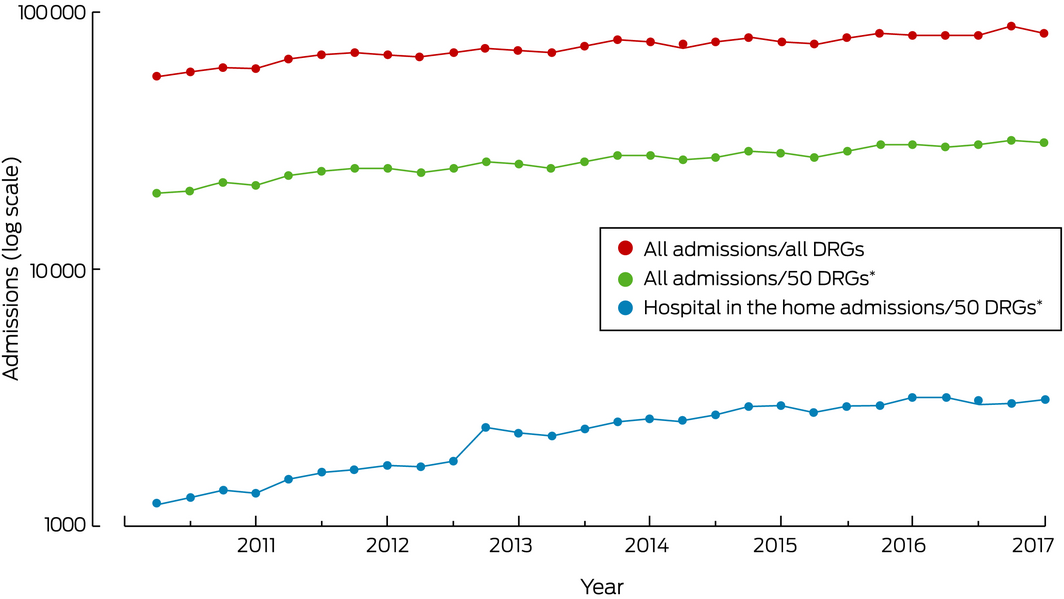
Data from the seventeen hospitals that provided data for each year of the study period were included in our analysis of change in HIH activity (Box 3). For the 50 DRGs with greatest HIH activity, the number of HIH admissions increased by a mean 3.1% (95% CI, 1.7–5.1%) per quarter; the overall number of admissions in these DRGs increased by a mean 1.6% (95% CI, 1.3–1.9%) per quarter.
Discussion
Our large study of national hospital activity measured both HIH and non‐HIH activity by DRG in 19 hospitals across Australia, where HIH interventions are more prominent than in most health systems. Our findings offer useful insights into the features of HIH activity and its impact on hospital activity for hospital planners, both locally and overseas.
The median length of hospital care was greater in our study for HIH patients and was associated with reduced mortality and lower rates of re‐admission. HIH may itself contribute to this finding, but it is also likely that HIH is selected when longer admissions are anticipated. Apart from initial severity of disease or slowness to respond to treatment, HIH may also be preferred because of factors such as age, obesity, diabetes, immunosuppression, living in residential care, or previous admissions for similar indications. Similarly, HIH may contribute to better outcomes, but patients for whom good outcomes are expected are probably preferred candidates for acute home‐based care.12
The 50 DRGs with greatest HIH activity included infections, venous thromboembolism, cancer, and major surgical procedures. While HIH was involved in 3.7% of all multi‐day hospital admissions, the rate was 8.4% for conditions for which HIH care is more suitable (or accepted), a considerable proportion of hospital workload, activity, and reimbursement. Our analysis indicates that HIH is a generalist hospital intervention, drawing from the inpatient workload of several specialties, but the impact of HIH on the inpatient management of infectious diseases was particularly notable. This may reflect the technical and organisational capacity to deliver a wide range of antimicrobial treatments safely and efficiently at home, or greater acceptance of the role of HIH among infectious diseases specialists.
We found that the traditional hospital stay was brief or even absent for more than one‐third of all admissions including an HIH component, perhaps because patients were admitted to HIH directly from hospital emergency departments or rapid assessment units, by general practitioners or hospital outpatient services, or from other hospitals. While there are clinical, risk management, and logistic challenges associated with this approach to HIH care, it may benefit patients and the health system in general.
Some DRGs with higher levels of HIH activity were surprising. The inclusion of colonoscopy (HIH component, 2.9%) and bronchoscopy (3.5%) in the top 50 DRGs for HIH may reflect the need to manage peri‐procedural anticoagulation in some patients. The inclusion of sleep apnoea (10.9%) is even more difficult to explain, and suggests that hospitals may code an outpatient service as an inpatient service; HIH is open to such manipulation in the absence of clear guidelines and auditing.
HIH activity grew during the study period, the number of patients increasing at almost twice the rate for all admissions. Although the difference was not statistically significant, it shows that HIH is an important feature in the expansion of hospital capacity and activity in Australia, and the community should be aware that more acute hospital services are likely to be delivered as HIH care in future.
On the other hand, our study has highlighted the fact that HIH activity can be increased both in areas where HIH already works as well as in others in which it does not yet play a prominent role, including the treatment of cardiac failure and of cancer and its complications. For many conditions, the technical and organisational capacity to deliver acute care is available, but the patients may be generally more unstable during their admission, or HIH is currently not broadly accepted by clinicians in these specialty groups.
Limitations
Bias is possible even in a primarily descriptive analysis such as ours. Coding is subject to local and regional variation, and can be influenced by clinician interpretation and reimbursement models and incentives. The generalisability of our findings to all principal referrer hospitals in Australia is subject to several caveats. In Western Australia and Tasmania, HIH activity is probably not recorded as inpatient hospital admissions (personal communication, Kate Tynan, Health Roundtable, 18 October 2018). Several mainland hospitals are not members of the Health Roundtable and could not be included in the dataset. As we could not identify the included hospitals, we could not assess differences between the hospitals that were or were not included in our analysis. Without information about the HIH models of the included hospitals, we could not assess their relationship with differences in activity and other outcomes.
Our study was possible because HIH is delivered in most Australian states by hospitals, and because these hospitals report activity data. When HIH is delivered by non‐hospital organisations, there is a risk of fragmentation (or even lack) of comprehensive activity reporting. It is important for recognising, developing, and evaluating HIH (in Australia and overseas) that a comprehensive dataset of HIH activity be maintained.
Conclusion
The funding and organisational effort required to establish and support HIH is considerable, and policymakers in acute health and hospital services need to be convinced of its tangible benefits for both patients and health systems. We found that HIH plays an important and growing role in care for patients with a range of hospital diagnoses. The challenge for health systems is to expand its role further and, more importantly, to carefully determine clinical areas in which HIH may be useful but is currently unused. As with specialist intensive care and emergency medicine, introduced during the 1960s, HIH could develop into a non‐organ‐specific hospital specialist service with a significant and lasting impact on hospital services, organisation, and funding.
Box 1 – Baseline characteristics of patients and their admissions, by hospital in the home (HIH) status
|
Characteristic |
Hospital in the home (any)* |
|
|||||||||||||
|
No |
Yes |
P † |
|||||||||||||
|
|
|||||||||||||||
|
Number of admissions |
2 105 254 |
80 167 |
|
||||||||||||
|
Length of stay (days), median (IQR) |
2.7 (1.6–5.1) |
7.3 (3.1–14) |
< 0.001 |
||||||||||||
|
Hospital length of stay (days), median (IQR) |
2.7 (1.6–5.1) |
0.7 (0.3–5.1) |
< 0.001 |
||||||||||||
|
HIH length of stay (days), median (IQR) |
NA |
5.0 (2.0–9.0) |
|
||||||||||||
|
Age group (years) |
|
|
< 0.001 |
||||||||||||
|
0 |
258 522 (12.3%) |
1432 (1.8%) |
|
||||||||||||
|
1–16 |
82 051 (3.9%) |
2103 (2.6%) |
|
||||||||||||
|
17–34 |
412 148 (19.6%) |
10 071 (12.6%) |
|
||||||||||||
|
35–49 |
262 886 (12.5%) |
12 231 (15.3%) |
|
||||||||||||
|
50–64 |
332 435 (15.8%) |
19 399 (24.2%) |
|
||||||||||||
|
65–79 |
447 053 (21.2%) |
23 254 (29.0%) |
|
||||||||||||
|
80 or more |
310 159 (14.7%) |
11 677 (14.6%) |
|
||||||||||||
|
Sex |
|
|
< 0.001 |
||||||||||||
|
Women |
1 138 142 (54.1%) |
36 550 (45.6%) |
|
||||||||||||
|
Men |
967 112 (45.9%) |
43 617 (54.4%) |
|
||||||||||||
|
Type of admission I |
|
|
< 0.001 |
||||||||||||
|
Emergency |
1 315 761 (62.5%) |
41 725 (52.0%) |
|
||||||||||||
|
Planned |
671 204 (31.9%) |
35 534 (44.3%) |
|
||||||||||||
|
Unassigned |
118 289 (5.6%) |
2908 (3.6%) |
|
||||||||||||
|
Type of admission II |
|
|
< 0.001 |
||||||||||||
|
Medical |
1 624 251 (77.2%) |
62 638 (78.1%) |
|
||||||||||||
|
Surgical |
372 336 (17.7%) |
15 592 (19.4%) |
|
||||||||||||
|
Other |
108 667 (5.2%) |
1937 (2.4%) |
|
||||||||||||
|
Died in hospital |
|
|
< 0.001 |
||||||||||||
|
No |
2 075 354 (98.6%) |
79 912 (99.7%) |
|
||||||||||||
|
Yes |
29 900 (1.4%) |
255 (0.3%) |
|
||||||||||||
|
Re‐admitted within 28 days |
|
|
< 0.001 |
||||||||||||
|
No |
2 030 109 (96.4%) |
78 328 (97.7%) |
|
||||||||||||
|
Yes |
75 145 (3.6%) |
1839 (2.3%) |
|
||||||||||||
|
Complexity of medical condition |
|
|
< 0.001 |
||||||||||||
|
Category A |
745 614 (35.4%) |
28 930 (36.1%) |
|
||||||||||||
|
Other |
1 359 640 (64.6%) |
51 237 (63.9%) |
|
||||||||||||
|
|
|||||||||||||||
|
IQR = interquartile range; NA = not applicable. * That is, admission included a period of hospital in the home care. † Generalised estimating equations. |
|||||||||||||||
Box 2 – The fifty diagnosis‐related groups with the largest proportions of admissions including hospital in the home (HIH) care
|
Diagnosis‐related group |
Admissions |
||||||||||||||
|
Total |
HIH |
HIH proportion (95% CI) |
|||||||||||||
|
|
|||||||||||||||
|
|
Total number of admissions |
780 549 |
65 811 |
|
|||||||||||
|
I67 |
Septic arthritis |
1356 |
453 |
33.4% (30.9–35.9%) |
|||||||||||
|
I64 |
Osteomyelitis |
4182 |
1317 |
31.5% (30.1–32.9%) |
|||||||||||
|
F63 |
Venous thrombosis |
7856 |
2469 |
31.4% (30.4–32.5%) |
|||||||||||
|
G60 |
Digestive malignancy |
11 174 |
3361 |
30.1% (29.2–30.9%) |
|||||||||||
|
F61 |
Infective endocarditis |
1653 |
494 |
29.9% (27.7–32.1%) |
|||||||||||
|
Z63 |
Other follow‐up after surgery or medical care |
5543 |
1429 |
25.8% (24.6–26.9%) |
|||||||||||
|
J64 |
Cellulitis |
63 575 |
13 488 |
21.2% (20.9–21.5%) |
|||||||||||
|
E60 |
Cystic fibrosis |
9111 |
1714 |
18.8% (18.0–19.6%) |
|||||||||||
|
I73 |
Aftercare of musculoskeletal implants or prostheses |
4337 |
774 |
17.8% (16.7–19.0%) |
|||||||||||
|
H61 |
Malignancy of hepatobiliary system and pancreas |
8141 |
1365 |
16.8% (16.0–17.6%) |
|||||||||||
|
T64 |
Other infectious and parasitic diseases |
6673 |
1056 |
15.8% (14.9–16.7%) |
|||||||||||
|
E61 |
Pulmonary embolism |
13 230 |
2011 |
15.2% (14.6–15.8%) |
|||||||||||
|
I12 |
Miscellaneous musculoskeletal procedures for infection or inflammation of bone and joint |
11 667 |
1706 |
14.6% (14.0–15.3%) |
|||||||||||
|
B68 |
Multiple sclerosis and cerebellar ataxia |
4977 |
679 |
13.6% (12.7–14.6%) |
|||||||||||
|
T01 |
Infectious and parasitic diseases with major general interventions |
10 732 |
1192 |
11.1% (10.5–11.7%) |
|||||||||||
|
E63 |
Sleep apnoea |
22 534 |
2467 |
10.9% (10.5–11.4%) |
|||||||||||
|
J06 |
Major procedures for breast disorders |
12 810 |
1368 |
10.7% (10.1–11.2%) |
|||||||||||
|
T61 |
Postoperative and post‐traumatic infections |
11 215 |
1101 |
9.8% (9.3–10.4%) |
|||||||||||
|
J60 |
Skin ulcers |
4126 |
404 |
9.8% (8.9–10.7%) |
|||||||||||
|
I72 |
Specific musculotendinous disorders |
6870 |
646 |
9.4% (8.7–10.1%) |
|||||||||||
|
R02 |
Other neoplastic disorders with major general interventions |
3858 |
355 |
9.2% (8.3–10.1%) |
|||||||||||
|
B72 |
Nervous system infection except viral meningitis |
3919 |
360 |
9.2% (8.3–10.1%) |
|||||||||||
|
F06 |
Coronary bypass without invasive cardiac investigation |
19 031 |
1601 |
8.4% (8.0–8.8%) |
|||||||||||
|
K01 |
General interventions for diabetic complications |
6215 |
521 |
8.4% (7.7–9.1%) |
|||||||||||
|
J12 |
Lower limb procedures with ulcer or cellulitis |
2668 |
220 |
8.2% (7.2–9.3%) |
|||||||||||
|
F04 |
Cardiac valve procedures with cardiopulmonary bypass pump without invasive cardiac investigation |
15 927 |
1311 |
8.2% (7.8–8.7%) |
|||||||||||
|
J63 |
Non‐malignant breast disorders |
2185 |
160 |
7.3% (6.2–8.4%) |
|||||||||||
|
I04 |
Knee replacement |
22 057 |
1599 |
7.2% (6.9–7.6%) |
|||||||||||
|
R60 |
Acute leukaemia |
10 755 |
736 |
6.8% (6.4–7.3%) |
|||||||||||
|
L67 |
Other kidney and urinary tract disorders |
19 329 |
1295 |
6.7% (6.3–7.1%) |
|||||||||||
|
T60 |
Septicaemia |
31 253 |
2055 |
6.6% (6.3–6.9%) |
|||||||||||
|
J67 |
Minor skin disorders |
7461 |
395 |
5.3% (4.8–5.8%) |
|||||||||||
|
G11 |
Anal and stomal procedures |
11 986 |
631 |
5.3% (4.9–5.7%) |
|||||||||||
|
I03 |
Hip replacement |
25 986 |
1367 |
5.3% (5.0–5.5%) |
|||||||||||
|
Z64 |
Other factors influencing health status |
15 715 |
775 |
4.9% (4.6–5.3%) |
|||||||||||
|
E71 |
Respiratory neoplasms |
12 613 |
593 |
4.7% (4.3–5.1%) |
|||||||||||
|
J08 |
Other skin grafts and debridement procedures |
13 094 |
582 |
4.4% (4.1–4.8%) |
|||||||||||
|
Q62 |
Coagulation disorders |
5114 |
225 |
4.4% (3.8–5.0%) |
|||||||||||
|
D66 |
Other ear nose mouth and throat disorders |
11 128 |
484 |
4.3% (4.0–4.7%) |
|||||||||||
|
J11 |
Other skin subcutaneous tissue and breast procedures |
6379 |
272 |
4.3% (3.8–4.8%) |
|||||||||||
|
L63 |
Kidney and urinary tract infections |
53 124 |
2135 |
4.0% (3.9–4.2%) |
|||||||||||
|
F75 |
Other circulatory disorders |
24 992 |
1002 |
4.0% (3.8–4.3%) |
|||||||||||
|
X63 |
Sequelae of treatment |
21 045 |
782 |
3.7% (3.5–4.0%) |
|||||||||||
|
E42 |
Bronchoscopy |
9521 |
337 |
3.5% (3.2–3.9%) |
|||||||||||
|
E65 |
Chronic obstructive airways disease |
53 478 |
1857 |
3.5% (3.3–3.6%) |
|||||||||||
|
P66 |
Neonate admission weight 2000–2499 g without significant general intervention or ventilation for 96 h or more |
12 814 |
438 |
3.4% (3.1–3.7%) |
|||||||||||
|
E62 |
Respiratory infections and inflammations |
76 476 |
2478 |
3.2% (3.1–3.4%) |
|||||||||||
|
X06 |
Other procedures for other injuries |
19 043 |
574 |
3.0% (2.8–3.3%) |
|||||||||||
|
G48 |
Colonoscopy |
18 006 |
526 |
2.9% (2.7–3.2%) |
|||||||||||
|
K60 |
Diabetes |
23 615 |
651 |
2.8% (2.5–3.0%) |
|||||||||||
|
|
|||||||||||||||
|
|
|||||||||||||||
Received 16 August 2019, accepted 6 December 2019
- Michael Montalto1
- Patrick McElduff2
- Kristy Hardy3
- 1 Epworth Health Care, Melbourne, VIC
- 2 University of Newcastle, Newcastle, NSW
- 3 Baxter Health Care, Sydney, NSW
Baxter Australia provided funding to Health Roundtable for data extraction, and to Health Policy Analysis for data analysis.
No relevant disclosures.
- 1. Cheng J, Montalto M, Leff B. Hospital at home. Clin Geriatr Med 2009; 25: 79–91.
- 2. Ticona L, Schulman KA. Extreme home makeover: the role of intensive home health care. N Eng J Med 2016; 375: 1707–1708.
- 3. Montalto M. The 500‐bed hospital that isn't there: the Victorian Department of Health review of the Hospital in the Home program. Med J Aust 2010; 193: 598–601. https://www.mja.com.au/journal/2010/193/10/500-bed-hospital-isnt-there-victorian-department-health-review-hospital-home.
- 4. Shepperd S, Doll H, Angus RM, et al. Avoiding hospital admission through provision of hospital care at home: a systematic review and meta‐analysis of individual patient data. CMAJ 2009; 180: 175–182.
- 5. Conley J, O'Brien CW, Leff BA, et al. Alternative strategies to inpatient hospitalization for acute medical conditions: a systematic review. JAMA Intern Med 2016; 176: 1693–1702.
- 6. Leff B, Burton L, Mader S, et al. Satisfaction with hospital in the home care. J Am Geriatr Soc 2006; 54: 1355–1363.
- 7. Leff B, Burton L, Mader S, et al. Hospital at home: feasibility and outcomes of a program to provide hospital level care at home for acutely ill older patients. Ann Int Med 2005; 143: 798–808.
- 8. Caplan CA, Sulaiman NS, Mangin DA, et al. A meta‐analysis of “hospital in the home”. Med J Aust 2012; 197: 512–519. https://www.mja.com.au/journal/2012/197/9/meta-analysis-hospital-home.
- 9. McIntyre R, Ruth D, Anzari Z. Hospital in the home is cost saving for appropriately selected patients: a comparison with in‐hospital care. Int J Qual Health Care 2002; 14: 285–293.
- 10. Ricauda NA, Tibaldi V, Marinello R, et al. Acute ischemic stroke in elderly patients treated in hospital at home: a cost minimization analysis. J Am Geriatr Soc 2005; 5: 1442–1443.
- 11. Montalto M. How safe is hospital‐in‐the‐home care? Med J Aust 1998; 168: 277–280.
- 12. Montalto M, Lui B, Mullins A, Woodmason K. Medically‐managed hospital in the home: 7 year study of mortality and unplanned interruption. Aust Health Rev 2010; 34: 269–275.
- 13. Shepperd S, Doll H, Angus RM, et al. Admission avoidance hospital at home. Cochrane Database Syst Rev 2008; CD007491.
- 14. Jacobs JM, Cohen A, Rozengarten O, et al. Closure of a home hospital program: impact on hospitalization rates. Arch Gerontol Geriatr 2007; 45: 179–189.
- 15. Australian Institute of Health and Welfare. Hospital resources 2015–16: Australian hospital statistics (Cat. no. HSE 190; Health services series, no. 78); p. 78. Canberra: AIHW, 2017.
- 16. Australian Institute of Health and Welfare. Hospital resources 2016–17: Australian hospital statistics. https://www.aihw.gov.au/getmedia/a5c95801-198c-40d1-879b-46d7cba44597/aihw-hse-205-ahs-hospital-resources-2016-17-tables.xlsx (viewed Oct 2018).
- 17. Liang K, Zeger SI. Longitudinal data analysis using generalised linear models. Biometrika 1986; 73: 13–22.
- 18. Lloyd K, Stuart P. Least squares quantization in PCM. IEEE T Inform Theory 1982; 28: 129–137.
Abstract
Objective: To describe uptake of hospital in the home (HIH) by major Australian hospitals and the characteristics of patients and their HIH admissions; to assess change in HIH admission numbers relative to total hospital activity.
Design: Descriptive, retrospective study of HIH activity, analysing previously collected census data for all multi‐day hospital inpatient admissions to included hospitals during the period 1 January 2011 – 31 December 2017.
Setting, participants: Nineteen principal referrer hospital members of the Health Roundtable in Australia.
Main outcome measures: HIH admissions by diagnosis‐related group (DRG); patient and admission characteristics.
Results: 80 167 of 2 185 421 admissions to the 19 hospitals included HIH care, or 3.7% (95% CI, 3.6–3.7%) of all admissions. Median length of stay for admissions including HIH (7.3 days; IQR, 3.1–14 days) was longer than that for those that did not (2.7 days; IQR, 1.6–5.1 days). For HIH admissions, the proportion of men was higher (54.4% v 45.9%), the proportion of patients who died in hospital was lower (0.3% v 1.4%), and re‐admission within 28 days was less frequent (2.3% v 3.6%). The 50 DRGs with greatest HIH activity encompassed 65 811 HIH admissions (82.1%), or 8.4% (95% CI, 8.4–8.5%) of all admissions in these DRGs. HIH admission numbers grew more rapidly than non‐HIH admissions, but the difference was not statistically significant.
Conclusions: HIH care is most frequently provided to patients requiring hospital treatment related to infections, venous thromboembolism, or post‐surgical care. Its use could be expanded in clinical areas where it is currently used, and extended to others where it is not. HIH activity is growing. It should be systematically monitored and reported to allow better overview of its use and outcomes.