


The known: Take home naloxone programs are effective for preventing opioid overdose deaths. Most overdoses in Australia involve pharmaceutical opioids, but little is known about how much naloxone is supplied in primary care, where most pharmaceutical opioids are prescribed.
The new: The volume of naloxone supplied on individual prescriptions accounted for less than 3% of all naloxone supplied to pharmacies. Further, despite the 2016 scheduling change that permits naloxone supply without prescription, the over‐the‐counter supply of naloxone did not increase between 2014 and 2018.
The implications: Although prescriptions are no longer a barrier to obtaining naloxone, further strategies are required to increase the supply of take home naloxone.
In response to the growing incidence of opioid‐related harms,1 emphasis on overdose prevention has increased. There is good evidence that take home naloxone programs, in which potential overdose witnesses (laypersons) are trained to identify overdoses and to administer naloxone, are effective for reducing overdose mortality.2 Most research has focused on education and training needs related to naloxone provision and the perspectives of those who supply naloxone or potentially administer it in the community.3,4,5,6 How much naloxone is supplied in the community, and how changes in regulations influence naloxone supply, are less well investigated.
In Australia, take home naloxone was first available in the Australian Capital Territory, in 2012; other states and territories soon followed, but their programs are smaller in scale and targeted at people who inject drugs or attend drug treatment services.7 The Pharmaceutical Benefits Scheme (PBS) has subsidised take home naloxone since 2013, but few programs have focused on broader community supply, including to people receiving prescribed opioids. This gap in coverage is important, as 70% of opioid‐related deaths in Australia are caused by pharmaceutical opioids.8 Impediments to broader naloxone supply have included its cost, its requiring a prescription,6 and the stigma attached to substance use.7
The effect of naloxone laws on its supply has been investigated.9,10,11 A study in the United States found that its availability increased and opioid‐related mortality declined after pharmacists were permitted to directly supply naloxone.9 In February 2016, naloxone was down‐scheduled to an over‐the‐counter medicine in Australia, removing the need for a prescription.7 However, unlike some parts of the US, over‐the‐counter naloxone is not subsidised in Australia.
It is unclear whether permitting the sale of over‐the‐counter naloxone has effectively increased naloxone availability in Australia. Naloxone can currently be obtained on prescription (PBS‐subsidised) or over the counter (non‐subsidised), and is available to authorised practitioners as prescriber bag supplies for emergency use. These various supply routes have not been investigated in detail.
We therefore analysed data on naloxone sales and prescribing to characterise community naloxone supply during 2014–2018, comparing supply types and supply in different Australian states and territories. We also examined whether the rescheduling of naloxone in 2016 influenced naloxone supply.
Methods
We conducted a retrospective observational study of national and jurisdictional naloxone supply in Australia based on the analysis of two population level datasets: PBS prescriptions data and naloxone sales data. We examined community pharmacy naloxone supply, as this was the target of its rescheduling in 2016; supply to hospitals and ambulances was outside the scope of our study.
Data sources
Data on prescribed naloxone supply was obtained by searching the PBS database12 for naloxone prescription codes, including archived codes for delisted naloxone products sold during the study period (provided by the PBS statistics team), for the period January 2014 – December 2018 (Supporting Information).We distinguished between individual prescription (PBS‐subsidised prescribed naloxone) and prescriber bag naloxone. Prescriber bag naloxone is for use by prescribers in emergencies, is not intended for further distribution, and is only accessible in small quantities once a month. To determine whether changes in prescriber bag supply were specific to naloxone, we also examined two common prescriber bag medications unrelated to opioid use, benzylpenicillin and prochlorperazine (Supporting Information).
Data on wholesale naloxone sales to community pharmacies were obtained through a third party agreement with IQVIA (www.iqvia.com), a health information company that maintains a database of pharmaceutical manufacturer sales. IQVIA provided the numbers of each naloxone product sold, by month, during January 2014 – December 2018. Supply data — including product type and strength — were available separately for each Australian state and territory, except that sales data for New South Wales and ACT were combined. Units sold were standardised to naloxone 400 μg unit equivalents to allow the jurisdictional and national aggregation of data for naloxone in different formulations (ampoules, pre‐filled syringes [Minijet, Prenoxad]; Supporting Information).
Statistical analysis
Monthly supply of prescribed naloxone was calculated by aggregating PBS data for individual and prescriber bag prescriptions. The amount of naloxone supplied to pharmacies not associated with a prescriber bag or individual prescription — non‐dispensed naloxone — was calculated by subtracting the total prescribed naloxone volume from the overall sales volume. Non‐dispensed naloxone, sold to pharmacies but not accounted for by prescription supply, includes naloxone sold without a prescription (ie, over the counter) and naloxone that may ultimately pass its expiry date and be destroyed. Research has identified that these are the three main outcomes for pharmacy naloxone, with stock expiry frequent because of its relatively short official shelf‐life.13 Naloxone can be provided on private (ie, not PBS‐subsidised) prescriptions, but this has not been described in naloxone‐related research in Australia, and could therefore be assumed to be rare.
Naloxone supply data are presented as raw annual volumes and as population‐adjusted monthly supply rates (400 μg units per 100 000 Australian residents14), nationally and by jurisdiction. Population estimates were not age‐adjusted.
As data for the outcome variable were statistically overdispersed (variance greater than the mean value), which is typical of pharmaceutical supplies data, monthly rates of change in the supply of PBS‐subsidised, prescriber bag, non‐dispensed, and total naloxone were assessed in negative binomial regression models.
The impact of rescheduling on monthly non‐dispensed naloxone supply was assessed in interrupted time series analyses,15 the intervention point specified as 1 February 2016. The time series were modelled using generalised linear regression with a negative binomial probability distribution, a log‐link function, and Newey–West standard errors. In exploratory analyses and for assumption testing, stationarity of the time series was examined with Dickey–Fuller unit root testing of the baseline time series period. The appropriate lag for modelling a serial correlation was determined from autocorrelation and partial autocorrelation function plots. To evaluate the effect of monthly changes in supply, models with and without a monthly indicator variable were compared, with the simpler model retained if improvement of model fit was not statistically significant. The 95% confidence intervals (CIs) for mean change were derived from annual rates; 95% CIs for incidence rate ratios (IRRs) were derived from the modelled monthly data. P < 0.05 (two‐tailed) was deemed statistically significant. All analyses were conducted in Stata 16.
Ethics approval
Ethics approval was not required for our analysis of population‐level (non‐identifiable) data.
Results
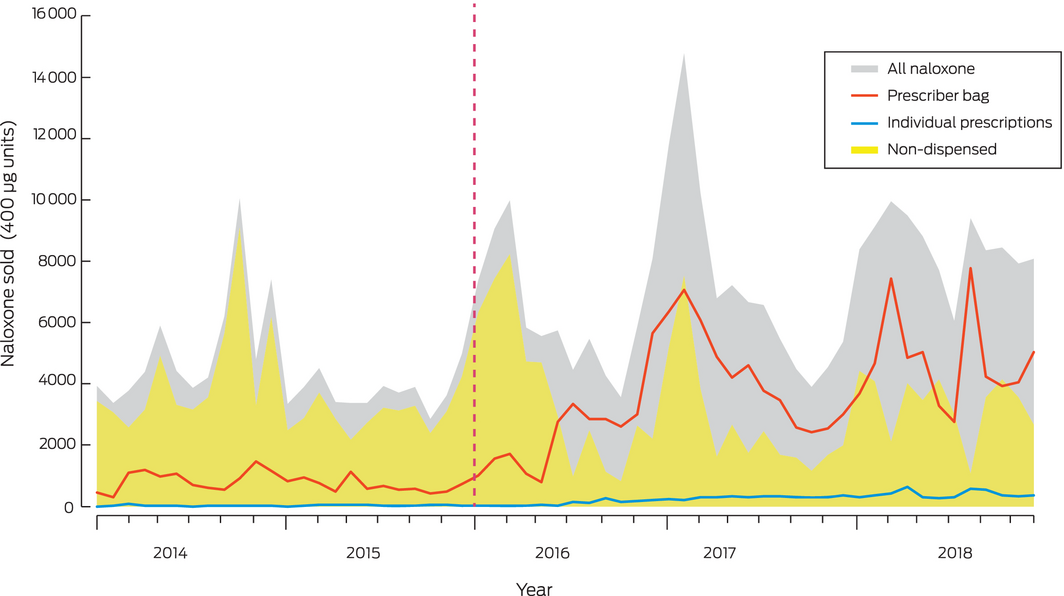
During 2014–2018, 372 351 400 μg units of naloxone were sold to community pharmacies. Most (267 766 units, 71.9%) were sold as ampoules, available throughout the study period; 90 545 units (24.3%) were sold as Minijets (supply ceased February 2017) and 14 040 (3.8%) as multi‐dose prefilled syringes (Prenoxad; supply commenced February 2017) (Box 1). Non‐dispensed naloxone (sold over the counter or expired) accounted for 205 866.5 units (55.3%); 155 841 units (41.8%) were dispensed for prescriber bags, and 10 643.5 units (2.9%) for individual PBS‐subsidised prescriptions.
Changes in supply volume, 2014–2018
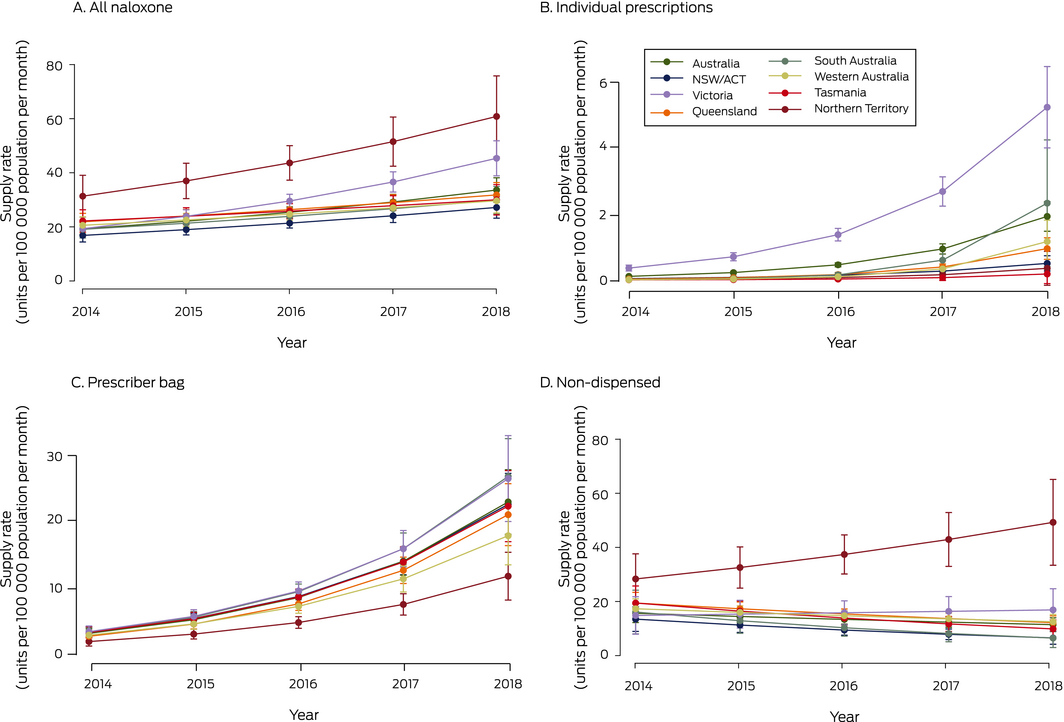
Population‐adjusted national total naloxone supply increased from 22.1 units (95% CI, 16.9–27.3 units) per 100 000 population in January 2014 to 34.0 units (95% CI, 31.4–36.6 units) per 100 000 population in December 2018 (per year: IRR, 1.15; 95% CI, 1.09–1.22) (Box 2; Supporting Information, table 1). Total supply increased in most jurisdictions, with the greatest annual proportional increase in Victoria (IRR, 1.24; 95% CI, 1.17–1.32). In contrast, the naloxone supply in Tasmania did not change significantly (per year: IRR, 1.08; 95% CI, 1.00–1.17) (Box 2, Box 3).
The annual volume of annual naloxone supplied for individual prescriptions was small (2.9% of all naloxone supplied), but the monthly population‐adjusted dispensing rate was higher in 2018 than in 2014 in all states. Most individually prescribed naloxone was supplied in Victoria (73% of all naloxone individually prescribed during the study period), where prescribed supply almost doubled between 2014 and 2018 (per year: IRR, 1.95; 95% CI, 1.77–2.16). The annual proportional increase in prescribed naloxone supply was greatest in South Australia (IRR, 3.88; 95% CI, 2.52–5.96) (Box 2, Box 3; Supporting Information, table 2).
Prescriber bag naloxone supply increased in all jurisdictions at a similar rate (per year: IRR, 1.56–1.68; Box 2, Box 3, Supporting Information, table 3). Similar increases did not apply to the two other prescriber bag items assessed (Supporting Information, figure).
The Northern Territory was the only jurisdiction in which the annual supply of non‐dispensed naloxone increased (per year: IRR, 1.15; 95% CI, 1.01–1.30); in other states and territories, non‐dispensed supply either declined (NSW/ACT, Queensland, SA, Tasmania) or was steady (Victoria, Western Australia) (Box 2, Box 3; Supporting Information, table 4).
Interrupted time series analysis of non‐dispensed naloxone supply
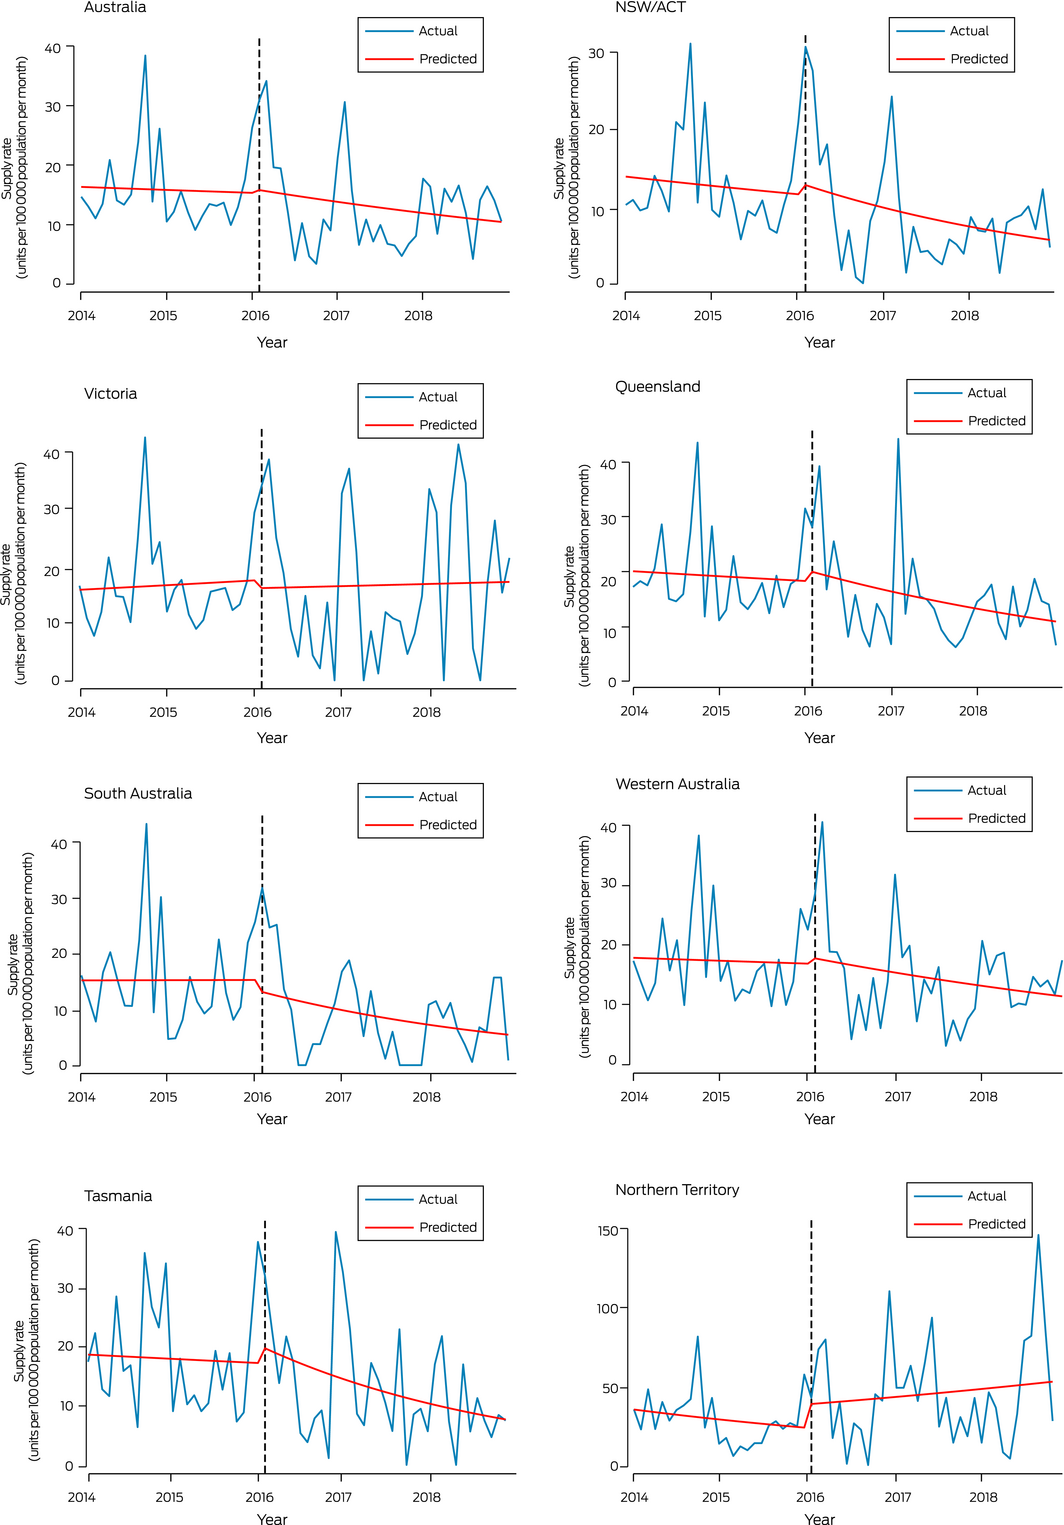
Interrupted time series analysis did not detect statistically significant changes in non‐dispensed naloxone supply, nationally or in individual jurisdictions, immediately after rescheduling (ie, February 2016) or subsequently (February 2016 – December 2018) (Box 4, Box 5).
Discussion
Total naloxone supply in Australia increased between 2014 and 2018; the prescriber bag supply increased significantly, as did naloxone supplied on individual prescriptions (although the absolute rise was small), while the volume of non‐dispensed naloxone did not change significantly. Individually prescribed naloxone accounts for only 2.9% of all community naloxone, which suggests that take home naloxone coverage is limited. The lack of change in the non‐dispensed volume of naloxone after rescheduling suggests that only a small volume of naloxone is sold over the counter.
Overall increases in naloxone supply were mainly attributable to increases in prescriber bag naloxone from 2015. A possible contributing factor to this rise was training and education about opioid overdose in awareness‐raising campaigns during the rescheduling period,16,17 increasing prescriber confidence about carrying naloxone.18
In contrast to most jurisdictions, the non‐dispensed naloxone volume increased in the NT, perhaps indicating the importance of subsidising over‐the‐counter naloxone: the NT AIDS and Hepatitis Council Naloxone Access Program provides free naloxone through community pharmacies in Darwin, Palmerston, and Alice Springs.19 Given the small population of NT and low number of units supplied, this finding should, however, be treated with caution.
The non‐dispensed naloxone volume also increased in Victoria, as did the volume of individually prescribed naloxone. In response to the high number of accidental opioid‐related deaths in Victoria,20 the state government has provided considerable support for naloxone programs, and a number of key organisations have entered into partnerships with Harm Reduction Victoria (HRVic) to provide naloxone and education about opioid overdose.7 As part of the HRVic program, prescription naloxone was supplied to participants during free naloxone training sessions; the estimated volume of naloxone supplied in this manner accounts for more than 80% of individually prescribed naloxone in Victoria (personal communication: Jane Dicka, Harm Reduction Victoria, 2019). Few of the take home naloxone programs in other Australian jurisdictions focus on naloxone in primary care settings to the same degree as in Victoria.7
Given the rise in opioid overdose rates in Australia,7 and that overdose is primarily associated with pharmaceutical opioids,8 it might be expected that community naloxone supply would increase after rescheduling. However, non‐dispensed naloxone supply did not increase immediately after rescheduling, nor subsequently; in fact, it declined in some jurisdictions. The non‐dispensed naloxone supply increased slightly in most states around the time of rescheduling, which may reflect pharmacies stockpiling naloxone in anticipation of future demand, but these increases were not statistically significant and were not maintained after rescheduling. These patterns in population level data accord with qualitative data from interviews during 2016–2017 with Australian pharmacists, who reported they were not receiving requests for take home naloxone, and that naloxone ordered prior to rescheduling had passed its expiry date and had not been replaced.21
Fewer than half the 372 351 units of naloxone sold during 2014–2018 were supplied on prescription, and only 2.9% was distributed on individual prescriptions. We estimate that only 4268 unique packs were dispensed in this way during the study period, or 853 packets per year. As it is estimated that there are 93 000 people who inject drugs in Australia,22 a maximum 4.6% naloxone coverage could be achieved by this level of supply, assuming that all naloxone was supplied as single packs and that none was used (for reversing opiate toxicity), lost, or expired.
Our findings indicate that requiring a prescription was not the only barrier to expanding naloxone supply, and removing this requirement is only one step towards improving naloxone access in Australia. Providing subsidised over‐the‐counter naloxone through pharmacies should be considered; in the USA, opioid overdose‐related mortality declined substantially following a change in legislation that allowed pharmacists to supply insurance‐subsidised naloxone.9 User‐friendly naloxone preparations, such as intranasal naloxone, have also been marketed in the USA, but some are prohibitively expensive and unlikely to become widely available in Australia.23
Despite rescheduling in Australia, increased over‐the‐counter naloxone supply did not ensue, suggesting that it takes more than a change in legislation to increase naloxone access. In February 2019, the Federal Health Minister announced a naloxone pilot program in South Australia and New South Wales (and subsequently in Western Australia), under which naloxone will be available at no cost to the public.24 The effects of this pilot program on naloxone supply and, more importantly, on opioid‐related mortality should be monitored.
Limitations
First, we were unable to differentiate between over‐the‐counter and expired naloxone in the category “non‐dispensed naloxone”. Naloxone expiring without being sold or dispensed is common,13 suggesting that this may account for a large proportion of non‐dispensed naloxone. Nevertheless, had the non‐dispensed volume increased after rescheduling, it would have been reasonable to attribute this growth to over‐the‐counter sales, as naloxone could not be sold without a prescription before February 2016. Second, we did not know the ultimate fate of naloxone supplied for prescriber bags. It is not intended that it be supplied as take home naloxone and it is not packaged for take home supply, but anecdotal reports indicate that prescribers occasionally provide naloxone to patients for later use. It is likely that most prescriber bag naloxone expires and is replaced, but we were unable to estimate how much is not used. Third, we were unable to account for the impact of stock shortages on supply. Stocks of the Minijet product were sometimes low in 2016 and 2017 during its phase‐out following rescheduling; Prenoxad was made available under an S19 exemption, but shortages persisted until late 2018.25 These supply problems may have restricted the ability to expand the supply of take home naloxone. Finally, we analysed only the impact of rescheduling on naloxone distributed by community pharmacies, but naloxone can also be provided by hospitals and other specialist health services. Take home naloxone supplied by specialist services could be investigated to provide a broader picture of the overall naloxone supply in Australia.
Conclusion
The rescheduling of naloxone did not significantly influence its non‐dispensed supply in primary care, indicating that only a small amount of take home naloxone is likely to be supplied over the counter by community pharmacies. Our findings indicate that factors such as cost, provider training, and consumer awareness warrant further examination. It is critical that programs bolster community access to improve naloxone coverage in Australia.
Box 2 – Population‐adjusted naloxone supply, Australia, January 2014 – December 2028, by supply type and jurisdiction
|
|
400 μg units supplied 2014–2018, annual mean |
Monthly population‐adjusted rate, units per 100 000 population (95% CI) |
Incidence rate ratio, per year (95% CI) |
||||||||||||
|
January 2014 |
December 2018 |
||||||||||||||
|
|
|||||||||||||||
|
Total naloxone |
|
|
|
|
|||||||||||
|
Australia |
74 470.2 |
22.1 (16.9–27.3) |
34.0 (31.4–36.6) |
1.15 (1.09–1.22) |
|||||||||||
|
New South Wales/ACT |
20 894.6 (28.1%) |
19.1 (14.6–23.6) |
26.3 (24.1–28.4) |
1.13 (1.06–1.20) |
|||||||||||
|
Victoria |
22 852.8 (30.7%) |
22.7 (16.7–28.8) |
49.1 (42.6–55.6) |
1.24 (1.17–1.32) |
|||||||||||
|
Queensland |
15 320.4 (20.6%) |
24.6 (18.6–30.7) |
31.0 (27.8–34.2) |
1.10 (1.04–1.17) |
|||||||||||
|
South Australia |
4888.0 (6.6%) |
21.7 (15.0–28.4) |
29.1 (24.9–33.4) |
1.12 (1.05–1.20) |
|||||||||||
|
Western Australia |
7609.8 (10.2%) |
23.3 (17.6–28.9) |
28.9 (24.4–33.3) |
1.10 (1.03–1.17) |
|||||||||||
|
Tasmania |
1593.4 (2.1%) |
24.9 (18.9–30.9) |
28.0 (22.9–33.1) |
1.08 (1.00–1.17) |
|||||||||||
|
Northern Territory |
1311.2 (1.8%) |
40.5 (30.6–50.4) |
60.0 (34.4–85.5) |
1.18 (1.07–1.31) |
|||||||||||
|
Individually prescribed naloxone |
|
|
|
|
|||||||||||
|
Australia |
2128.7 |
0.12 (0.06–0.18) |
1.6 (1.3–1.9) |
2.05 (1.86–2.26) |
|||||||||||
|
New South Wales/ACT |
198.4 (9.3%) |
0.04 (0.01–0.06) |
0.41 (0.17–0.65) |
1.87 (1.53–2.28) |
|||||||||||
|
Victoria |
1561.6 (73.3%) |
0.40 (0.18–0.61) |
4.5 (3.3–5.7) |
1.95 (1.77–2.16) |
|||||||||||
|
Queensland |
178.9 (8.4%) |
0.03 (0.01–0.05) |
0.70 (0.48–0.93) |
2.41 (2.04–2.85) |
|||||||||||
|
South Australia |
95.6 (4.5%) |
0.01 (–0.00 to 0.02) |
1.1 (0.66–1.6) |
3.88 (2.52–5.96) |
|||||||||||
|
Western Australia |
87.1 (4.1%) |
0.01 (0.00–0.02) |
0.67 (0.37–0.98) |
3.47 (2.54–4.73) |
|||||||||||
|
Tasmania |
4.4 (0.21%) |
0.02 (–0.02 to 0.05) |
0.26 (–0.04 to 0.55) |
2.54 (1.05–6.16) |
|||||||||||
|
Northern Territory |
3.7 (0.17%) |
0.000 |
0.42 (–0.12 to 0.97) |
2.22 (1.05–4.70) |
|||||||||||
|
Prescriber bag naloxone |
|
|
|
|
|||||||||||
|
Australia |
31 168.2 |
3.8 (2.8–4.7) |
18.9 (15.1–22.8) |
1.63 (1.50–1.78) |
|||||||||||
|
New South Wales/ACT |
10 487.6 (33.6%) |
3.8 (2.6–5.0) |
18.2 (16.4–20.0) |
1.61 (1.48–1.75) |
|||||||||||
|
Victoria |
9074.4 (29.1%) |
4.1 (3.0–5.1) |
23.3 (12.9–33.7) |
1.66 (1.50–1.84) |
|||||||||||
|
Queensland |
5654.6 (18.1%) |
3.4 (2.4–4.4) |
17.4 (14.6–20.1) |
1.66 (1.52–1.82) |
|||||||||||
|
South Australia |
2439.6 (7.8%) |
3.7 (2.6–4.8) |
19.8 (17.3–22.3) |
1.68 (1.54–1.84) |
|||||||||||
|
Western Australia |
2687.6 (8.6%) |
3.7 (2.6–4.8) |
13.8 (11.2–16.4) |
1.57 (1.42–1.73) |
|||||||||||
|
Tasmania |
656 (2.1%) |
3.8 (2.6–5.1) |
18.2 (14.7–21.8) |
1.60 (1.45–1.78) |
|||||||||||
|
Northern Territory |
168.4 (0.54%) |
2.3 (1.1–3.5) |
9.4 (6.3–12.6) |
1.56 (1.37–1.78) |
|||||||||||
|
Non‐dispensed naloxone |
|
|
|
|
|||||||||||
|
Australia |
41173.3 |
18.2 (13.7–22.8) |
13.4 (11.17–15.7) |
0.93 (0.85–1.01) |
|||||||||||
|
New South Wales/ACT |
10 208.6 (24.8%) |
15.3 (11.2–19.4) |
7.6 (6.1–9.2) |
0.85 (0.75–0.96) |
|||||||||||
|
Victoria |
12 217.9 (29.7%) |
18.3 (12.9–23.6) |
21.3 (12.0–30.6) |
1.03 (0.86–1.23) |
|||||||||||
|
Queensland |
9486.9 (23.0%) |
21.2 (16.1–26.4) |
12.9 (10.7–15.1) |
0.90 (0.83–0.97) |
|||||||||||
|
South Australia |
2352.8 (5.7%) |
18.0 (12.2–23.8) |
8.2 (5.3–11.1) |
0.81 (0.67–0.98) |
|||||||||||
|
Western Australia |
4835.1 (11.7%) |
19.6 (14.7–24.4) |
14.4 (12.3–16.5) |
0.93 (0.85–1.01) |
|||||||||||
|
Tasmania |
933.0 (2.3%) |
21.0 (15.9–26.2) |
9.5 (5.4–13.6) |
0.85 (0.75–0.97) |
|||||||||||
|
Northern Territory |
1139.1 (2.8%) |
38.2 (29.2–47.2) |
50.1 (27.1–73.2) |
1.15 (1.01–1.30) |
|||||||||||
|
|
|||||||||||||||
|
CI = confidence interval.Annual rates (2014–2018) are included in the online Supporting Information, tables 1 to 4; mean monthly rates for the study period and mean annual proportional changes and included in the online Supporting Information, table 5.Converted packets with various dosages equate to 4268 naloxone packs or 853 packs per year. |
|||||||||||||||
Box 3 – Population‐adjusted naloxone supply rates (with 95% confidence intervals), Australia, January 2014 – December 2018, by supply type and jurisdiction
Box 4 – Interrupted time series analysis of non‐dispensed naloxone supply, Australia, January 2014 – December 2018, by jurisdiction
|
Period of change |
Incident rate ratio (95% CI) |
||||||||||||||
|
|
|||||||||||||||
|
Australia |
|
||||||||||||||
|
Pre‐intervention |
1.00 (0.98–1.02) |
||||||||||||||
|
Intervention |
1.03 (0.60–1.77) |
||||||||||||||
|
Post‐intervention |
0.99 (0.96–1.02) |
||||||||||||||
|
Post‐ v pre‐intervention |
0.99 (0.97–1.01) |
||||||||||||||
|
NSW/ACT |
|
||||||||||||||
|
Pre‐intervention |
0.99 (0.97–1.02) |
||||||||||||||
|
Intervention |
1.11 (0.59–2.11) |
||||||||||||||
|
Post‐intervention |
0.98 (0.95–1.02) |
||||||||||||||
|
Post‐ v pre‐intervention |
0.98 (0.95–1.00) |
||||||||||||||
|
Victoria |
|
||||||||||||||
|
Pre‐intervention |
1.00 (0.98–1.03) |
||||||||||||||
|
Intervention |
0.92 (0.50–1.70) |
||||||||||||||
|
Post‐intervention |
1.00 (0.96–1.03) |
||||||||||||||
|
Post‐ v pre‐intervention |
1.00 (0.98–1.03) |
||||||||||||||
|
Queensland |
|
||||||||||||||
|
Pre‐intervention |
1.00 (0.98–1.01) |
||||||||||||||
|
Intervention |
1.10 (0.72–1.69) |
||||||||||||||
|
Post‐intervention |
0.99 (0.96–1.01) |
||||||||||||||
|
Post‐ v pre‐intervention |
0.98 (0.97–1.00) |
||||||||||||||
|
South Australia |
|
||||||||||||||
|
Pre‐intervention |
1.00 (0.98–1.03) |
||||||||||||||
|
Intervention |
0.86 (0.44–1.68) |
||||||||||||||
|
Post‐intervention |
0.97 (0.94–1.01) |
||||||||||||||
|
Post‐ v pre‐intervention |
0.98 (0.95–1.00) |
||||||||||||||
|
Western Australia |
|
||||||||||||||
|
Pre‐intervention |
1.00 (0.98–1.02) |
||||||||||||||
|
Intervention |
1.05 (0.64–1.73) |
||||||||||||||
|
Post‐intervention |
0.99 (0.96–1.02) |
||||||||||||||
|
Post‐ v pre‐intervention |
0.99 (0.97–1.00) |
||||||||||||||
|
Tasmania |
|
||||||||||||||
|
Pre‐intervention |
1.00 (0.97–1.03 |
||||||||||||||
|
Intervention |
1.15 (0.61–2.15) |
||||||||||||||
|
Post‐intervention |
0.98 (0.94–1.01) |
||||||||||||||
|
Post‐ v pre‐intervention |
0.97 (0.96–(0.99 |
||||||||||||||
|
Northern Territory |
|
||||||||||||||
|
Pre‐intervention |
0.98 (0.96–1.01) |
||||||||||||||
|
Intervention |
1.66 (0.84–3.26) |
||||||||||||||
|
Post‐intervention |
1.03 (0.99–1.07) |
||||||||||||||
|
Post‐ v pre‐intervention |
1.01 (0.98–1.04) |
||||||||||||||
|
|
|||||||||||||||
|
CI = confidence interval.Pre‐intervention, January 2014 – January 2016; intervention, February, 2016; post intervention, February 2016 – December 2018. The intervention and post‐intervention incidence rate ratios are calculated separately. |
|||||||||||||||
Received 20 August 2019, accepted 26 November 2019
- Wai Chung Tse1,2
- Paul Sanfilippo1
- Tina Lam1
- Paul Dietze1,3
- Suzanne Nielsen1
- 1 Monash Addiction Research Centre, Monash University, Melbourne, VIC
- 2 Monash University, Melbourne, VIC
- 3 Centre for Epidemiology and Population Health Research, Burnet Institute, Melbourne, VIC
Wai Chung Tse is supported by an Eastern Health Clinical School Winter Scholarship. Suzanne Nielsen (1163961) and Paul Dietze (1136908) hold National Health and Medical Research Council Research Fellowships.
Suzanne Nielsen and Paul Dietze have received funding from Indivior. Suzanne Nielsen has received research funding from Seqirus, and Paul Dietze has received research funding from Gilead, all untied and unrelated to this investigation. Suzanne Nielsen and Paul Dietze have attended (unpaid) a Mundipharma advisory board meeting in relation to a naloxone product.
- 1. Ciccarone D. The triple wave epidemic: supply and demand drivers of the US opioid overdose crisis. Int J Drug Policy 2019; 71: 183–188.
- 2. Langham S, Wright A, Kenworthy J, et al. Cost‐effectiveness of take‐home naloxone for the prevention of overdose fatalities among heroin users in the United Kingdom. Value Health 2018; 21: 407–415.
- 3. Clark KA, Wilder MC, Winstanley LE. A systematic review of community opioid overdose prevention and naloxone distribution programs. J Addict Med 2014; 8: 153–163.
- 4. Ashrafioun L, Gamble S, Herrmann M, Baciewicz G. Evaluation of knowledge and confidence following opioid overdose prevention training: a comparison of types of training participants and naloxone administration methods. Subst Abuse 2016; 37: 76–81.
- 5. Dietze PM, Stare M, Cogger S, et al. Knowledge of naloxone and take‐home naloxone programs among a sample of people who inject drugs in Australia: variations across capital cities. Drug Alcohol Rev 2018; 37: 457–463.
- 6. Nielsen S, Menon N, Larney S, et al. Community pharmacist knowledge, attitudes and confidence regarding naloxone for overdose reversal. Addiction 2016; 111: 2177–2186.
- 7. Dwyer R, Olsen A, Fowlie C, et al. An overview of take‐home naloxone programs in Australia. Drug Alcohol Rev 2018; 37: 440–449.
- 8. Roxburgh A, Hall WD, Dobbins T, et al. Trends in heroin and pharmaceutical opioid overdose deaths in Australia. Drug Alcohol Depend 2017; 179: 192–198.
- 9. Abouk R, Pacula RL, Powell D. Association between state laws facilitating pharmacy distribution of naloxone and risk of fatal overdose. JAMA Intern Med 2019; 179: 805–811.
- 10. Tobin K, Clyde C, Davey‐Rothwell M, Latkin C. Awareness and access to naloxone necessary but not sufficient: examining gaps in the naloxone cascade. Int J Drug Policy 2018; 59: 94–97.
- 11. Nielsen S, Van Hout MC. What is known about community pharmacy supply of naloxone? A scoping review. Int J Drug Policy 2016; 32: 24–33.
- 12. Australian Department of Human Services. Pharmaceutical Benefits Schedule item reports 2019. http://medicarestatistics.humanservices.gov.au/statistics/pbs_item.jsp (viewed Feb 2019).
- 13. Pruyn S, Frey J, Baker B, et al. Quality assessment of expired naloxone products from first‐responders’ supplies. Prehospital Emergency Care 2018; 23: 1–7.
- 14. Australian Bureau of Statistics. Australian demographic statistics, Dec 2018. June 2019. https://www.abs.gov.au/AUSSTATS/abs@.nsf/second+level+view?ReadForm&prodno=3101.0&viewtitle=Australian%20Demographic%20Statistics%7EDec%202018%7EPrevious%7E20/06/2019&&tabname=Past%20Future%20Issues&prodno=3101.0&issue=Dec%202018&num=&view (viewed June 2019).
- 15. Linden A. Conducting interrupted time‐series analysis for single‐ and multiple‐group comparisons. Stata J 2015; 15: 480–500.
- 16. Jauncey ME, Nielsen S. Community use of naloxone for opioid overdose. Aust Prescr 2017; 40: 137–140.
- 17. Nielsen S, Lenton S. Naloxone, how to save a life from opioid overdose. The Conversation [online], 31 Aug 2016. http://theconversation.com/weekly-dose-naloxone-how-to-save-a-life-from-opioid-overdose-63459 (viewed Feb 2019).
- 18. Matheson C, Pflanz‐Sinclair C, Aucott L, et al. Reducing drug related deaths: a pre‐implementation assessment of knowledge, barriers and enablers for naloxone distribution through general practice. BMC Fam Pract 2014; 15: 12.
- 19. Northern Territory AIDS and Hepatitis Council. NTAHC naloxone access program. 2017. https://www.ntahc.org.au/programs/harm-reduction-needle-and-syringe-program/ntahc-naloxone-access-program (viewed Feb 2019).
- 20. Penington Institute. Australia's annual overdose report 2018 [media release]. 2018. http://www.penington.org.au/australias-annual-overdose-report-2018 (viewed Feb 2019).
- 21. Olsen A, Lawton B, Dwyer R, et al. Why aren't Australian pharmacists supplying naloxone? Findings from a qualitative study. Int J Drug Policy 2019; 69: 46–52.
- 22. Larney S, Hickman M, Guy R, et al. Estimating the number of people who inject drugs in Australia. BMC Public Health 2017; 17: 757.
- 23. Wang A, Kesselheim AS. Government patent use to address the rising cost of naloxone: 28 USC section §1498 and Evzio. J Law Med Ethics 2018; 46: 472–484.
- 24. Australian Department of Health. $268 million to continue the battle against alcohol and drug misuse [media release]. 27 Feb 2019. https://www.health.gov.au/ministers/the-hon-greg-hunt-mp/media/268-million-to-continue-the-battle-against-alcohol-and-drug-misuse (viewed Feb 2019).
- 25. Therapeutic Goods Administration. Prenoxad 1 mg/mL solution for injection (naloxone hydrochloride). Medicine shortage: product supplied under section 19A. Updated Dec 2018. https://www.tga.gov.au/alert/prenoxad-1-mgml-solution-injection-naloxone-hydrochloride (viewed Feb 2019).
Abstract
Objectives: To characterise the community pharmacy supply of naloxone by supply type — individual prescription, prescriber bag, and non‐dispensed (supplied over the counter or expired) — during 2014–2018; to examine whether the 2016 rescheduling of naloxone as an over‐the‐counter drug influenced non‐dispensed naloxone supply volume.
Design, setting: Analysis of monthly naloxone prescriptions (Pharmaceutical Benefits Scheme) and sales data (IQVIA), 2014–2018, for Australia and by state and territory; time series analysis of non‐dispensed naloxone supply to assess effect of rescheduling on naloxone supply.
Major outcomes: Total naloxone supply to community pharmacies; prescribed and non‐dispensed naloxone supply.
Results: During 2014–2018, 372 351 400 μg units of naloxone were sold to community pharmacies: non‐dispensed naloxone accounted for 205 866.5 units (55.3%), prescriber bags for 155 841 units (41.8%), and individual prescriptions for 10 643.5 units (2.9%). Population‐adjusted national naloxone sales to community pharmacies increased between 2014 and 2018 (per year: incidence rate ratio [IRR], 1.15; 95% CI, 1.09–2.22). This increase was primarily attributable to increased volumes of prescriber bag naloxone (IRR, 1.63; 95% CI, 1.50–1.78) and, to a lesser extent, increased individual prescription supply (IRR, 2.04; 95% CI, 1.85–2.26). Non‐dispensed naloxone supply volume was unchanged at the national level (IRR, 0.93; 95% CI, 0.85–1.01); changes in non‐dispensed supply immediately following rescheduling and subsequently were not statistically significant in time series analyses for most jurisdictions.
Conclusions: Total naloxone supply to community pharmacies in Australia increased between 2014 and 2018, but rescheduling that enabled over‐the‐counter access did not significantly influence the volume of non‐dispensed naloxone.